neoformans
Variety
grubii
in Asia Correlate with HIV
Status and Show a Clonal Population Structure
Kantarawee Khayhan1,2,3., Ferry Hagen2,4., Weihua Pan5., Sitali Simwami6
, Matthew C. Fisher6, Retno Wahyuningsih7,8, Arunaloke Chakrabarti9, Anuradha Chowdhary10, Reiko Ikeda11,
Saad J. Taj-Aldeen12, Ziauddin Khan13, Margaret Ip14, Darma Imran15,16, Ridhawati Sjam7,
Pojana Sriburee17, Wanqing Liao5, Kunyaluk Chaicumpar18, Varaporn Vuddhakul19, Wieland Meyer20, Luciana Trilles20,21, Leo J. J. van Iersel22, Jacques F. Meis4,23, Corne´ H. W. Klaassen4, Teun Boekhout2,3,5*
1Department of Microbiology and Parasitology, Faculty of Medical Sciences, University of Phayao, Phayao, Thailand,2CBS-KNAW Fungal Biodiversity Centre, Department of Yeast and Basidiomycete Research, Utrecht, The Netherlands,3Department of Internal Medicine and Infectious Diseases, University Medical Center Utrecht, Utrecht University, Utrecht, The Netherlands, 4Department of Medical Microbiology and Infectious Diseases, Canisius-Wilhelmina Hospital, Nijmegen, The Netherlands, 5Department of Dermatology, Shanghai Key Laboratory of Molecular Medical Mycology, Institute of Dermatology and Medical Mycology, Changzheng Hospital, Secondary Military Medical University, Shanghai, People’s Republic of China,6Department of Infectious Disease Epidemiology, Faculty of Medicine, Imperial College London, London, United Kingdom,7Division of Mycology, Department of Parasitology, Faculty of Medicine, University of Indonesia, Jakarta, Indonesia,8Department of Parasitology, Faculty of Medicine, Christian University of Indonesia, Jakarta, Indonesia,9Department of Medical Microbiology, Postgraduate Institute of Medical Education and Research, Chandigarh, India,10Department of Medical Mycology, Vallabhbhai Patel Chest Institute, University of Delhi, Delhi, India,11Department of Microbiology, Meiji Pharmaceutical University, Tokyo, Japan,12Mycology Unit, Microbiology Division, Department of Laboratory Medicine and Pathology, Hamad Medical Corporation, Doha, Qatar,13Department of Microbiology, Faculty of Medicine, Health Sciences Centre, Kuwait University, Jabriya, Kuwait,14Department of Microbiology, Chinese University of Hong Kong, Hong Kong,15Department of Neurology, Faculty of Medicine, University of Indonesia, Jakarta, Indonesia,16Department of Neurology, Cipto Mangunkusumo Hospital, Jakarta, Indonesia,17Department of Microbiology, Faculty of Medicine, Chiang Mai University, Chiang Mai, Thailand,18Research and Diagnostic Center for Emerging Infectious Disease, and Department of Microbiology, Faculty of Medicine, Khon Kaen University, Khon Kaen, Thailand,19Department of Microbiology, Faculty of Science, Prince of Songkla University, Hat Yai , Thailand,20Molecular Mycology Research Laboratory, Centre for Infectious Diseases and Microbiology, Westmead Millennium Institute, Sydney Medical School–Westmead, The University of Sydney, Westmead Hospital, Sydney, Australia,21Laborato´rio de Micologia, Instituto de Pesquisa Clı´nica Evandro Chagas, Fundacao Oswaldo Cruz, Rio de Janeiro, Brazil,22Centre for Mathematics and Informatics, Amsterdam, The Netherlands,23Department of Medical Microbiology, Radboud University Nijmegen Medical Center, Nijmegen, The Netherlands
Abstract
Cryptococcosis is an important fungal disease in Asia with an estimated 140,000 new infections annually the majority of which occurs in patients suffering from HIV/AIDS.Cryptococcus neoformansvarietygrubii(serotype A) is the major causative agent of this disease. In the present study, multilocus sequence typing (MLST) using the ISHAM MLST consensus scheme for theC.neoformans/C.gattiispecies complex was used to analyse nucleotide polymorphisms among 476 isolates of this pathogen obtained from 8 Asian countries. Population genetic analysis showed that the AsianC.neoformansvar.grubii
population shows limited genetic diversity and demonstrates a largely clonal mode of reproduction when compared with the global MLST dataset. HIV-status, sequence types and geography were found to be confounded. However, a correlation between sequence types and isolates from HIV-negative patients was observed among the Asian isolates. Observations of high gene flow between the Middle Eastern and the Southeastern Asian populations suggest that immigrant workers in the Middle East were originally infected in Southeastern Asia.
Citation:Khayhan K, Hagen F, Pan W, Simwami S, Fisher MC, et al. (2013) Geographically Structured Populations ofCryptococcus neoformansVarietygrubiiin Asia Correlate with HIV Status and Show a Clonal Population Structure. PLoS ONE 8(9): e72222. doi:10.1371/journal.pone.0072222
Editor:Oscar Zaragoza, Instituto de Salud Carlos III, Spain
ReceivedMarch 11, 2013;AcceptedJuly 8, 2013;PublishedSeptember 3, 2013
Copyright:ß2013 Khayhan et al. This is an open-access article distributed under the terms of the Creative Commons Attribution License, which permits unrestricted use, distribution, and reproduction in any medium, provided the original author and source are credited.
Funding:This work was supported by a research grant from University of Phayao, Thailand (http://www.up.ac.th/). FH was funded by the Odo van Vloten Foundation, the Netherlands. WH was granted by the National Natural Science Foundation of China (no. 31270180) and the National Basic Research Program of China (no. 2013CB531606). MCF was granted by the Wellcome Trust (http://www.wellcome.ac.uk/) and the Biotechnology and Biological Sciences Research Council, grant number BB/D52637X/1 (www.bbsrc.ac.uk). TB and SJT were supported by a grant from the Qatar National Research Fund, grant number NPRP 5-298-3-086. The funders had no role in study design, data collection and analysis, decision to publish, or preparation of the manuscript.
Competing Interests: JFM has been a consultant to Astellas, Basilea, Merck and Schering-Plough and received speaker’s fees from Gilead, Janssen Pharmaceutica, Merck, Pfizer, and Schering-Plough. CHK received a grant from Pfizer. RW is currently receiving a grant from IIR-Pfizer for doing research on Indonesian Cryptococcus isolates. RW is a speaker for Pfizer and Astellas Pharma. All other authors: no potential conflicts of interest relating to employment, consultancy, patents, products in development or marketed products. The sponsors of the research played no decision-making role in the design, execution, analysis and reporting of the research. This does not alter the authors’ adherence to all the PLOS ONE policies on sharing data and materials.
* E-mail: [email protected]
Introduction
Cryptococcosis is one of the main fungal diseases in Asia due to the AIDS pandemic and is caused by members of theCryptococcus neoformans/C.gattiispecies complex [1,2]. In South and Southeast Asia, the number of HIV-infected patients that annually acquire cryptococcosis is estimated to be over 140,000 [3], with the majority of cases being caused byC. neoformansvar.grubii[4–12]. The causative agent is an encapsulated opportunistic pathogenic basidiomycetous yeast. Cryptococcosis caused byC.neoformansvar. grubii has also been reported to occur in immunocompetent individuals in the Asian region, e.g. from China, Japan, Korea and Taiwan [8,13–16]. In Vietnam, cryptococcosis in both immuno-compromised and immunocompetent individuals was found to be mainly caused by C.neoformans var.grubii [17].C. neoformansvar. grubii(serotype A) has a global distribution and is found in avian excreta, especially from pigeons, and decaying wood [18–21]. The other variety,C.neoformansvar.neoformans(serotype D), also has a worldwide distribution but is more frequently encountered in Europe [22,23].C. gattii(serotypes B and C), a sibling species ofC. neoformans, is associated with many tree species in tropical and subtropical regions [18,24–27] and is a major cause of cryptococ-cal meningitis in immunocompetent individuals. This latter species has also been reported as a causative agent in immunocompro-mised individuals, particularly HIV-infected patients and solid-organ transplant patients [19,28–31]. Since 1999,C.gattiiemerged in various outbreaks, e.g. at Vancouver Island (British Colombia, Canada), the Pacific Northwest of the United States and more recently in Mediterranean Europe [28,32–35].
Several molecular typing methods, including fingerprint-ing, randomly amplified polymorphic DNA (RAPD), PCR-restriction fragment length polymorphism (PCR-RFLP), amplified fragment length polymorphism (AFLP), microsatellite typing,
multilocus microsatellite typing (MLMT) and multilocus sequence typing (MLST), have been developed for the investigation of the epidemiology of species belonging to the C. neoformans/C. gattii species complex [30,31,36–41]. MLST is a typing system that has several advantages over other commonly used typing methods, because the technique is highly reproducible and MLST sequence data can be stored in internet databases, such as http://www.mlst. net/ and http://mlst.mycologylab.org. Thus, the data are portable and exchangeable between laboratories. Recently, seven unlinked genetic loci, i.e. CAP59, GPD1, IGS1, LAC1, PLB1, SOD1 and URA5, that represent housekeeping genes, virulence factor coding genes and the intergenic spacer of the ribosomal DNA have been selected for MLST analysis of theC.neoformans/C.gattiicomplex by the International Society of Human and Animal Mycoses (ISHAM) working group on ‘‘Genotyping ofC. neoformansandC. gattii’’ [39].
Previous studies that used MLST and AFLP to investigate the population structure of C. neoformans var. grubii showed a correlation between both methods and grouped the isolates into three genetically different subgroups, named AFLP1/VNI, AFLP1A/VNII/VNB and AFLP1B/VNII [36,39,42,43]. The AFLP1/VNI and AFLP1B/VNII genotypes occur globally and form a monophyletic cluster, whereas the AFLP1A/VNB geno-type occurs in Southern Africa, especially Botswana, but has also been reported from Brazil [36,43]. Previously, recombination has been observed within subpopulations in Botswana, but at the global scale reproduction is mainly clonal [43]. MLST has also been used to trace the putative origin ofCryptococcuspopulations [31,32,34]. Simwami and coworkers (2011) showed a correlation between MLST types among Thai and AfricanC.neoformansvar. grubii isolates that supported the hypothesis of long-distance
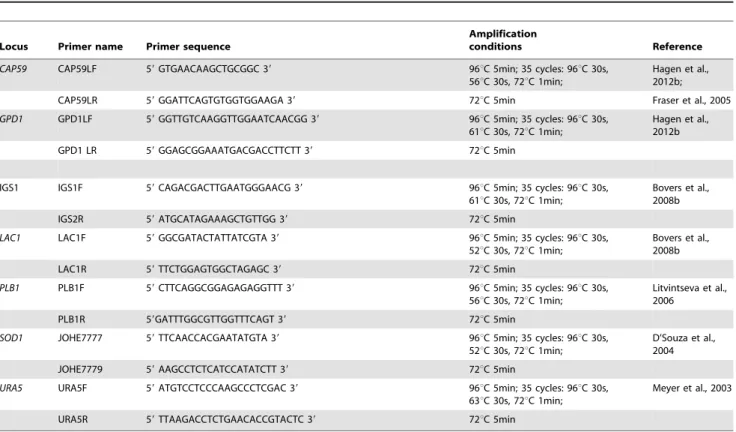
Table 1.Primers used for MLST analysis of AsianC.neoformansvar.grubiiisolates.
Locus Primer name Primer sequence
Amplification
conditions Reference
CAP59 CAP59LF 59GTGAACAAGCTGCGGC 39 96uC 5min; 35 cycles: 96uC 30s, 56uC 30s, 72uC 1min;
Hagen et al., 2012b;
CAP59LR 59GGATTCAGTGTGGTGGAAGA 39 72uC 5min Fraser et al., 2005
GPD1 GPD1LF 59GGTTGTCAAGGTTGGAATCAACGG 39 96uC 5min; 35 cycles: 96uC 30s, 61uC 30s, 72uC 1min;
Hagen et al., 2012b
GPD1 LR 59GGAGCGGAAATGACGACCTTCTT 39 72uC 5min
IGS1 IGS1F 59CAGACGACTTGAATGGGAACG 39 96uC 5min; 35 cycles: 96uC 30s, 61uC 30s, 72uC 1min;
Bovers et al., 2008b
IGS2R 59ATGCATAGAAAGCTGTTGG 39 72uC 5min
LAC1 LAC1F 59GGCGATACTATTATCGTA 39 96uC 5min; 35 cycles: 96uC 30s, 52uC 30s, 72uC 1min;
Bovers et al., 2008b
LAC1R 59TTCTGGAGTGGCTAGAGC 39 72uC 5min
PLB1 PLB1F 59CTTCAGGCGGAGAGAGGTTT 39 96uC 5min; 35 cycles: 96uC 30s, 56uC 30s, 72uC 1min;
Litvintseva et al., 2006
PLB1R 59GATTTGGCGTTGGTTTCAGT 39 72uC 5min
SOD1 JOHE7777 59TTCAACCACGAATATGTA 39 96uC 5min; 35 cycles: 96uC 30s, 52uC 30s, 72uC 1min;
D’Souza et al., 2004
JOHE7779 59AAGCCTCTCATCCATATCTT 39 72uC 5min
URA5 URA5F 59ATGTCCTCCCAAGCCCTCGAC 39 96uC 5min; 35 cycles: 96uC 30s, 63uC 30s, 72uC 1min;
Meyer et al., 2003
URA5R 59TTAAGACCTCTGAACACCGTACTC 39 72uC 5min
dispersal from the African continent to Asia within the last 5,000 years [41].
In the current study, MLST was employed to determine the genetic diversity and epidemiological relationships of a collection of clinical and environmentalC.neoformansvar.grubiiisolates that originated from various geographic locations in Asia, including countries from East, South/Southeast Asia and the Middle East. We assessed the extent of recombination that occurs amongst AsianC.neoformansvar.grubiiisolates. In addition, we determined whether isolates from patients with a different HIV-status could be distinguished using MLST. Finally, we analyzed whether differ-ences in susceptibility to various antifungal drugs correlated with the observed MLST-based genotypic diversity.
Materials and Methods
Isolates and media
Three hundred and eleven isolates ofCryptococcus neoformansvar. grubii, including 244 clinical and 67 environmental isolates, were obtained from the following sources: the Chinese Cryptococcus Reference Centre at the Second Military Medical University, Shanghai, China (nClinical = 86); the Department of Microbiology, Meiji Pharmaceutical University, Tokyo, Japan (nClinical = 28;
nEnvironmental= 10); Prince of Wales Hospital, Hong Kong (nClinical = 14); the Department of Parasitology, Faculty of Medicine, University of Indonesia, Jakarta, Indonesia (nClinical = 40); the Department of Medical Microbiology, Postgraduate Institute of Medical Education and Research, Chandigarh, India (nClinical = 61); the Department of Microbiology, Faculty of Medicine, Health Sciences Centre, Kuwait University, Jabriya, Kuwait (nClinical = 10) and the Mycology Unit, Microbiology Division, Department of Laboratory Medicine and Pathology, Hamad Medical Corporation, Doha, Qatar (nClinical = 5), and the Department of Microbiology, Faculty of Medicine, Chiang Mai University, Chiang Mai, Thailand (nEnvironmental = 57) (Table A and B in Supplementary Tables S1). Furthermore, MLST data obtained from 165 Thai clinical isolates included in a previous study [41] complemented the strain set, resulting in a total of 476 isolates. The MLST profiles were compared to those included in the global MLST dataset (http://mlst.mycologylab.org) and from previous reports [16,44]. Isolate identification was done as described by Panet al., 2012 [8].
Mating- and serotype analysis by PCR
Extraction of genomic DNA was performed as previously described [30]. To determine mating- and serotypes, PCR amplifications were applied as described previously [45,46]. C. neoformans strains 125.91 (CBS 10512; aA; AFLP1/VNI), H99 (CBS 8710;aA; AFLP1/VNI), JEC20 (CBS 10511; aD; AFLP2/ VNIV), and JEC21 (CBS 10513;aD; AFLP2/VNIV) were used as controls.
MLST determination
DNA from each isolate was amplified by PCR in 25ml reaction volumes for each of the seven MLST loci using the primers and protocols described in Table 1. Each amplicon was subsequently sequenced using the BigDye v3.1 Chemistry kit (Applied Biosystems, Foster City, CA) using the same primers as used to obtain the amplicons. Sequencing reaction products were purified with Sephadex G-50 Superfine columns (Amersham Biosciences, Piscataway, NJ) and a MultiScreen HV plate (Millipore, Billerica, MA). An ABI 3700XL DNA analyzer (Applied Biosystems) was used to determine the forward and reverse DNA sequences. Consensus sequences were manually edited using SeqMan v8.0.2 (DNASTAR, Madison, WI) and were subsequently aligned with MEGA v5.05 (www.megasoftware.net). Allele Types (ATs) were assigned to each of the seven loci, resulting in a seven-digit allelic profile for each isolate. The allelic profiles were then defined as Sequence Types (STs) according to the ISHAM MLST consensus scheme for C. neoformans/C. gattii species complex (http://mlst. mycologylab.org). All sequences have been deposited in GenBank under the accession number KC529683 to KC533008 (Table C in Supplementary Tables S1) and novel ATs have been added to http://mlst.mycologylab.org/. AT’s analysed in Simwami et al. (2011) [41] had the indels removed in order to make them compatible for the then-current MLST dataset. However, the current MLST scheme (http://mlst.mycologylab.org) includes indels, and therefore we realigned the entire set of sequences from the latter study in our analyses. This required the reassignment of a number of AT’s from the dataset of Simwami et al. (2011) [41] (Table A in Supplementary Tables S1). For the global comparison we used data from http://mlst.mycologylab.org and recent reports by Cogliati and colleagues (2013) [44] and Mihara and colleagues (2012) [16].
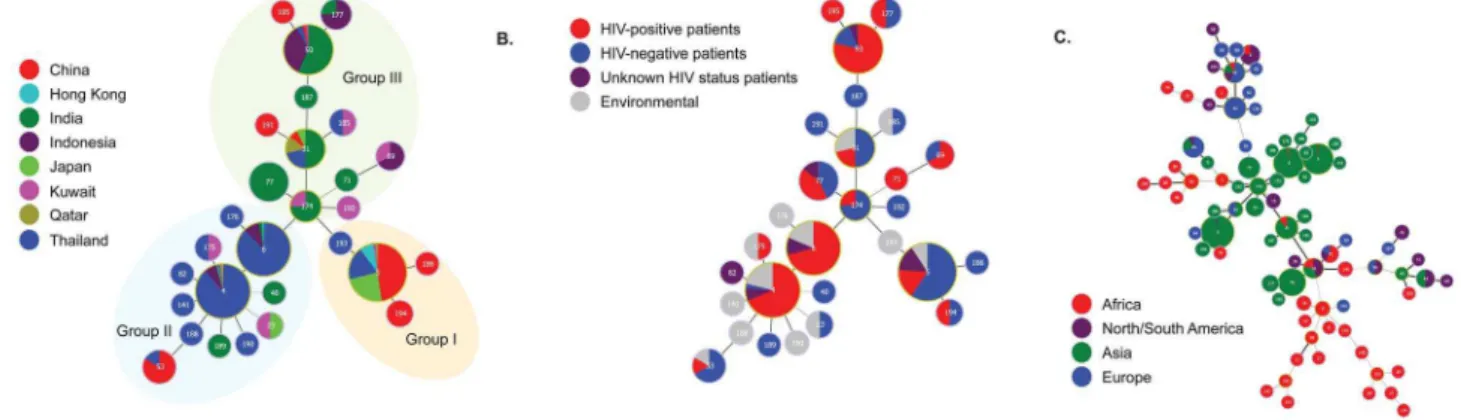
Figure 1. Minimum spanning trees using the goeBURST algorithm showing MLST relationships among Asian C. neoformans var. grubiiisolates.(A) Tree represents 476 C. neoformansvar.grubii isolates from different countries. Each circle represents a unique genotype/ sequence type (STs). The size of the circle corresponds to the number of isolates within that genotype. Different colors correspond to different countries; (B) Same as A, but now showing the genotypes from clinical and environmental sources; (C) Same as A and B, but with the addition of the genotypes of 179C.neoformansvar.grubiiisolates from different continents (data from http://mlst.mycologylab.org and previous reports by Cogliati
Nucleotide diversity
The determination of the extent of DNA polymorphisms, such as haplotype diversity (Hd), nucleotide diversity (p), number of
polymorphic sites (S), average number of nucleotide differences (k)
and Watterson’s estimate of the population scaled mutation rate per sequence (hs), were calculated using DnaSP v5.10 (http:// www.ub.edu/dnasp/) [47]. Tajima’sD, Fu & Li’sD*, Fu & Li’sF* and Fu’sFs, tests for neutrality, were also calculated using DnaSP
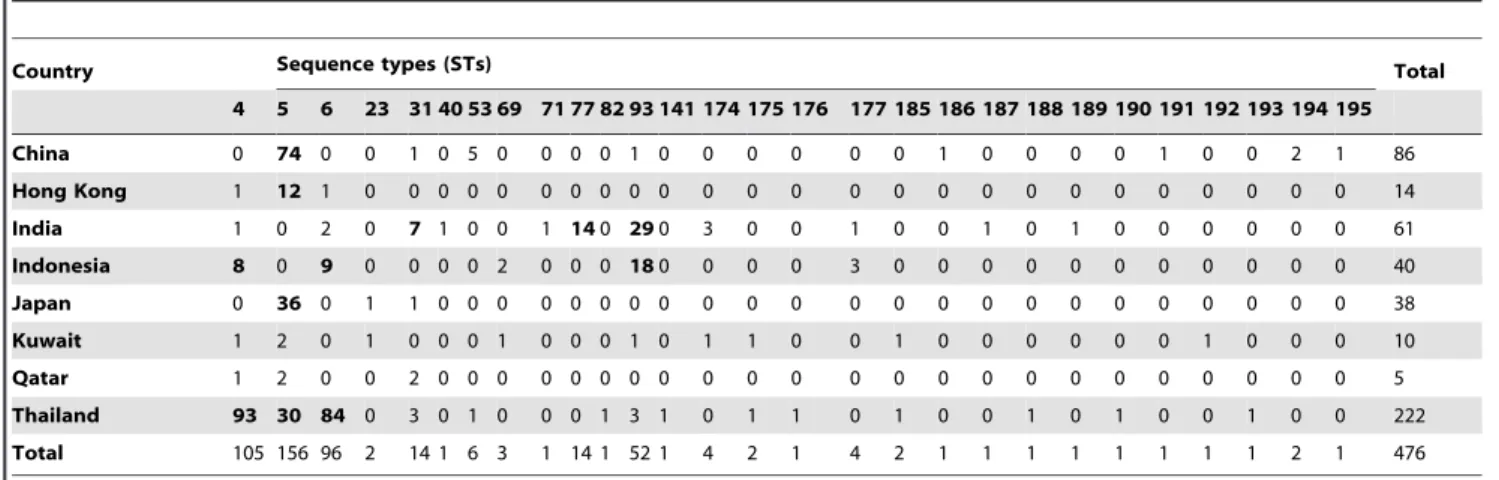
Table 2.Distribution of sequence types (STs) ofC.neoformansvar.grubiiisolates among different countries.
Country Sequence types (STs) Total
4 5 6 23 31 40 53 69 71 77 82 93 141 174 175 176 177 185 186 187 188 189 190 191 192 193 194 195
China 0 74 0 0 1 0 5 0 0 0 0 1 0 0 0 0 0 0 1 0 0 0 0 1 0 0 2 1 86
Hong Kong 1 12 1 0 0 0 0 0 0 0 0 0 0 0 0 0 0 0 0 0 0 0 0 0 0 0 0 0 14
India 1 0 2 0 7 1 0 0 1 140 290 3 0 0 1 0 0 1 0 1 0 0 0 0 0 0 61
Indonesia 8 0 9 0 0 0 0 2 0 0 0 180 0 0 0 3 0 0 0 0 0 0 0 0 0 0 0 40
Japan 0 36 0 1 1 0 0 0 0 0 0 0 0 0 0 0 0 0 0 0 0 0 0 0 0 0 0 0 38
Kuwait 1 2 0 1 0 0 0 1 0 0 0 1 0 1 1 0 0 1 0 0 0 0 0 0 1 0 0 0 10
Qatar 1 2 0 0 2 0 0 0 0 0 0 0 0 0 0 0 0 0 0 0 0 0 0 0 0 0 0 0 5
Thailand 93 30 84 0 3 0 1 0 0 0 1 3 1 0 1 1 0 1 0 0 1 0 1 0 0 1 0 0 222
Total 105 156 96 2 14 1 6 3 1 14 1 52 1 4 2 1 4 2 1 1 1 1 1 1 1 1 2 1 476
The predominant STs in each country are indicated in bold. doi:10.1371/journal.pone.0072222.t002
Figure 2. Unrooted Neighbor-joining phylogenetic analysis of the concatenated MLST sequences found among Asian isolates.
Numbers at each branch indicate bootstrap values.50%, based on 1,000 replicates. Each color rectangle represents the origin of isolates according to geographic origin, and clinical and environmental origin. Number inside each color rectangle indicates number of isolates.
v5.10. Negative values of these neutrality tests suggest evidence for purifying selection or the excess of high-frequency variants, whereas positive values suggest evidence for balancing or overdominant selection or expansion of rare polymorphisms. Genetic differentiation between populations was estimated using Slatkin linearized FST statistics. Estimation of gene flow was
assessed using number of migrants per generation (Nm).
Investigation of population structure
The actual number of populations (K) among AsianC.neoformans var. grubii in our study was estimated using Structure v2.3.4 (http://pritch.bsd.uchicago.edu/structure.html) [48] and Struc-ture Harvester (http://taylor0.biology.ucla.edu/ structureHarvester/) [49]. Twenty-seven simulation runs were conducted for each K from 2 to10 using a burn-in of 104 replications and 104 Markov Chain Monte Carlo (MCMC) replications, respectively. The true K was calculated from the average and standard deviation of eachKusing the ad hoc statistic implemented in Structure Harvester. Graphic depictions of population genetic structure were drawn from the coefficients of the optimalKusing CLUMPP v1.1.2 (http://www.stanford.edu/ group/rosenberglab/clumpp.html) [50] and Distruct v1.1 (http:// www.stanford.edu/group/rosenberglab/distruct.html) [51].
Recombination
Two common statistics for multilocus linkage disequilibrium analysis, the index of association (IA) and rBarD, were estimated
using Multilocus v1.3b (http://www.agapow.net/software/ multilocus/) [52]. These statistics test the null hypothesis of free recombination (i.e. no linkage disequilibrium). The observed values ofIAand rBarD were compared against the expected values
obtained with 1,000 randomized data sets. Using these criteria, p,0.05 indicates that the null hypothesis of free recombination should be rejected and, consequently, indicates the presence of substantial clonal reproduction. In order to do so, the Pairwise Homoplasy Index (PHI) test implemented in SplitsTree v4.0 (http://www.splitstree.org/) [53] and the pairwise linkage dis-equilibrium analysis implemented in DnaSP v5.10 using Fisher’s exact test were used to detect recombination events among populations using separate alignments for all seven MLST loci. We also used the reticulated network analysis using the CASS algorithm [54] to detect recombination among the Asian population using alignments of concatenated sequences for all seven MLST loci. The genome of C. neoformans var. neoformans strain B3501 ( = CBS 6900) was used as an outgroup for the CASS network analysis.
Phylogenetic relationships
The minimum spanning tree that represented the comparison between the original sources of C. neoformans isolates and their allelic profiles was generated by Phyloviz v1.0 using the goeBURST algorithm (http://goeburst.phyloviz.net/) [55].
Phylogenetic analyses were performed using the Neighbor-joining method with 1,000 bootstrap replicates implemented in MEGA v5.10. The substitution model of this analysis was the uncorrected genetic distances (p-distance) model.
Antifungal susceptibility testing
The susceptibility pattern of seven antifungal drugs, namely amphotericin B (AMB; Bristol Myers Squibb, Woerden, The Netherlands), 5-flucytosine (5FC; Valeant Pharmaceuticals, Zoe-termeer, The Netherlands), fluconazole (FLU; Pfizer Central Research, Sandwich, Kent, United Kingdom), itraconazole (ITR; Janssen Cilag, Tilburg, The Netherlands), posaconazole (POS; Schering-Plough Corp., Kenilworth, NJ, USA), voriconazole (VOR; Pfizer Central Research) and isavuconazole (ISA; Basilea Pharmaceutica, Basel, Switzerland) was tested for 14 clinical C. neoformans var. grubii isolates from Hong Kong as described previously [8]. All other data were taken from the Pan et al., 2012 study [8]. Recently published epidemiological cutoff values (ECVs) forC.neoformansvar.grubiiof AMB, 5FC, FLU, ITR, VOR and POS were implemented in this study. The ECVs for C. neoformansvar.grubiiof 5FC and FLU is 8mg/ml, 0.25mg/ml for ITR, VOR and POS, and 1mg/ml for amphotericin B, respectively [56,57].
Statistical analyses
Analysis of molecular variance (AMOVA), implemented in Arlequin v3.5.1.3, was used to analyze the hierarchical structuring of genetic variation among AsianC.neoformanspopulations using the concatenated MLST sequences. Significance was assessed by computing distance pairwise matrices from the MLST sequences using 10,000 permutations [58].
Correlations between sequence types (STs) and origin of C. neoformansisolates, including geographical origin and HIV-status of patients, and antifungal drug susceptibility profiles (Pan et al., 2012) [8] were determined using Chi-square or Fisher’s exact tests and binary logistic regression (p,0.05). All statistical tests were calculated using GraphPad Prism v5 for Windows (http://www. graphpad.com/prism/prism.htm) (GraphPad Software, San Diego CA) and XLSTAT v2013 (http://www.xlstat.com/) (Addinsoft, NY).
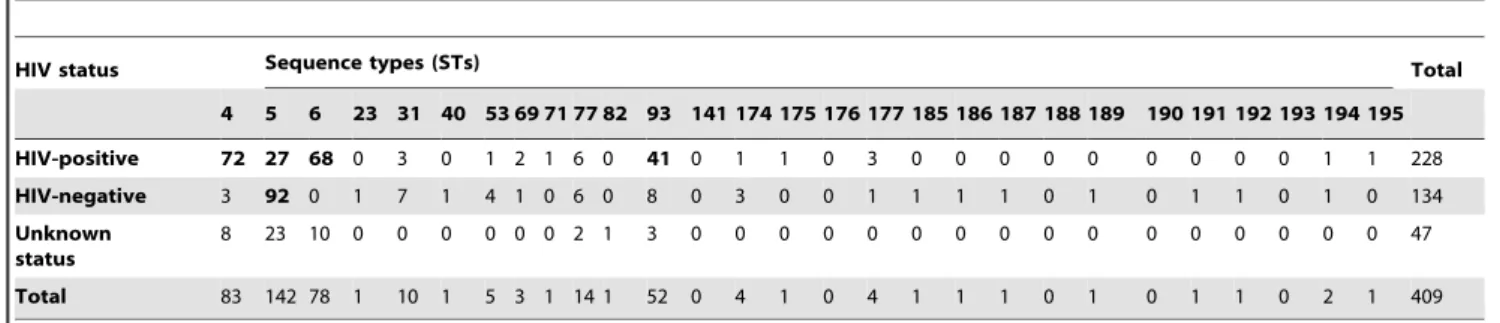
Table 3.Distribution of sequence types (STs) ofC.neoformansvar.grubiiisolates according to HIV status of the patients.
HIV status Sequence types (STs) Total
4 5 6 23 31 40 53 69 71 77 82 93 141 174 175 176 177 185 186 187 188 189 190 191 192 193 194 195
HIV-positive 72 27 68 0 3 0 1 2 1 6 0 41 0 1 1 0 3 0 0 0 0 0 0 0 0 0 1 1 228
HIV-negative 3 92 0 1 7 1 4 1 0 6 0 8 0 3 0 0 1 1 1 1 0 1 0 1 1 0 1 0 134
Unknown status
8 23 10 0 0 0 0 0 0 2 1 3 0 0 0 0 0 0 0 0 0 0 0 0 0 0 0 0 47
Total 83 142 78 1 10 1 5 3 1 14 1 52 0 4 1 0 4 1 1 1 0 1 0 1 1 0 2 1 409
Results
MLST analysis
The 476 C. neoformans var. grubii isolates in our dataset were obtained from 228 HIV-positive patients, 134 HIV-negative patients, and 47 from individuals with unknown HIV status (Table A in Supplementary Tables S1), as well as 67 isolates from avian droppings from Chiang Mai, Thailand and Tokyo, Japan (Table B in Supplementary Tables S1). All isolates possessed mating-typeaand serotype A (i.e. wereaA). The genetic diversity of the 476C. neoformansvar.grubii isolates as assessed by MLST revealed 28 sequence types (STs) (Table A, B and D in Supplementary Tables S1), including 4 predominant STs, namely ST4 (n= 105; 22.1%), ST5 (n= 156; 32.8%), ST6 (n= 96; 20.2%), and ST93 (n= 52; 10.9%). ST31 and ST77 contained each 14 (2.9%) isolates. The remaining STs were confined to few isolates. Most isolates from the Chinese, Hong Kong, and Japanese populations belonged to ST5. Fourteen percent of the Thai isolates (n= 30) belonged to this ST, which was here significantly rarer than in China (Chi-squarep,0.0001). ST4 and ST6 were found to be the major MLST types in Thailand, while ST93 was dominant in India and Indonesia (Chi-squarep,0.0001). Fifteen isolates from the Middle East were distributed among 10 STs (Table 2). Most STs from this area consisted of a single isolate, except ST5 and ST31. Most isolates of these latter two STs were obtained from immigrant workers that originated from India, Indonesia, Philippines, and Sudan (Table A in Supplementary Tables S1).
Among the 409 clinical isolates, 24 STs were identified and 16 of them contained clinical isolates only (Tables 3–4). STs 4–6 and 93 were the predominant STs and accounted for 83 (20.3%), 142 (34.7%), 78 (19.1%) and 52 (12.7%) isolates, respectively (Chi-squarep,0.0001). The remaining STs consisted of few isolates, except ST31 and ST77 that consisted of 10 (2.4%) and 14 (3.4%) isolates, respectively (Table 3). The majority of isolates from HIV-negative patients belonged to ST5 (n= 92; 68.7%), while the majority of isolates from HIV-positive people belonged to STs 4, 5, 6 and ST93 that accounted for 72 (31.6%), 27 (11.8%), 68 (29.8%) and 41 (18%) isolates, respectively (Table 3). We investigated how genetic variation was structured across the Asian clinical isolate dataset (i.e. isolates from HIV-positive, -negative and unknown HIV-status patients) using AMOVA. This analysis showed that allelic variation within populations (88.38%) was higher than that observed among populations (11.62%) (p,0.0001) (Table 4). When we compared clinical isolates from HIV-positive patients categorized into three regions, East Asia, Middle East and South/Southeast Asia, the variance within populations was approximately 92% (p= 0.065460.0025), indi-cating that significant variation in MLST genotypes occurred among individuals within each regional population group. In contrast, MLST genotypic variation within populations of isolates from HIV-negative patients showed less genotypic differences (36.80%) than the variance observed among populations (63.20%) (p,0.0001). Chi-squared tests showed a relationship between HIV status and STs (p,0.0001; Cramer’s V = 0.474) (Sheet S1). A binary logistic regression test showed that ST5 is associated with HIV status (p,0.0001) and the standardized (adjusted) Pearson residuals showed that ST5 correlated to isolates obtained from Figure 3. Unrooted Neighbor-joining phylogenetic analysis of the concatenated sequences of each sequence type (ST) found among the global isolates. Numbers at each branch indicate bootstrap values.50%, based on 1,000 replicates. Each color rectangle represents the geographic origin of isolates.
HIV-negative patients (Sheet S1). Of the 92 ST5 isolates, almost all were sampled from East Asia, including China (n= 70; 76.1%) and Japan (n= 20; 21.7%).
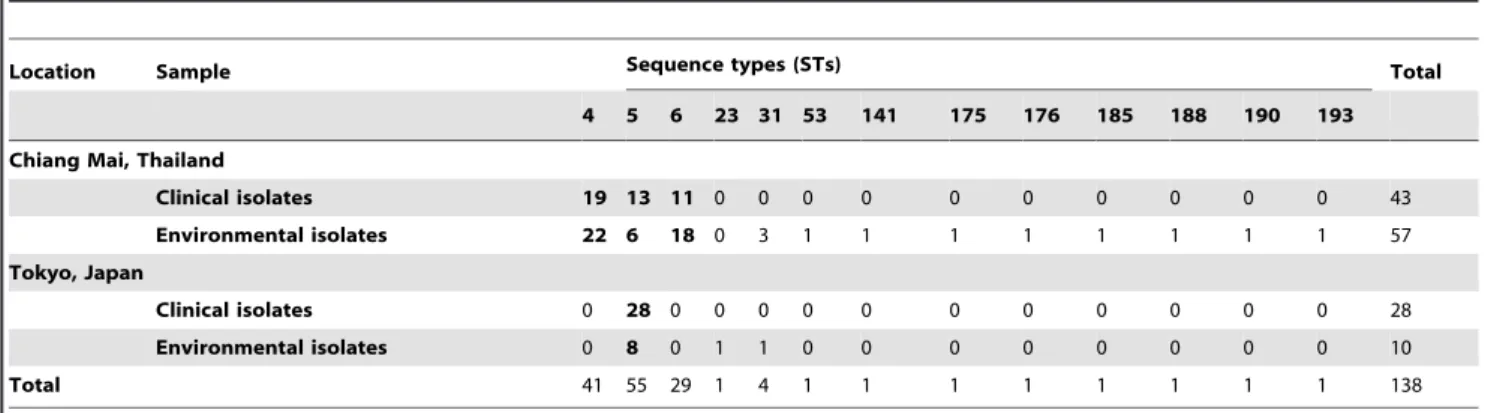
Only clinical and environmental isolates from Chiang Mai, Thailand and Tokyo, Japan could be compared as no environ-mental isolates could be studied from the other regions. Sixty-seven environmental isolates from Chiang Mai, Thailand, and Tokyo, Japan, belonged to 12 STs from which five STs (i.e. ST141, ST176, ST188, ST190 and ST193) contained environ-mental isolates only. STs 4, 5 and 6 were the predominant ST types found among the environmental isolates (Chi-square p,0.0001). The majority of environmental isolates from Chiang Mai, Thailand, belonged to ST4 (n= 22; 38.6%) and 6 (n= 18; 31.6%) (Chi-square p= 0.0042), while almost all Japanese envi-ronmental isolates belonged to ST5 (n= 8; 80%) (Fisher’s exact test p= 0.064) (Table 5).
Association between sequence types and geographic origin of Asian C. neoformans isolates
In order to determine the distribution of STs in different geographical locations, minimum spanning trees and phylogenetic analyses were undertaken based on allelic profiles using the goeBURST algorithm and analysis of concatenated sequences with the Neighbor-joining algorithm, respectively (Figure 1 and 2). Three linages were observed in the minimum spanning tree. Group 1 contained mostly isolates of STs 5, 186, 193 and 194 that originated from China, Hong Kong, and Japan, and also contained 30 out of 222 (13.6%) isolates from Thailand. Group 2 contained mostly isolates from Thailand (n= 184; 82.9%). The predominant STs in this group were ST4 and 6. Group 3 comprised most of the Indian and Indonesian isolates that belonged to STs 31, 77 and 93. (Figure 1A).
Phylogenetic analysis of the Asian isolates also showed three clusters. Cluster I/VNI contained three major STs (ST4, 5 and 6) that contained C. neoformans isolates from China, Hong Kong, Japan, and Thailand. Most Indian and Indonesian isolates occurred in cluster II/VNI, whereas cluster III/VNII contained one ST (ST40) with only isolates from India (Figure 2). The Middle East isolates showed a more scattered distribution (Figure 1A and 2). Two isolates of ST31 came from Qatar, but they were isolated from Indian and Sudanese immigrant workers suggesting that their geographical origins lie elsewhere. Among the
clinical isolates, the minimum spanning tree and Maximum Likelihood tree showed an association of the predominant STs, including STs 4, 6 and 93, withC.neoformansisolates from HIV-positive patients, while ST5, one of the predominant STs, contributed mainly to isolates from HIV-negative patients (Figure 1B and 2; Figure A in Supplementary Figures S1).
The globalC.neoformansvar.grubiiMLST dataset that contained 179 isolates originating from Africa (n= 45), North/South America (n= 31), Asia (n= 55) and Europe (n= 48) was compared using the goeBURST algorithm with the isolates from Asia. Most AsianC.neoformansisolates clustered together in one group, but a few Asian isolates showed a scattered distribution. Two clusters of African isolates and one cluster of European isolates were observed. Some of isolates from those regions showed a scattered distribution as did the North/South American isolates (Figure 1C). Phylogenetic analysis using Neighbor-joining showed three clades among the globalC. neoformansvar.grubii isolates. Clade I/VNII contained isolates from Africa, North/South America, Asia and Europe, clade II/VNB contained 17 STs from African isolates and one ST comprising European isolates, and almost all Asian STs occurred in clade I/VNI that also contained isolates from other global regions (nAfrica = 27, nNorth/South America = 23, nEurope = 45)
(Figure 3).
Nucleotide diversity
Nucleotide sequences of all seven loci studied (CAP59, GPD1, IGS1, LAC1, SOD1, PLB1 and URA5) had between 6 and 15 polymorphic sites (Table 6). Locus IGS1 had the highest nucleotide diversity (p) of 0.0045, followed byLAC1(p= 0.0018) and GPD1 (p= 0.0014). The average number of nucleotide differences per sequence, i.e. the k-value, of most loci ranged from 0.046 to 0.867, except for locus IGS1 that had a higherk value of 3.274. Locus LAC1 showed the highest mutation rate (hs= 2.226), while the other loci had lowhsvalues ranging from 0.890 to 2.077. The number of haplotypes (alleles) at each locus ranged from 3 forCAP59and SOD1 to 7 forLAC1. Haplotype diversity ranged from 0.013 for SOD1 to 0.658 for LAC1. The neutrality tests, including Tajima’sD, Fu & LiD*, Fu & Li’sF* and Fu’sFsshowed significant evidence of purifying selection for
all loci, except IGS1 that showed some evidence of balancing selection (Table 6).
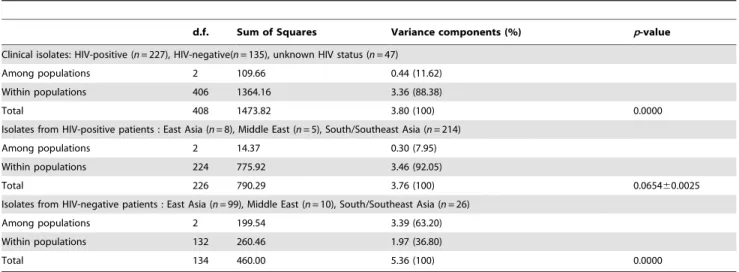
Table 4.Analysis of Molecular Variance (AMOVA) of AsianC.neoformansaccording to HIV status and geographical origin.
d.f. Sum of Squares Variance components (%) p-value
Clinical isolates: HIV-positive (n= 227), HIV-negative(n= 135), unknown HIV status (n= 47)
Among populations 2 109.66 0.44 (11.62)
Within populations 406 1364.16 3.36 (88.38)
Total 408 1473.82 3.80 (100) 0.0000
Isolates from HIV-positive patients : East Asia (n= 8), Middle East (n= 5), South/Southeast Asia (n= 214)
Among populations 2 14.37 0.30 (7.95)
Within populations 224 775.92 3.46 (92.05)
Total 226 790.29 3.76 (100) 0.065460.0025
Isolates from HIV-negative patients : East Asia (n= 99), Middle East (n= 10), South/Southeast Asia (n= 26)
Among populations 2 199.54 3.39 (63.20)
Within populations 132 260.46 1.97 (36.80)
Total 134 460.00 5.36 (100) 0.0000
The number of polymorphisms of the concatenated sequences of C. neoformans var.grubii isolates obtained from the East Asian region, including China, Hong Kong and Japan, were lower than those from South/Southeast Asian isolates (i.e. India, Indonesia and Thailand), and those from the Middle East (i.e. Kuwait and Qatar) (Figure 4A and Table E in Supplementary Tables S1). The highest nucleotide diversity (p= 0.002), the highest average number of nucleotide differences per sequence (k= 7.962), and the highest haplotype diversity (Hd= 0.924) were found in C.
neoformans isolates from Kuwait and Qatar. C. neoformansisolates from South/Southeast Asia had 75 polymorphic site (S) and 21 different haplotypes (h), and a high mutation rate per sequence (hs= 11.816). Within the South/Southeast region, haplotype diversity (Hd) of each population was almost similar, while other
nucleotide polymorphism estimation values of each population, such as number of polymorphic sites (S), nucleotide diversity (p), mutation rate (h) and the average number of nucleotide differences per sequence (k), were different (Figure 4A, Table E in Supplementary Tables S1). A significant signal of purifying selection was observed in twoC. neoformanspopulations, namely the one from East Asia (i.e. the Japanese population) and the South/Southeast Asian one (i.e. the Indian population), whereas evidence of a balancing selection or expansion of rare polymor-phisms was found in the Indonesian population (Table E in Supplementary Tables S1).
Compared to the global MLST dataset, the Asian population had lower values of nucleotide diversity (p) and haplotype diversity (Hd) of 0.0016 and 0.780, respectively, than those of the African
(p= 0.0062;Hd= 0.988), the North/South American (p= 0.0067;
Hd= 0.927) and European populations (p= 0.0025; Hd= 0.841)
(Figure 4B, Table F in Supplementary Tables S1). The Asian population had lower numbers of polymorphic sites (S) and number of haplotypes (h) of 81 and 32, respectively, than those from the African populations (S= 124; h= 34), but they were higher than those from the North/South American (S= 79;h= 16) and European populations (S= 78;h= 17) (Figure 4B and Table F in Supplementary Tables S1). Neutrality tests indicated that the variation of all populations was neutral and population sizes did not change. However, the North/South American population showed evidence for a population overdominant selection,
whereas the remaining populations showed purifying selection or population expansion.
Population structure of Asian C. neoformans var. grubii
Genetic differences and the level of gene flow between each of two populations from the three Asian regions studied were estimated using two statistics, FST and Nm, using concatenated
MLST sequences (4,022bp). Genetic differences of the East Asian versus the South/Southeast Asian (FST = 0.351), and the East
Asian and Middle East (FST = 0.233) populations were higher than
those between the South/Southeast Asian and Middle East populations (FST = 0.019) (Figure 4A, Table G in Supplementary
Tables S1). High levels of gene flow, indicated by anNmvalue of
.1, were observed between the South/Southeast Asian popula-tion when compared to the Middle East populapopula-tion (Nm= 25.76), and, secondly, between the East Asian population and the Middle East population (Nm= 1.64). However, theNmvalue between the South/Southeast Asian and the Middle East populations was much higher than that between the East Asian and the Middle East populations. When the MLST data of the Asian isolates were compared to those from the African, North/South American, and European continents,FST andNmestimates were between 0.193
and 0.222, and between 1.76 and 2.09, respectively (Figure 4B, Table H in Supplementary Tables S1), indicating the presence of slight genetic differences, but the occurrence of significant gene flow between the Asian population with those from Africa, North/ South America, and Europe.
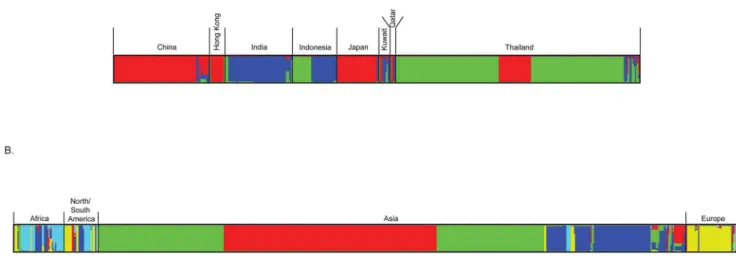
Clusters of Asian C. neoformans var. grubii populations were estimated using different numbers of populations that ranged from K= 2 toK= 10 using Structure. The Evanno method implemented in the Structure Harvester showed the highest deltaK, an ad hoc statistic, was produced at K= 3 (Figure BA in Supplementary Figures S1). This implicates thatK= 3 seems a good estimate for the actual number of populations included in this study, thus suggesting that three real genetic population clusters occur among the Asian C. neoformans var. grubii isolates that do not fully corroborate the geographically identified populations. The distri-bution of these three populations differed between the countries (Figure 5A). Almost all cryptococcal isolates from China, Hong Kong and Japan, as well as some isolates from Thailand, belonged to population I. The Thai and part of Indonesian isolates formed Figure 4. Diagram showing DNA polymorphisms ofC. neoformansvar.grubiifrom different Asian regions.(A) DNA polymorphism, genetic differentiation and gene flow; (B) same as A, but comparing African, American, Asian and European populations.
doi:10.1371/journal.pone.0072222.g004
Table 5.Distribution of sequence types (STs) ofC.neoformansisolates from clinical and environmental samples from Thailand and Japan.
Location Sample Sequence types (STs) Total
4 5 6 23 31 53 141 175 176 185 188 190 193
Chiang Mai, Thailand
Clinical isolates 19 13 11 0 0 0 0 0 0 0 0 0 0 43
Environmental isolates 22 6 18 0 3 1 1 1 1 1 1 1 1 57
Tokyo, Japan
Clinical isolates 0 28 0 0 0 0 0 0 0 0 0 0 0 28
Environmental isolates 0 8 0 1 1 0 0 0 0 0 0 0 0 10
Total 41 55 29 1 4 1 1 1 1 1 1 1 1 138
population II. Indian isolates, together with part of the Indonesian ones, formed the population III, whereas isolates from Kuwait and Qatar belonged to diverse populations containing genotypes from populations I-III (Figure 5A). Population structure analysis of the global C. neoformans var. grubii isolates showed five genetic populations (K= 5) (Figure BB in Supplementary Figures S1). The population structure of the Asian isolates was the same as described above, but two other major populations occurred, namely an African and North/South American population, and an European one. The African and American populations were genetically diverse. Some isolates contained haplotypes occurring among isolates from Asia and Europe and a few of the European isolates shared haplotypes that occurred in isolates from other continents (Figure 5B). However, whether these isolates represent acquisitions from the local environment, or are due to the patient traveling with anin situlatent infection is not known and requires further sampling of environmental isolates.
Recombination
The index of association (IA) and rBarD values were estimated
from the allelic data set to determine the presence of clonality and recombination among AsianC.neoformans var.grubii populations. For all isolates in the entire Asian population and in those from each region (i.e. East Asia, the Middle East and South/Southeast Asia) both IA and rBarD values strongly rejected the null
hypothesis of free recombination (Table 7). However, two recombination events were observed using the pairwise linkage disequilibrium routine implemented in DnaSp (Table I in Supplementary Tables S1). One event occurred among locus GPD1and the remaining occurred among locus IGS1. Results of the Pairwise Homoplasy Index (PHI) test (Table J in Supplemen-tary Tables S1) showed that no recombination occurred within each locus across all Asian populations, however two recombina-tion events were observed among concatenated sequences of isolates from East and South/Southeast Asia. CASS analysis Figure 5. Population structure analysis among AsianC. neoformansvar.grubiiisolates obtained with the program STRUCTURE.(A) Comparing isolates from different countries and (B) globalC.neoformansvar.grubiiisolates (data from http://mlst.mycologylab.org). The population groups are indicated by different colors. Each bar represents the individual isolates. Mixed color bar represents to share haplotypes in the individual isolate.
doi:10.1371/journal.pone.0072222.g005
Table 6.DNA polymorphisms in each MLST locus and concatenated sequences of AsianC.neoformansvar.grubiiisolates.
Locus Length S c hs k h Hd D FD FF Fs
CAP59 576 6 0.0001 0.891 0.046 3 0.029 21.737* 24.598** 24.319** 23.238
GPD1 544 11 0.0014 1.633 0.753 6 0.597 21.173 23.525** 23.190** 20.153
IGS1 725 14 0.0045 2.078 3.274 5 0.327 1.326 0.058 0.669 10.501
LAC1 471 15 0.0018 2.226 0.867 7 0.658 21.427 26.636** 25.561** 20.437
PLB1 533 10 0.0005 1.484 0.281 5 0.234 21.719 23.840** 23.686** 22.192
SOD1 536 11 0.0001 1.633 0.051 3 0.013 22.110** 26.755** 26.051** 23.066
URA5 637 11 0.0009 1.633 0.542 5 0.504 21.455 25.948** 25.143** 20.319
Concatenated 4022 78 0.0015 11.577 5.816 28 0.792 21.430 29.170** 26.446** 20.520
S: number of polymorphic sites. p: nucleotide diversity. hs: Watterson’shper sequence.
k: average number of nucleotide differences per sequence. h: number of haplotypes.
Hd: haplotype diversity.
(Figure C in Supplementary Figures S1) showed that no recom-bination occurred among concatenated sequences of Asian isolates. When allelic data that included the global MLST dataset were included, rBarD showed that the overall population genetic structure was in overall significant linkage disequilibrium. The PHI test did not detect recombination events occurring within each locus, but could detect the presence of recombination events among concatenated sequence of the global MLST dataset (Table J in Supplementary Tables S1).
In vitroantifungal drug susceptibility values
The MIC values of 14 C. neoformans var. grubii isolates from Hong Kong were determined for seven antifungal drugs, namely AMB, 5FC, FLU, ITR, VOR, POS and ISA (Table 8) and all were susceptible to all antifungal drugs tested. Due to the recent introduction of epidemiological cutoff values, the overall results slightly differ from those presented previously by Pan and colleagues (2012). In this study, 21 clinical isolates (4.4%) from Indonesia (n= 13), Thailand (n= 5), India (n= 2) and China (n= 1) showed high MIC values $16mg/ml of 5FC. Most of isolates with high 5FC MICs occurred in ST4 (n= 3), ST5 (n= 2), ST77 (n= 2) and ST93 (n= 14) (Table A in Supplementary Tables S1). Eight fluconazole (FLU)-resistant isolates (1.7%) occurred in India (n= 1), Indonesia (n= 5), and Thailand (n= 2) and belonged to ST5 (n= 1), ST6 (n= 1), ST93 (n= 5) and ST77 (n= 1) (Table A in Supplementary Tables S1). All five 5FC and FLU resistant isolates from Indonesia [8] belonged to ST93. One isolate from Thailand (ST6) showed high MICs for FLU ($16mg/ml), but also to VOR ($0.5mg/ml) (Table A in Supplementary Tables S1).
Discussion
Previous studies on the genetic structure ofC.neoformansvar.grubii from Thailand using MLST data showed limited genetic variation [41] with the majority of isolates belonging to STs 4, 5, and 6 (designated as ST44, 45 and 46, respectively, in the original paper by Simwamiet al., 2011, Table A in Supplementary Tables S1). Two of these predominant STs (i.e. ST4 and ST6) differ only in four nucleotides at a single locus [41]. In the current study, we increased the size of the Asian MLST dataset to include nearly 500 C. neoformansvar.grubiiisolates originating from three broadly-defined regions, namely East Asia (China, Hong Kong and Japan), South/ Southeast Asia (India, Indonesia and Thailand), and the Middle East (Kuwait and Qatar). We found that 99.8% (n= 475) of these isolates belonged to lineage VNI, 0.2% (n= 1) were VNII and 0% were VNB. TheC. neoformansvar.grubiipopulation from the East Asian region showed less genotypic variation than those from South/ Southeast Asian and the Middle East regions, and most isolates
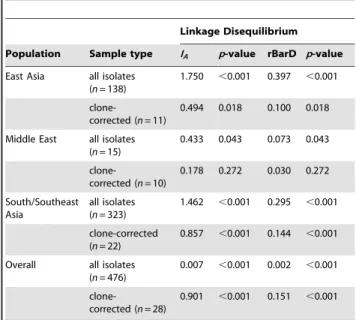
Table 7.Linkage disequilibrium analysis amongst AsianC.
neoformansvar.grubiipopulations.
Linkage Disequilibrium
Population Sample type IA p-value rBarD p-value
East Asia all isolates (n= 138)
1.750 ,0.001 0.397 ,0.001
clone-corrected (n= 11)
0.494 0.018 0.100 0.018
Middle East all isolates (n= 15)
0.433 0.043 0.073 0.043
clone-corrected (n= 10)
0.178 0.272 0.030 0.272
South/Southeast Asia
all isolates (n= 323)
1.462 ,0.001 0.295 ,0.001
clone-corrected (n= 22)
0.857 ,0.001 0.144 ,0.001
Overall all isolates (n= 476)
0.007 ,0.001 0.002 ,0.001
clone-corrected (n= 28)
0.901 ,0.001 0.151 ,0.001
IA: Index of Association.
rBarD: a modified statistics for multilocus linkage disequilibrium analysis. doi:10.1371/journal.pone.0072222.t007
Table 8.The MIC range, MIC50, MIC90, and geometric mean for 14 Hong Kong and all 476C.neoformansisolates for seven antifungals.
Isolates Antifungal agent MIC
Range MIC50 Geometric Mean MIC90
Clinical isolates from Hong Kong China (n= 14) Amphotericine B 0.5–1 0.5 0.416 1
5-Flucytosine 1–8 4 2.895 8
Fluconazole 0.25–4 2 1.662 4
Itraconazole 0.031–0.25 0.125 0.086 0.25
Voriconazole ,0.016–0.125 0.063 0.060 0.125
Posaconazole 0.031–0.125 0.125 0.083 0.125
Isavuconazole ,0.016–0.063 0.031 0.028 0.063 AllC.neoformansisolates (n= 476) Amphotericine B 0.063–1 0.25 0.251 0.5
including those from Pan et al., 2012 [8] 5-Flucytosine ,0.063–.64 4 3.483 8
Fluconazole 0.125–32 2 2.294 4
Itraconazole ,0.016–0.5 0.063 0.063 0.25
Voriconazole ,0.016–0.5 0.063 0.049 0.125
Posaconazole ,0.016–0.25 0.063 0.061 0.125
Isavuconazole ,0.016–0.125 0.031 0.027 0.063
belonged to ST5. This latter genotype was previously found to be the main ST in China, Japan and South Korea [13,14,16] and was reported previously as the MLST M5 genotype [13,14] (Note that this ST was labelled as ST46 in Simwamiet al., 2011 [41] [59]). Our data show that ST5 is the major MLST genotype among C. neoformansvar.grubiiisolates in East Asia. At the global level, and in agreement with previous findings [41], the AsianC.neoformansvar. grubiipopulation was found to be less diverse than the African, the North/South American, and the European populations. The population genetic structure of the Asian population was found to be different from the African, and the North/South American and European populations, and contained very few isolates that shared haplotypes occurring in these other populations. On the other hand, the African, North/South American, and European populations also contained some isolates that contained haplotypes occurring among Asian isolates. These findings are in agreement with previous investigations that showed a high genetic diversity of the African population, especially genotype VNB, and less genetic diversity of the Asian population. Note that the VNB lineage also contains also Brazilian isolates [36,40,41,59,60], thus additional sampling at the global scale may show a broader occurrence of this genotype.
In the current study, no evidence of recombination was detected in the entire Asian region, nor in the smaller regions, or at the global scale using the CASS -, Multilocus (rBarD) -, and PHI (in case of separated loci) analyses. These results suggest that the entire AsianC.neoformansvar.grubiipopulation is largely clonal as was previously shown for the Thai population only [41]. However, the pairwise linkage disequilibrium analysis showed a recombina-tion event among sequences ofGPD1and IGS1 loci and the PHI test also detected recombination events among concatenated sequences in the East and South/Southeast Asia populations. This may be due to non-meiotic reproduction as previously reported [36,41,43] amongst isolates that are of the samea-mating type. However, despite this limited recombination, clonal propagation of genotypes predominated leading to a widespread occurrence and overrepresentation of clonal genotypes as has also been seen in several other pathogens, such asNeisseria meningitides,Mycobacterium tuberculosis,Fusarium oxysporum, andLeishmania tropica[61].
Our analyses revealed a significant association between predom-inant sequence types (STs) and their geographical origin in Asia that was not encountered before. These local geographic differences could result from different founder effects and/or regional factors, and may be due to environmental and climate differences [6,8,62,63]. Sequence type ST5 was the predominant MLST genotype found in East Asia and the North of Thailand. Due to the association ofC.neoformanswith birds, dispersal may have occurred via the East Asian-Australian flyway [8,64], and may contribute to the broader distribution of these genotypes. As most bird migrations generally happen twice a year depending on weather conditions, this may also contribute to the observed limited dispersal and low gene flow estimates between East Asia and Northern Thailand. Thus, it seems that AsianC.neoformansisolates efficiently reproduce clonally, and that rare recombination events may result in an increased genetic variation at some locales, e.g. due to same-sex mating or rare MATax MATa crossings [65].
A scattered MLST distribution of the Middle East population was observed, similar to previous findings using microsatellite analysis [8]. Owing to a low number of isolates (n= 15) with ten haplotypes, the Middle East C. neoformans var. grubii population showed the highest haplotype diversity in our dataset. Seven out of these 15C. neoformansvar.grubiiisolates were obtained from immigrant workers, mainly originating from South/Southeast Asia, who may have acquired the yeast in their home countries and, subsequently, carried the pathogen when moving to the Middle East region.
Cryptococcal species are known to have a high prevalence of subclinical infection due to infection in childhood [66]. Immigrants and tourists in Europe showed the same phenomenon of being infected by strains that were obtained from their home-country [31,46,67]. The observed high level of gene flow between the Middle East and the South/Southeast Asian populations supports this human migration hypothesis. Minimum spanning tree analysis showed that most isolates from India and Indonesia belonged to the same STs (i.e., ST77 and ST93) and a high level of gene flow was observed between these two populations. This observation, unfortunately, is not easy to explain and requires more sampling especially from the environment in these regions.
HIV-status, STs and geographic origins were found to be confounded. However, a significant correlation occurred between the predominant ST5 and HIV-negative patients in Asia. Thus, our study reinforced that genetic differences occur between C. neoformansvar.grubiiisolates from HIV-positive and HIV-negative patients in Asia [8,17,68,69]. Therefore, this finding may explain the observed correlation of MLST genotypes and HIV status in our study. To unravel the effect of geographically determined genetic variation in the pathogen and its link to HIV status, extensive sampling of environmental isolates is needed across the region in order to decouple the HIV-status of individuals from the geographical origin of the isolates. Next to possible genetically determined differences amongst Cryptococcus isolates, human factors, such as anti-interferon-c and anti-granulocyte-macro-phage colony-stimulating factor autoantibodies that have been observed in Taiwanese and Thai patients to be associated with adult-onset immunodeficiency without HIV-infection [70], may contribute to the observed specific pathogen-host correlations.
Recently, epidemiological cutoff values (ECVs) have been defined for the major antifungals againstC.neoformansandC.gattii [56,57]. When we used those values, the interpretation of the overall susceptibility results of all isolates, including those presented by Panet al. [8], differed slightly from the interpretation given by these last authors. Twenty-four clinical isolates mainly from Indonesia and Thailand showed high MIC values of 5FC, FLU and VOR. As 5FC is not used in those two countries, resistance to this compound is unlikely to be induced by patient treatment and the origin of this resistance needs further studies.
Conclusion
MLST typing showed significant genotypic variation betweenC. neoformansvar.grubii populations originating from different Asian regions. Each country had an unique distribution of STs, especially of the predominant STs. Overall, the Asian population showed limited genetic diversity and reproduction is mainly clonal when compared with data from the globalC.neoformansvar.grubii MLST dataset. A correlation between STs and HIV-negative status, and resistance traits was observed. A largely clonal reproduction strategy helps to maintain these regional differences that are clinically relevant due to their association with the HIV-status of the patients that also differs between the regions studied.
Supporting Information
Sheet S1 Chi-square test of Asian C. neoformans
according to sequence types (STs) and HIV status. (XLS)
Supplementary Figures S1
(DOC)
Supplementary Tables S1
Author Contributions
Conceived and designed the experiments: TB KK FH JFM. Performed the experiments: KK FH WP SS MF WM LT JFM CHWK TB. Analyzed the data: KK FH WP SS MF WM LT LJJVI JFM CHWK TB. Contributed
reagents/materials/analysis tools: KK FH WP SS MF RW A. Chakrabarti A. Chowdhary RI SJT ZK MI DI RS PS WL KC VV WM LT LJJVI JFM CHWK TB. Wrote the paper: KK FH WP MF WM JFM TB.
References
1. Bovers M, Hagen F, Boekhout T (2008) Diversity of theCryptococcus neoformans-Cryptococcus gattiispecies complex. Rev Iberoam Micol 25: S4–12.
2. Heitman J (2011) Microbial Pathogens in the Fungal Kingdom. Fungal Biol Rev 25: 48–60.
3. Park BJ, Wannemuehler KA, Marston BJ, Govender N, Pappas PG, et al. (2009) Estimation of the current global burden of cryptococcal meningitis among persons living with HIV/AIDS. AIDS 23: 525–530.
4. Banerjee U, Datta K, Casadevall A (2004) Serotype distribution ofCryptococcus neoformansin patients in a tertiary care center in India. Med Mycol 42: 181–186. 5. Ganiem AR, Parwati I, Wisaksana R, van der Zanden A, van de Beek D, et al. (2009) The effect of HIV infection on adult meningitis in Indonesia: a prospective cohort study. AIDS 23: 2309–2316.
6. Jain N, Wickes BL, Keller SM, Fu J, Casadevall A, et al. (2005) Molecular epidemiology of clinical Cryptococcus neoformans strains from India. J Clin Microbiol 43: 5733–5742.
7. Jarvis JN, Harrison TS (2007) HIV-associated cryptococcal meningitis. AIDS 21: 2119–2129.
8. Pan W, Khayhan K, Hagen F, Wahyuningsih R, Chakrabarti A, et al. (2012) Resistance of Asian Cryptococcus neoformans serotype A is confined to few microsatellite genotypes. PLoS One 7: e32868.
9. Sar B, Monchy D, Vann M, Keo C, Sarthou JL, et al. (2004) Increasing in vitro resistance to fluconazole inCryptococcus neoformansCambodian isolates: April 2000 to March 2002. J Antimicrob Chemother 54: 563–565.
10. Sriburee P, Khayhan S, Khamwan C, Panjaisee S, Tharavichitkul P (2004) Serotype and PCR-fingerprints of clinical and environmental isolates of Cryptococcus neoformansin Chiang Mai, Thailand. Mycopathologia 158: 25–31. 11. Tay ST, Lim HC, Tajuddin TH, Rohani MY, Hamimah H, et al. (2006)
Determination of molecular types and genetic heterogeneity of Cryptococcus neoformansandC.gattiiin Malaysia. Med Mycol 44: 617–622.
12. Wahyuningsih R SR, Nafatsa Z, Adawyah R, Mulyati M, SahBandar IN, Imran D, Theelen B, Hagen F, Rozalyani A, Widodo D, Djauzi S, Meis J, and Boekhout T. Yeast isolated from HIV-infected patients in Jakarta, Indonesia: A first report; 2009 May 25–29, 2009; Tokyo, Japan. [Abstract].
13. Chen J, Varma A, Diaz MR, Litvintseva AP, Wollenberg KK, et al. (2008) Cryptococcus neoformansstrains and infection in apparently immunocompetent patients, China. Emerg Infect Dis 14: 755–762.
14. Choi YH, Ngamskulrungroj P, Varma A, Sionov E, Hwang SM, et al. (2010) Prevalence of the VNIc genotype ofCryptococcus neoformansin non-HIV-associated cryptococcosis in the Republic of Korea. FEMS Yeast Res 10: 769–778. 15. Liaw SJ, Wu HC, Hsueh PR (2010) Microbiological characteristics of clinical
isolates ofCryptococcus neoformansin Taiwan: serotypes, mating types, molecular types, virulence factors, and antifungal susceptibility. Clin Microbiol Infect 16: 696–703.
16. Mihara T, Izumikawa K, Kakeya H, Ngamskulrungroj P, Umeyama T, et al. (2012) Multilocus sequence typing of Cryptococcus neoformans in non-HIV associated cryptococcosis in Nagasaki, Japan. Med Mycol. [Epub ahead of print].
17. Day JN, Hoang TN, Duong AV, Hong CT, Diep PT, et al. (2011) Most cases of cryptococcal meningitis in HIV-uninfected patients in Vietnam are due to a distinct amplified fragment length polymorphism-defined cluster ofCryptococcus neoformansvar.grubiiVN1. J Clin Microbiol 49: 658–664.
18. Chowdhary A, Rhandhawa HS, Prakash A, Meis JF (2012) Environmental prevalence of Cryptococcus neoformans andCryptococcus gattii in India: an update. Crit Rev Microbiol 38: 1–16.
19. Litvintseva AP, Kestenbaum L, Vilgalys R, Mitchell TG (2005) Comparative analysis of environmental and clinical populations ofCryptococcus neoformans. J Clin Microbiol 43: 556–564.
20. Randhawa HS, Kowshik T, Chowdhary A, Preeti Sinha K, Khan ZU, et al. (2008) The expanding host tree species spectrum of Cryptococcus gattii and Cryptococcus neoformansand their isolations from surrounding soil in India. Med Mycol 46: 823–833.
21. Trilles L, Lazera M, Wanke B, Theelen B, Boekhout T (2003) Genetic characterization of environmental isolates of theCryptococcus neoformansspecies complex from Brazil. Med Mycol 41: 383–390.
22. Dromer F, Mathoulin-Pelissier S, Launay O, Lortholary O (2007) Determinants of disease presentation and outcome during cryptococcosis: the CryptoA/D study. PLoS Med 4: e21.
23. Viviani MA, Cogliati M, Esposto MC, Lemmer K, Tintelnot K, et al. (2006) Molecular analysis of 311 Cryptococcus neoformans isolates from a 30-month ECMM survey of cryptococcosis in Europe. FEMS Yeast Res 6: 614–619. 24. Ellis DH, Pfeiffer TJ (1990) Ecology, life cycle, and infectious propagule of
Cryptococcus neoformans. Lancet 336: 923–925.
25. Hagen F, Boekhout T (2010) The search for the natural habitat ofCryptococcus gattii. Mycopathologia 170: 209–211.
26. Kidd SE, Chow Y, Mak S, Bach PJ, Chen H, et al. (2007) Characterization of environmental sources of the human and animal pathogenCryptococcus gattiiin British Columbia, Canada, and the Pacific Northwest of the United States. Appl Environ Microbiol 73: 1433–1443.
27. Springer DJ, Chaturvedi V (2010) Projecting global occurrence ofCryptococcus gattii. Emerg Infect Dis 16: 14–20.
28. Byrnes EJ, . (2011) A diverse population ofCryptococcus gattiimolecular type VGIII in southern Californian HIV/AIDS patients. PLoS Pathog 7: e1002205. 29. Chaturvedi S, Dyavaiah M, Larsen RA, Chaturvedi V (2005)Cryptococcus gattiiin
AIDS patients, southern California. Emerg Infect Dis 11: 1686–1692. 30. Hagen F, Illnait-Zaragozi MT, Bartlett KH, Swinne D, Geertsen E, et al. (2010)
In vitro antifungal susceptibilities and amplified fragment length polymorphism genotyping of a worldwide collection of 350 clinical, veterinary, and environmental Cryptococcus gattii isolates. Antimicrob Agents Chemother 54: 5139–5145.
31. Hagen F, Colom MF, Swinne D, Tintelnot K, Iatta R, et al. (2012) Autochthonous and dormant Cryptococcus gattiiinfections in Europe. Emerg Infect Dis 18: 1618–1624.
32. Colom MF, Hagen F, Gonzalez A, Mellado A, Morera N, et al. (2012) Ceratonia siliqua (carob) trees as natural habitat and source of infection by Cryptococcus gattiiin the Mediterranean environment. Med Mycol 50: 67–73. 33. Datta K, Bartlett KH, Baer R, Byrnes E, Galanis E, et al. (2009) Spread of
Cryptococcus gattiiinto Pacific Northwest region of the United States. Emerg Infect Dis 15: 1185–1191.
34. Hagen F CP, Polacheck I, Ma H, van Nieuwerburgh F, Gabaldon T, Kagan S, Pursall ER, Hoogveld HL, van Iersel LJJ, Klau GW, Kelk SM, Stougie L, Bartlett KH, Voelz K, Pryszcz LP, Castaneda E, Lazera M, Meyer W, Deforce D, Meis JF, May RC, Klaassen CHW and Boekhout T (2013) Ancient Dispersal of the Human Fungal Pathogen Cryptococcus gattii from the Amazon Rainforest. PLoS ONE 8(8): e71148.
35. Kidd SE, Hagen F, Tscharke RL, Huynh M, Bartlett KH, et al. (2004) A rare genotype ofCryptococcus gattiicaused the cryptococcosis outbreak on Vancouver Island (British Columbia, Canada). Proc Natl Acad Sci U S A 101: 17258– 17263.
36. Bovers M, Hagen F, Kuramae EE, Boekhout T (2008) Six monophyletic lineages identified within Cryptococcus neoformans and Cryptococcus gattii by multi-locus sequence typing. Fungal Genet Biol 45: 400–421.
37. Hanafy A, Kaocharoen S, Jover-Botella A, Katsu M, Iida S, et al. (2008) Multilocus microsatellite typing forCryptococcus neoformansvar.grubii. Med Mycol 46: 685–696.
38. Illnait-Zaragozi MT, Martinez-Machin GF, Fernandez-Andreu CM, Boekhout T, Meis JF, et al. (2010) Microsatellite typing of clinical and environmental Cryptococcus neoformans var. grubii isolates from Cuba shows multiple genetic lineages. PLoS One 5: e9124.
39. Meyer W, Aanensen DM, Boekhout T, Cogliati M, Diaz MR, et al. (2009) Consensus multi-locus sequence typing scheme forCryptococcus neoformansand Cryptococcus gattii. Med Mycol 47: 561–570.
40. Ngamskulrungroj P, Gilgado F, Faganello J, Litvintseva AP, Leal AL, et al. (2009) Genetic diversity of the Cryptococcus species complex suggests that Cryptococcus gattiideserves to have varieties. PLoS One 4: e5862.
41. Simwami SP, Khayhan K, Henk DA, Aanensen DM, Boekhout T, et al. (2011) Low diversityCryptococcus neoformansvarietygrubiimultilocus sequence types from Thailand are consistent with an ancestral African origin. PLoS Pathog 7: e1001343.
42. Boekhout T, Theelen B, Diaz M, Fell JW, Hop WC, et al. (2001) Hybrid genotypes in the pathogenic yeastCryptococcus neoformans. Microbiology 147: 891– 907.
43. Litvintseva AP, Thakur R, Vilgalys R, Mitchell TG (2006) Multilocus sequence typing reveals three genetic subpopulations ofCryptococcus neoformansvar.grubii (serotype A), including a unique population in Botswana. Genetics 172: 2223– 2238.
44. Cogliati M, Zamfirova RR, Tortorano AM, Viviani MA (2013) Molecular epidemiology of Italian clinicalCryptococcus neoformansvar.grubiiisolates. Med Mycol. [Epub ahead of print].
45. Barreto de Oliveira MT, Boekhout T, Theelen B, Hagen F, Baroni FA, et al. (2004)Cryptococcus neoformansshows a remarkable genotypic diversity in Brazil. J Clin Microbiol 42: 1356–1359.
46. Hagen F, Illnait-Zaragozi MT, Meis JF, Chew WH, Curfs-Breuker I, et al. (2012) Extensive genetic diversity within the Dutch clinicalCryptococcus neoformans population. J Clin Microbiol 50: 1918–1926.
47. Librado P, Rozas J (2009) DnaSP v5: a software for comprehensive analysis of DNA polymorphism data. Bioinformatics 25: 1451–1452.
49. Earl D, vonHoldt B (2012) STRUCTURE HARVESTER: a website and program for visualizing STRUCTURE output and implementing the Evanno method. Conservation Genet Resour 4: 359–361.
50. Jakobsson M, Rosenberg NA (2007) CLUMPP: a cluster matching and permutation program for dealing with label switching and multimodality in analysis of population structure. Bioinformatics 23: 1801–1806.
51. Rosenberg NA (2004) Distruct: a program for the graphical display of population structure. Mol Ecol Notes 4: 137–138.
52. Agapow PM, Burt A (2001) Indices of multilocus linkage disequilibrium. Mol Ecol Notes 1: 101–102.
53. Huson DH, Bryant D (2006) Application of phylogenetic networks in evolutionary studies. Mol Biol Evol 23: 254–267.
54. van Iersel L, Kelk S, Rupp R, Huson D (2010) Phylogenetic networks do not need to be complex: using fewer reticulations to represent conflicting clusters. Bioinformatics 26: i124–131.
55. Francisco AP, Bugalho M, Ramirez M, Carrico JA (2009) Global optimal eBURST analysis of multilocus typing data using a graphic matroid approach. BMC Bioinformatics 10: 152.
56. Espinel-Ingroff A, Chowdhary A, Cuenca-Estrella M, Fothergill A, Fuller J, et al. (2012)Cryptococcus neoformans-Cryptococcus gattiispecies complex: an international study of wild-type susceptibility endpoint distributions and epidemiological cutoff values for amphotericin B and flucytosine. Antimicrob Agents Chemother 56: 3107–3113.
57. Espinel-Ingroff A, Aller AI, Canton E, Castanon-Olivares LR, Chowdhary A, et al. (2012)Cryptococcus neoformans-Cryptococcus gattiispecies complex: an interna-tional study of wild-type susceptibility endpoint distributions and epidemiological cutoff values for fluconazole, itraconazole, posaconazole, and voriconazole. Antimicrob Agents Chemother 56: 5898–5906.
58. Excoffier L, Lischer HE (2010) Arlequin suite ver 3.5: a new series of programs to perform population genetics analyses under Linux and Windows. Mol Ecol Resour 10: 564–567.
59. Litvintseva AP, Mitchell TG (2012) Population genetic analyses reveal the African origin and strain variation ofCryptococcus neoformansvar.grubii. PLoS Pathog 8: e1002495.
60. Litvintseva AP, Carbone I, Rossouw J, Thakur R, Govender NP, et al. (2011) Evidence that the human pathogenic fungusCryptococcus neoformansvar.grubiimay have evolved in Africa. PLoS One 6: e19688.
61. Tibayrenc M, Ayala FJ (2012) Reproductive clonality of pathogens: a perspective on pathogenic viruses, bacteria, fungi, and parasitic protozoa. Proc Natl Acad Sci U S A 109: E3305–3313.
62. Franzot SP, Hamdan JS, Currie BP, Casadevall A (1997) Molecular epidemiology ofCryptococcus neoformansin Brazil and the United States: evidence for both local genetic differences and a global clonal population structure. J Clin Microbiol 35: 2243–2251.
63. Meyer W, Marszewska K, Amirmostofian M, Igreja RP, Hardtke C, et al. (1999) Molecular typing of global isolates ofCryptococcus neoformansvar.neoformansby polymerase chain reaction fingerprinting and randomly amplified polymorphic DNA-a pilot study to standardize techniques on which to base a detailed epidemiological survey. Electrophoresis 20: 1790–1799.
64. Olsen B, Munster VJ, Wallensten A, Waldenstrom J, Osterhaus AD, et al. (2006) Global patterns of influenza a virus in wild birds. Science 312: 384–388. 65. Hiremath SS, Chowdhary A, Kowshik T, Randhawa HS, Sun S, et al. (2008)
Long-distance dispersal and recombination in environmental populations of Cryptococcus neoformansvar.grubiifrom India. Microbiology 154: 1513–1524. 66. Goldman DL, Khine H, Abadi J, Lindenberg DJ, Pirofski L, et al. (2001)
Serologic evidence for Cryptococcus neoformans infection in early childhood. Pediatrics 107: E66.
67. Garcia-Hermoso D, Janbon G, Dromer F (1999) Epidemiological evidence for dormantCryptococcus neoformansinfection. J Clin Microbiol 37: 3204–3209. 68. Hu XP, Wu JQ, Zhu LP, Wang X, Xu B, et al. (2012) Association of Fcgamma
receptor IIB polymorphism with cryptococcal meningitis in HIV-uninfected Chinese patients. PLoS One 7: e42439.
69. Ou XT, Wu JQ, Zhu LP, Guan M, Xu B, et al. (2011) Genotypes coding for mannose-binding lectin deficiency correlated with cryptococcal meningitis in HIV-uninfected Chinese patients. J Infect Dis 203: 1686–1691.