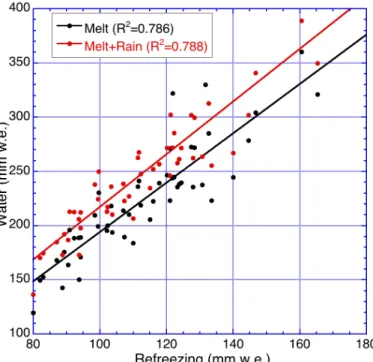
Refreezing on the Greenland ice sheet: a comparison of parameterizations
Texto
Imagem

Documentos relacionados
Sendo bem receptiva, a Diretora administrativa do IPHAEP foi bastante atenciosa e me citou as formas necessárias de procedimento - em contrapartida contei a ela sobre o projeto,
i) A condutividade da matriz vítrea diminui com o aumento do tempo de tratamento térmico (Fig.. 241 pequena quantidade de cristais existentes na amostra já provoca um efeito
In the hinterland (Lika region) they are partly permeable but on higher positions at Velebit Mt. calcareous breccias are highly permeable. The best prove for the mentioned is
The limestone caves in South Korea include a variety of speleothems such as soda straw, stalactite, stalagmite, column, curtain (and bacon sheet), cave coral,
The Rifian groundwaters are inhabited by a relatively rich stygobiontic fauna including a number of taxa related to the ancient Mesozoic history of the Rifian
Extinction with social support is blocked by the protein synthesis inhibitors anisomycin and rapamycin and by the inhibitor of gene expression 5,6-dichloro-1- β-
Despercebido: não visto, não notado, não observado, ignorado.. Não me passou despercebido
The main questions to be answered in the present work are (a) if shrimp catches vary accordingly to changes in river discharge, (b) if interannual climatological events, such as El
