Pocillopora damicornis
to Ocean Acidification and
Warming
Emily B. Rivest*, Gretchen E. Hofmann
Department of Ecology, Evolution and Marine Biology, University of California Santa Barbara, Santa Barbara, California, United States of America
Abstract
Ocean acidification and warming are expected to threaten the persistence of tropical coral reef ecosystems. As coral reefs face multiple stressors, the distribution and abundance of corals will depend on the successful dispersal and settlement of coral larvae under changing environmental conditions. To explore this scenario, we used metabolic rate, at holobiont and molecular levels, as an index for assessing the physiological plasticity ofPocillopora damicornis larvae from this site to conditions of ocean acidity and warming. Larvae were incubated for 6 hours in seawater containing combinations of CO2 concentration (450 and 950matm) and temperature (28 and 30uC). Rates of larval oxygen consumption were higher at elevated temperatures. In contrast, high CO2levels elicited depressed metabolic rates, especially for larvae released later in the spawning period. Rates of citrate synthase, a rate-limiting enzyme in aerobic metabolism, suggested a biochemical limit for increasing oxidative capacity in coral larvae in a warming, acidifying ocean. Biological responses were also compared between larvae released from adult colonies on the same day (cohorts). The metabolic physiology ofPocillopora damicornis
larvae varied significantly by day of release. Additionally, we used environmental data collected on a reef in Moorea, French Polynesia to provide information about what adult corals and larvae may currently experience in the field. An autonomous pH sensor provided a continuous time series of pH on the natal fringing reef. In February/March, 2011, pH values averaged 8.07560.023. Our results suggest that without adaptation or acclimatization, only a portion of naı¨vePocillopora damicornis
larvae may have suitable metabolic phenotypes for maintaining function and fitness in an end-of-the century ocean.
Citation:Rivest EB, Hofmann GE (2014) Responses of the Metabolism of the Larvae ofPocillopora damicornisto Ocean Acidification and Warming. PLoS ONE 9(4): e96172. doi:10.1371/journal.pone.0096172
Editor:Hans G. Dam, University of Connecticut, United States of America
ReceivedDecember 20, 2013;AcceptedApril 4, 2014;PublishedApril 25, 2014
Copyright:ß2014 Rivest, Hofmann. This is an open-access article distributed under the terms of the Creative Commons Attribution License, which permits unrestricted use, distribution, and reproduction in any medium, provided the original author and source are credited.
Funding:Funding was provided by the Moorea Coral Reef Long Term Ecological Research mini-grant awarded to E.B.R. and G.E.H. E.B.R. was supported by the National Science Foundation Graduate Research Fellowship Program. Portions of this project were supported by funds from the University of California in support of a multi-campus research program, Ocean Acidification: A Training and Research Consortium (http://oceanacidification.msi.ucsb.edu/) to G.E.H. The funders had no role in study design, data collection and analysis, decision to publish, or preparation of the manuscript.
Competing Interests:The authors have declared that no competing interests exist.
* E-mail: [email protected]
Introduction
Ocean acidification (OA) and ocean warming are expected in marine ecosystems as a consequence of continued anthropogenic fossil fuel use, with significant changes already detected in the surface ocean [1]. By 2100, human-derived atmospheric pCO2
(A1FI SRES [2]) absorbed by the ocean will cause seawater acidity to double [3]. Simultaneously, average sea surface temperatures will rise by 1–3uC [2]. Within marine ecosystems, we are only beginning to appreciate how regional scale variation might influence biological responses to environmental change and the adaptive potential of populations [4–9]. In this study, we explore one element - the physiological responses of larvae of stony coral, animals whose thermal physiology limits can be exceeded by small increases in water temperature (1–2uC; [10,11]) or can encompass a 10uC temperature range, as a result of local adaptation, seasonal acclimatization, or thermotolerance of hostedSymbiodiniumclades [12]. To provide an assessment of the sensitivity of coral larvae to future ocean conditions, we measured how pH and temperature interact to influence the metabolic status of the larvae of a resident coral, Pocillopora damicornis. To provide a relevantin situ environ-mental context for our study site, we determined the natural
variation of pH and temperature on the natal coral reef during the month in which these larvae developed and released.
The study of OA has been greatly enhanced by monitoring natural pH dynamics in different marine near-shore environments. Recently, the challenge of acquiring high-frequency, long, continuous environmental datasets that estimate these changing conditions for study populations of benthic species has been overcome with the advent of autonomous oceanographic sensors that record pH [13]. Deployed and tested in sites ranging from tropical to polar, these sensors have shown that calculations of global ocean pH underestimate the natural variation in seawater pH occurring between marine ecosystems [14–17]. With these sensors, the research community can now collect high-frequency environmental data to complement IPCC projections and to provide details of the conditions that adults and larvae experience in situ[9].
As our environmental data banks grow, our knowledge about biological tolerances of interacting stressors is also increasing, particularly for stressors of OA and temperature (for recent reviews, see [18–23]). High pCO2can exacerbate the effects of
spider crab,Hyas araneus, increased as pCO2rose [27]. However,
responses of physiological processes of marine invertebrates to increases in pCO2and temperature have been inconsistent [28–
32]. This variation in response to OA and its interaction with temperature may be due to differential sensitivities of particular physiological processes, like calcification, as well as taxon- and species-specific differences in sensitivity to these environmental stressors [18,21]. Combining existing knowledge of environmental variability and potential biological responses to future ocean conditions, it is becoming increasingly clear that studies, such as this one, that present changes in biological processes at the levels of species and developmental stage in the context of environmental data are valuable for understanding how future environmental change might alter populations [33].
Tropical reef corals may be particularly vulnerable to changes in their abiotic environment. Firstly, thermal stress presents a major threat to coral reef health as the oceans continue to warm [34]. Thermotolerance limits of coral can be passed by only a few degrees of ocean warming [10,11], and in response, bleaching often occurs, where the density of endosymbiont algae within the coral decreases. OA may act synergistically with warming to lower the temperature threshold for bleaching in reef-building corals, magnifying this threat [35]. Additionally, larvae of corals, the developmental stage that contributes to connecting populations and restoring degraded reefs, may be particularly sensitive to the interaction of OA and warming, because their metabolic demands are high while they are actively swimming and locating optimal settlement sites [36].
To better understand the consequences of OA and warming for the future of coral reefs, we examined the response of the larvae of the cauliflower coral, Pocillopora damicornis(Linnaeus, 1758). This branching scleractinian coral is widely distributed throughout shallow-water habitats of the Indian and Pacific oceans [37], and, like other brooding coral species, produces lecithotrophic, free-swimming larvae that are released every month in time with the lunar cycle (e.g. [38–40]). The larvae contain endosymbiotic Symbiodinium upon release, vertically transmitted from the parent [41]. In about 15% of coral species including P. damicornis, Symbiodiniumalgal endosymbionts supplement the energy available to coral larvae via transfer of metabolites [41–43]; the fragile symbiosis may make the holobiont more sensitive to OA and rising temperature. During their pelagic duration, P. damicornis larvae mainly rely on their stored lipid and translocated metabolites from theSymbiodiniumto fuel their dispersal, settlement, and metamor-phosis into the first polyp [43]. Though local retention is common [44,45], these energy sources can allow P. damicornis larvae to retain competency in the plankton for more than 100 days, enough time to be carried by currents throughout the tropical Pacific Ocean [46]. Negative consequences of OA and warming on the energy budgets of P. damicornis larvae could thus affect dispersal distance and ultimately population dynamics for this species.
The life history strategy of corals likeP. damicornismay provide a form of defense against the negative consequences of interacting climate change stressors on the species as a whole (e.g.[47–49]). Based on their spawning date, larval cohorts differ in terms of their inherent fitness-related traits; for example, Putnam et al. [49] found that larval size, symbiont density, and symbiont photo-physiology vary significantly between cohorts of P. damicornis larvae. In another brooder,Porites astreoides, larval cohorts differed in symbiont density and potential for autotrophy [50]. As a result, larvae with different spawning dates may have dissimilar responses to environmental stress. While the overall proportion of fit offspring is reduced consequently, this strategy for spreading risk
may increase the likelihood that some offspring have phenotypes better suited for future ocean conditions.
Although the response of coral larvae to elevated pCO2 and
temperature is difficult to predict, in ectothermic animals, environmental stressors commonly elicit metabolic depression – a regulated reduction in metabolism in response to stress-related cues [51,52]. Strategically, suppression of metabolism may be an effective adaptive strategy in the short-term because it prevents mortality by increasing tolerance [53]. However, when extended over long periods, low metabolic rates will likely impair growth and reproduction, decreasing fitness of the species [52,54].
For corals and their early life history stages, metabolic depression may be a likely response to rising ocean acidity and temperature [7,55]. Respiration rates of many life history stages increase with temperature [50,56,57], but narrowing of thermal tolerance windows under OA [24–27] may cause metabolism to decline at more conservative thermal extremes. If so, conditions of high CO2 and high temperature may delay or prevent larval
growth and metamorphosis, increasing time in the plankton while decreasing recruitment, post-settlement success, and fitness. While elevated temperature is known to shorten the pelagic larval duration of coral larvae (e.g. [50,58]), metabolic depression induced by the interacting stressors may prevent larvae from accomplishing this energetically-costly transformation. Larvae of some broadcast-spawning and brooding corals experience meta-bolic suppression at high pCO2 [59,60] while other species are
more tolerant [61]. Recent studies on larvae from a Taiwan population of P. damicornis have found variable responses of metabolism to elevated temperatures and a lack of response to elevated pCO2 [48,62,63]. Our study builds off this solid
foundation to provide a comparison using a genetically distinct population in Moorea [64], pCO2levels appropriate for current
environmental variability and future projections, and insightful molecular proxies. We used environmental data collected on the reef to identify extreme conditions experienced in the field and as a context for interpreting biological responses of coral larvae to future ocean scenarios.
Studies of larval metabolism can contribute to our ability to predict the future impact of ocean acidification and warming on corals through estimates of physiological plasticity, the ability of an organism to vary the rates of physiological processes in order to maintain homeostasis as environmental conditions change [65,66]. Making use of its existing physiological repertoire to tailor its phenotype at the cellular and molecular level to a new environmental condition, the organism has the potential for acclimatization and longer-term persistence [24,67]. In this study, we explored plasticity of physiological responses of coral larvae from a reef in French Polynesia to elevated pCO2 and
temperature. The study was motivated by these questions: (1) what is the response of P. damicornis larvae to conditions of decreased pH and warming, measured via two indices of metabolism - rates of oxygen consumption and citrate synthase activity?, (2) are there differences in larval sensitivity to environ-mental change between cohorts that are released from adult colonies at different times?, and (3) what is the present-day exposure of P. damicornis to natural variability of pH and temperature on the natal reef?
Materials and Methods
Collection of Coral Larvae
Larvae were collected from adult colonies following their lunar pattern of reproduction [68]. On the new moon (March 4, 2011), eight colonies ofP. damicorniswere collected at,1–2 m depth from a fringing reef site. Due to the proximity of the collection site to the oceanographic instruments, the pH and temperature histories of the adult colonies were characterized for the month prior to collection during which the larvae developed. Each colony was maintained in an aquarium at University of California Berkeley Richard B. Gump South Pacific Research Station with indirect natural sunlight and a slow flow of coarsely filtered seawater. Temperatures in these aquaria averaged 28.460.4uC throughout the spawning period. Overnight, larvae were captured in mesh-lined cups that received the outflow of each aquarium. Daily at dawn, larvae from each colony were collected, counted, pooled, and randomly assigned to experimental treatments. Although there was daily variation in larval output between colonies, low release levels in general necessitated the use of all larvae in the daily experiments. Uneven contributions of genotypes in the experimental larval pool each day were unavoidable and preclude any distinction between genotypic responses and species-level responses to OA and temperature. Data presented here were collected from manipulative experiments conducted with larvae released on March 13 (‘‘Day 90), March 14 (‘‘Day 100), and March 15 (‘‘Day 110).
Experimental Incubations
Two CO2treatments were prescribed: Low-pCO2(,450matm
CO2) and High-pCO2 (,950matm CO2). The low treatment
represents an environmental condition that released larvae may currently experience at this site (approximated by environmental data), while the high treatment represents a level of dissolved pCO2that is outside the present-day pH minima of the seawater
bathing the fringing reef and that is a surface ocean average expected by the year 2100 under the A1FI scenario [69]. These conditions approximate those at the reef scale and not what may be experienced and manipulated within the boundary layers of the adult corals. pCO2 levels were combined with two experimental
temperatures, 27.8uC and 30.6uC. The control temperature (27.8uC) approximates the 5-year average temperature at Moorea Coral Reef Long Term Ecological Research (MCR LTER) monitoring site close to the collection site for adultP. damicornis as well as a verified environmental condition during the month preceding and including the release of larvae used in this experiment. The elevated temperature represents the average surface ocean temperature by year 2100 as predicted by global temperature projections [70].
Treatments were created as described in Edmundset al.[71] in a MCR LTER facility, with one aquarium for each treatment combination of pCO2and temperature. Tank replication was not
possible due to unexpected equipment failure. The closed-circuit aquaria were filled with 20mm-filtered seawater, 16% of which was replaced daily. Gas mixtures of the two desired CO2 levels
were created following Edmunds et al. [71] and then bubbled directly into experimental aquaria. Saturation of pCO2 in the
seawater was reached before each daily experiment was performed. Individual Aqua Logic aquarium heaters and a chill loop maintained tank temperature treatments at +/21uC. Aquaria were darkened with aluminum foil. The four treatments created by this experimental set-up are defined as low tempera-ture-low pCO2 (LTLC), low temperature-high pCO2 (LTHC),
high temperature-low pCO2(HTLC), and high temperature-high
pCO2(HTHC).
To verify and monitor the physical parameters of the OA x temperature treatments, the chemistry of the seawater in the aquaria was analyzed daily. pH, temperature, salinity, and total alkalinity of seawater in each aquarium were measured during the incubations.
Seawater temperature was measured throughout the experi-mental exposures (5–6 times) using a thermocouple (T-type, Omega Digital Thermometer, Model HH81A). Seawater salinities were measured using a conductivity meter (YSI 3100). Seawater pH was measured using a spectrophotometric method with indicator dye, m-cresol purple (SOP 6b [72]). Total alkalinity (AT) was measured using an automated, open-cell potentiometric
titration (SOP 3b [72]) with a Mettler-Toledo T50 titrator and a DG115-SC pH probe (Mettler-Toledo). Titrations were per-formed using certified acid titrant (,0.1 M HCl, 0.6 M NaCl; A. Dickson Laboratory, Scripps Institute of Oceanography), and a non-linear least-squares approach was used to calculate AT[73].
For each day of the experiment, analyzed certified reference materials from A. Dickson Laboratory were accurate within 10mmol kg21. pH at 25uC, AT, temperature, and salinity were
used to calculate the pH and pCO2 of the treatments using
CO2calc [74], with CO2constants K1, K2 from [75] refit by [76]
and pH expressed on the total scale (mol kg-SW21).
Assessment of Physiological Responses
To assess how larval metabolism responds to OA and warming, larvae were placed in 10 mL serum vials that contained seawater filtered to 0.2mm from aquaria at all four combinations of temperature and pCO2. For each treatment combination, there
were 6 vials containing 5 larvae each and two blank vials. Each vial was sealed with parafilm so that no air bubbles remained inside (for optimization of methodology, see File S1). To account for any change in chemistry as treatment water was filtered to 0.2mm and used to fill the vials, treatment water was measured before and after the vials were loaded (see Table 1, rows ‘Vials’). The loaded vials were incubated for 6 hours in the dark treatment aquarium (the source for the water used to fill the vials). Due to the time needed to read the oxygen concentration in the vials post-incubation, loading of the vials for each treatment was staggered by one hour with the order randomized daily. Vials were cleaned and re-used for respirometry incubations on subsequent days.
In order to measure oxygen concentration, approximately
325mL of the seawater in each vial was injected into a glass
custom-built optrode cell. One measurement of oxygen consump-tion was made per vial. A built-in water jacket surrounding the optrode cell was connected to a re-circulating water bath held at the same treatment temperature of the vials being analyzed. After two minutes, the oxygen concentration was read in triplicate (Microx TX3, Presens GmbH, Regensberg, Germany). Oxygen consumption over the 6-hour incubation was calculated (nmol O2
larva21min21), and batches of 5 larvae from each respiration vial were preserved for analysis of total protein in order to account for variation of larval mass within a daily cohort. WhileSymbiodinium numbers were not accounted for, variation in endosymbiont density is unlikely to affect the biomass-standardized rate of respiration [77].
To complement oxygen consumption rates, citrate synthase (CS) activity was quantified to gauge changes in larval oxidative capacity in response to the OA x temperature treatments. Additional larvae were incubated for 6 hours simultaneously with those in the respirometry vials and then frozen at280uC. Within each treatment, these larvae were incubated at a density of 1 larva mL21in three flow-through 50 mL Falcon tubes enhanced with
CS activity in homogenates of larvae of P. damicornis was measured spectrophotometrically according to Srere [78] as modified by preliminary tests to determine optimal pH and substrate concentrations (File S2). To quantify CS activity, larvae were first homogenized on ice in 50 mM histidine pH 7.8 using a pestle followed by further physical disruption using a pipettor. Centrifugation (5 min at 13,3626g) was used to separate Symbiodinium cells from animal homogenate with minimal animal mitochondria in the pellet. Aliquots of the homogenates were preserved for later analysis of total protein. Triton X-100 was added to the remaining homogenate at a final concentration of 0.25% v/v. At 28.0uC 60.1uC, the control temperature for culturing and respiration, absorbance at 412 nm of the reaction was measured with and without oxaloacetate, with final concen-trations of 0.4 mM acetyl coA, 0.25 mM DTNB, and 0.5 mM oxaloacetate. Measurements of CS activity were technically replicated for each tube of larvae (n= 2). Rates of CS activity are expressed asmmol min21larva21and are also standardized by total protein to represent protein-specific activities (mmol min21g animal protein21[79,80]).
Total protein values were used to normalize data for oxygen consumption and CS activity. Following sonication, total protein content of larvae was determined using a Bradford assay [79,80]. Temperature coefficient Q10 values were calculated to
deter-mine if the sensitivity of larval metabolism to temperature changed under different pCO2levels. Q10, commonly used to describe the
sensitivity of reaction rates to temperature, is the factor by which the reaction rate increases following a 10-degree increase in temperature. To calculate this coefficient, the following formula was used: Q10= (R2/R1)‘(10/(T2–T1)), where R is the rate of
reaction at Temperature 1 or Temperature 2. Q10 values of
biological reaction rates are commonly between 2 and 3 (e.g.[81]). Values below 2 indicate a decrease in temperature sensitivity while values above 3 indicate hypersensitivity of the reaction to changes in temperature.
Statistical Analysis
All data were analyzed using R version 3.0.1 (R Core Team 2013). A one-way ANOVA in which pCO2and temperature were
fixed factors was used to compare physical conditions between treatments. With pCO2, temperature, and day of release as fixed
factors, effects on larval- and protein-specific rates of oxygen consumption, CS activity, and total and animal protein levels were estimated using linear mixed-effect models (nlme package in R [82]). To account for possible similarities between larvae
incubated in the same container, ‘‘tube’’ was considered a random factor in all statistical analyses. Model selection was performed incrementally following Burnham and Anderson [83]. At each iteration, the simpler model was chosen if the model AIC value did not increase by 2 or more and if there was not a significant difference in the model log likelihood ratio. Effects of fixed factors were compared using likelihood ratio tests conducted on selected models fit using maximum likelihood [84,85]. When significant differences were detected among treatments, orthogonal contrasts were performed as post-hoc analyses using the multcomp package in R [86]. Tukey’s HSD was used for models without significant interactions between terms. When significant interactions were present, post-hoc analyses were performed using linear contrasts with Bonferonni corrections for multiple comparisons. In all cases, statistical assumptions of normality and homogeneity of variance were met.
Collection of Environmental Data
pH and temperature time series were generated on a fringing reef in Moorea, French Polynesia. pH was recorded continuously from January 28 to March 19, 2011 on the fringing reef approximately 90 m from the collecting location of adult P. damicornis parents. An autonomous data logger based on a Honeywell Durafet pH sensor, called a SeaFET [13], was deployed at 17.4803 S, 149.7989 W. The SeaFET was deployed at 3.3 m depth and suspended approximately 0.6 m off the sandy bottom; the instrument measured pH voltage at 10-minute intervals, averaging data over 30-second periods. The sensor reference anomaly oscillated between 60.01 and no detectable drift of the instrument occurred. Additionally, output of contin-uous operation of this sensor over a 6-month period has been shown to match frequent discrete samples of seawater chemistry [13]. Adjacent to the SeaFET were two Seabird thermisters (SBE 39), synced with the SeaFET to simultaneously record tempera-ture.
Following deployment, the SeaFET electrodes were calibrated using discrete seawater samples collectedin situ, justified based on sensor characteristics previously demonstrated [13]. On February 25, 2011, a SCUBA diver using a Niskin bottle collected a single calibration sample adjacent to the SeaFET in concurrence with its voltage reading. Temperature of the seawaterin situwas measured using an alcohol thermometer. pH, total alkalinity (AT), and
salinity were measured in four replicates (see below) within 1–2 hours of sample collection. Average ATand salinity values were
used to generatein situ pH,Varag,Vcalc, and pCO2values using
Table 1.Summary of physical conditions in treatment aquaria and vials for experiments conducted on Days 9–11.
Treatment Temperature (6C) Salinity (ppt) pH
AT
(mmol kg21
) pCO2(matm)
LTLC Tank 27.5 35.33 8.018 2353613 435.9366.00
Vials 7.995 464.4065.96
HTLC Tank 30.760.1 35.40 7.985 236467 476.6263.60
Vials 7.994 465.6165.91
LTHC Tank 28.1 35.43 7.714 2354616 995.54611.82
Vials 7.726 965.35616.05
HTHC Tank 30.4460.1 35.6360.1 7.736 238365 952.1069.98
Vials 7.759 894.91610.93
CO2 calc [74]. For purposes of calculation, salinity and total alkalinity were assumed constant throughout the 2-month deployment, allowing us to generate a real-time graph of pCO2
variation over a coral reef. These assumptions were necessary because these parameters could only be measured using discrete samples. To estimate the error introduced in the pCO2
calculations by our assumptions, we used discrete bottle samples to estimate changes in the carbonate chemistry, salinity, and TA at the deployment site following a rain event.
Data Access
Environmental (accn #: knb-lter-mcr.2004) and physiological (accn#: knb-lter-mcr.2008) datasets generated by this study are publicly available in the LTER Metacat data catalog, mirrored in DataONE.
Results
Larval Production
During the period of this experiment, P. damicornis colonies released planula larvae for 16 days following the new moon in March 2011 with variation in the number of larvae released (Fig. 1). The peak day of larval release for this representative population was Lunar Day 9 (Fig. 1). Larval release was not counted on Lunar Days 7 and 8 due to a tsunami warning and a power outage.
Physiological Response of Larvae to Controlled pH Variation
On several days during this pattern of larval release (Lunar Days 9–11), we tested the performance using two indicators of metabolism – oxygen consumption and CS activity, an indicator of oxidative capacity.
In order to assess the response of coral larvae to present and future pCO2and temperature levels, larvae were exposed to a set
of conditions in the lab where the temperature and seawater chemistry in the experimental aquaria were carefully controlled (Table 1). Experimental treatment conditions remained stable throughout the course of the experiment and grouped by treatment, despite slight differences between aquarium and vial conditions (File S3).
Oxygen consumption, used as an indirect measure of metab-olism, showed that larvae were sensitive to projected
end-of-the-century ocean chemistry. Oxygen consumption of P. damicornis larvae varied between 0.082660.006 nmol larva21min21 (Day 11 LTHC) and 0.139460.009 nmol larva21min21 (Day 10 LTHC). With no significant interactions between fixed effects, larval specific oxygen consumption varied significantly by pCO2,
temperature, and day (Table 2). In general, rates of oxygen consumption per larva were higher at Low-pCO2(vs. High-pCO2;
Tukey’s HSD; p= 0.0133; Fig. 2A) and at 30.6uC (vs. 27.8uC; Tukey’s HSD;p,0.0001). Additionally, larvae released on Day 10 respired more quickly than larvae released on the other two days (Tukey’s HSD; p,0.0001 for both). Larval rates of oxygen consumption were on average 22.4% higher at 30.6uC vs. 27.8uC. The significant effect of CO2across days is driven by the lower
oxygen consumption rates at 30.6uC on Day 11. At 30.6uC, Day 11 larvae at High-pCO2 consumed oxygen 19.2% more slowly
than larvae at Low-pCO2, compared with 7.6% on Day 9 and
0.1% on Day 10 (Fig. 2A).
Figure 1. Release ofPocillopora damicornislarvae in March 2011.
Larval release increased following the new moon and then decreased after lunar day 9. Numbers of larvae released per colony (n= 8 colonies) are described by bar segments of different colors.
doi:10.1371/journal.pone.0096172.g001
Figure 2. Oxygen consumption ofPocillopora damicornislarvae
over 6-hour exposures to combinations of pCO2and
temper-ature.Mean6SE (n= 6) rates of oxygen consumption standardized by number of larvae for those released on Days 9 - 11 (A) and standardized by total protein for larvae released on Days 9 - 11 (B). Larval respiration is significantly higher at 30.6uC (vs. 27.8uC), at Low-pCO2(vs. High-pCO2) and on Day 10. Protein-specific rates are significantly higher at 30.6uC on Day 11 only. Refer to Table 2 for statistical details. Symbols are offset to improve clarity: Low-pCO2 at 450matm (circles), High-pCO2 at
950matm (triangles), 27.8uC (blue), and 30.6uC (red).
To complement calculations of metabolic rate on a per larva basis, oxygen consumption was standardized by total holobiont protein, which varied significantly by pCO2and Day (Table 2, File
S4). Protein-specific rates account for differences in mass between replicates and treatments whereas larval-specific metabolism allows for interpretation of physiological response in ecological units, at the level of the whole animal. When protein-specific rates of oxygen consumption were compared, elevated pCO2no longer
caused a significant decrease in oxygen consumption for larvae released on Days 9–11 (Table 2, Fig. 2B). Effects of T and Day remained significant (Table 2). Post-hoc analysis of the marginally significant interaction (T x Day, Table 2) revealed significant effects of temperature on Day 11 (linear contrast with Bonferroni correction; F=24.045, p= 0.0002), but no difference between temperatures on Days 9 and 10. The effect of temperature on protein-specific rates of oxygen consumption on Day 11 was 2-fold greater than on the other days.
Citrate synthase (CS) activity was measured as a proxy for the number of intact mitochondria and to quantify the capacity of larval aerobic metabolic machinery [87]. With respect to numbers of larvae, coral animal CS activity differed by Day, marginally by T and not by pCO2. Despite a significant interaction between T
and Day (Table 3), post-hoc analyses using linear contrasts with Bonferroni corrections showed insignificant differences between temperature groups on each day. On Day 9, elevated temperature raised CS rates slightly while on Day 11, CS activity was suppressed by elevated T and/or pCO2in general (Fig. 3A). When
coral animal CS activities were normalized to total protein from the animal fraction of the larval holobiont, activities ranged from 0.0013660.0003mmol g animal protein21min21 (Day 11 HTLC, Fig. 3B) to 0.0016360.00004mmol g animal protein21 -min21 (Day 10 HTLC). Protein-specific CS activities varied significantly by T x Day, and pCO2 x T x Day (Table 3).
Determined using post-hoc analyses of linear contrasts with Bonferroni corrections, there were no significant contrasts among treatment groups on Day 9. Day 10 CS activity HTLC was significantly greater than LTLC (F= 3.513, p= 0.0080) and LTHC (F= 3.753, p= 0.0032). On Day 11, protein-specific CS activity for LTLC was significantly greater than for both high-temperature treatments (HTLC: F= 6.207, p,0.0001; HTHC: F= 4.063,p= 0.0009). Treatment groups LTHC and HTLC were
also significantly different (F= 03.829,p =0.0023). While protein-specific rates of CS activity do not yield information regarding relative amounts of CS with respect to the pool of total animal protein (see File S4), they reflect differences in activity per enzyme unit, changes in the proportion of CS within total protein, or a combination of both.
We can describe how OA affects metabolism by comparing how the temperature coefficient Q10values of these reactions change
under different CO2levels. For larval-specific O2 consumption,
Q10 values ranged from 1.26 to 3.89 (Table 4). When O2
consumption was normalized with protein content, Q10 values
remained under 2 except for larvae released on Day 11. Regardless of the standardization type, Q10 values varied
considerably among lunar days. On some days, High-pCO2
increased the thermal sensitivities of oxygen consumption rates; on others, it depressed their temperature dependencies (Table 4). For CS activity, larval-specific Q10s ranged from 0.44 to 1.80 (Table 4).
Protein-specific Q10s fell under 1.0 except for larvae released on
Day 11. Again, Q10values as well as the directional effect of pCO2
on Q10varied among days (Table 4).
Natural Variability in pH and Temperature Proximal to the Natal Reef
Data for the present-day environmental exposures for coral larvae released on a Moorea fringing reef were measured using a SeaFET sensor near the coral collection site. Two key observations were made: (1) pH varied with a diel pattern, and (2) the delta pH (maxima minus minima) was 0.110 pH units. Throughout the 50-day deployment (data from 36 50-days shown here), pH and temperature fluctuated consistently through time with both parameters oscillating on a diel cycle with minima and maxima reached once every 24 hours (Fig. 4). pH values between 8.019 and 8.129 were recorded, with a mean value of 8.075 (Table 5). With regard to the nature of the diel pattern, pH maxima occurred on average around 06:14 UTC (20:14 local time), almost two hours after sunset, and pH minima occurred on average around 20:59 UTC (10:59 local time), almost five hours after sunrise. Temperature oscillated on a 24-hour period between 27.04uC and 28.62uC, averaging 27.73uC (Fig. 4A; Table 5). Daily minima and maxima occurred at approximately 14:00 and 02:00 UTC (04:00 and 16:00 local time), respectively. Fluctuations in pH lagged Table 2.Analysis of oxygen consumption rates forP. damicornislarvae among treatments, standardized to number of larvae (nmol larva21min21) and to total protein (pmolmg protein21min21).
Dependent variable Effect X2 Degrees of Freedom p
Larval-specific pCO2 6.662 1 0.0098
oxygen consumption T 51.863 1 ,0.0001
(nmol larva21min21) Day 54.140 2 ,0.0001
Protein-specific pCO2 0.0879 1 0.7669
oxygen consumption T 5.1395 1 0.0234
(pmolmg protein21min21) Day 18.2335 2 0.0001
T x Day 5.3787 2 0.0679
Total protein pCO2 4.186 1 0.0408
(mg larva21) T 2.469 1 0.1161
Day 20.110 2 ,0.0001
Comparisons were made using a three-way ANOVA with pCO2, temperature (T) and day of release (Day) as fixed effects. Interaction terms that were removed from the
behind those in temperature by 4–7 hours. Temperature fluctuated according to the photoperiod with coldest temperatures occurring two hours before dawn and warmest temperatures occurring two hours before sunset.
Despite measurable changes in seawater chemistry associated with daily fluctuations, aragonite saturation states remained adequate for coral calcification (Varag.3.5 [88]). pCO2fluctuated
between 319 and 437matm with an average of 374matm (Table 5). At this site, changes in AT are most likely due to freshwater
influence following precipitation runoff from land. After a rain event, salinity at this site can decline up to 1 ppt, while ATcan fall
by 50mmol kg seawater21 (E. Rivest, unpublished data). Variations in salinity and AT alter the calculated pCO2 by
approximately 5–10matm for the range of pH recorded at this site. Similarly, uncertainties forVaragandVcalcare,0.06 and,0.04,
respectively. We can interpret the descriptive statistics shown in Table 5 with this uncertainty in mind, but the diel oscillation in pH remains distinct.
Discussion
To assess metabolic plasticity during early dispersal ofPocillopora damicornis larvae, we performed laboratory experiments whose treatment conditions were determined based on environmental extremes recorded at the collection site. These microcosm experiments tested effects of future projected ocean conditions. As indicators of performance under conditions of OA and warming, we used oxygen consumption and citrate synthase activity. Our results indicate thatP. damicornislarvae differ in their sensitivity to environmental change with respect to the day their cohort was released from adult colonies.
Metabolic Status under Multiple Stressors
In general, high pCO2 did not increase, but decreased, the
demands of aerobic metabolism inP. damicornis larvae (Fig. 2A). Specifically, for the early release larvae on Days 9 and 10, changes in O2 consumption were smaller, while on Day 11, larvae
exhibited more distinct signs of metabolic depression under high pCO2, high temperature conditions. With our small sample size of
6, the differences could be due to variation in the size of individuals in the treatments due to chance. Contrasting the results obtained for pCO2 levels, temperature had a more consistent
effect on larval oxygen consumption (Fig. 2A). Higher respiration rates at 30.6uC were expected, as body temperature (i.e.ambient temperature for coral larvae) and whole-organism metabolic rate are highly correlated [89] via the kinetics of biochemical reactions. Despite the increased demand for energy that concurrent elevated temperature and pCO2likely imposed, the effects of these stressors
- a direct effect on molecular kinetics and an increased cost of maintenance within larval energy budgets - were in general additive, with temperature having a consistently larger effect on aerobic metabolism.
High pCO2 in the marine environment likely increases the
maintenance costs of acid-base homeostasis, the intracellular ion balance required for protein folding and pH-sensitive physiological processes. Near-equivalent oxygen consumption rates under different pCO2 conditions suggest that peak-release larvae may
be able to use existing pools of ion pumps to conserve acid-base homeostasis under acute stress [51,90,91]. However, late-release larvae may not have the capacity to buffer against the physiological demands of a simultaneously warm and acidic environment, minimizing energy requirements as a result to reduce rates of ATP synthesis. Low metabolic rates in response to OA and hypercapnia have been recorded for several taxa including sipunculid worms [92], adult and juvenile bivalves [93], jumbo squid [94], tropical fish [95], and brooded and non-brooded coral larvae [59,60]. Other groups [96–98] appear to be resilient to elevated pCO2conditions. Overall, metabolic
depres-sion in response to anthropogenic ocean change could have severe consequences for these late-release larvae; if it affects their abilities to navigate the water column, then larval dispersal, settlement success, and fitness may be impaired.
While larval-specific oxygen consumption values recorded here fell within the range published for P. damicornis larvae (e.g. [46,48,62,63,77]), other studies on P. damicornis larvae have reported different results for responses to elevated pCO2 and
temperature levels. In March 2010 and 2012 with a population of P. damicornisin Taiwan, Cumbo et al.[48] found that for larvae released on four consecutive days, day6temperature and day x pCO2 x temperature had significant effects on respiration per
larva. The main effect of CO2on oxygen consumption was
non-significant to negative, while elevated temperature stimulated aerobic metabolism. In contrast, a study with this same population
Figure 3. Citrate synthase activity of Pocillopora damicornis
larvae over 6-hour exposures to pCO2and temperature.Mean
6 SE (n= 6) rates of citrate synthase (CS) activity standardized by number of larvae for those released on Days 9–11 (A) and standardized by animal protein content for larvae released on Days 9–11 (B). Refer to Table 3 for statistical details. Symbols are offset to improve clarity: Low-pCO2at 450matm (circles), High-pCO2at 950matm (triangles), 27.8uC
(blue), and 30.6uC (red).
conducted at the same time found no effect of pCO2 and a
negative effect of temperature on larval respiration [63]. Following longer exposure times (1–5 days), Cumbo et al.[62] found that temperature, but not pCO2 affected mass-specific oxygen
consumption in P. damicornis larvae from Taiwan. Interestingly, in that study, decreased oxygen consumption rates were observed in HTHC treatments for larvae at 5 days of incubation but not before. These studies differ from ours in terms of pCO2exposures
used, length of exposures, and biogeographic locations of coral collection (Table 6). Additionally, these studies did not document in high frequency the current environmental conditions at the collection site of their study organisms, so the interpretation of their results without knowledge of the relationship between
experimental and environmental conditions is challenging. Con-sequently, direct comparisons of the datasets are difficult. Considering the studies together, however, highlights important differences between the larvae used here from corals in Moorea (which appear to be more sensitive to pCO2) and those from a
genetically distinct Taiwan population [64] that experiences significantly different seawater carbonate chemistry (EB Rivest, unpublished data).
While larval-specific metabolism given as a rate per individual imparts ecological function, normalization to protein accounts for variation in mass between larvae. The effect of pCO2disappeared
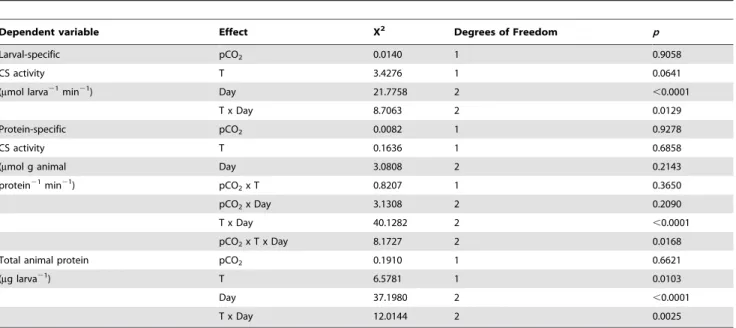
when oxygen consumption rates were standardized by total protein content (Fig. 2B). Lower protein content of larvae Table 3.Analysis of citrate synthase (CS) activity forP. damicornislarvae among treatments, standardized to number of larvae (mmol larva21min21) and to animal protein content (mmol g animal protein21min21).
Dependent variable Effect X2 Degrees of Freedom p
Larval-specific pCO2 0.0140 1 0.9058
CS activity T 3.4276 1 0.0641
(mmol larva21min21) Day 21.7758 2 ,0.0001
T x Day 8.7063 2 0.0129
Protein-specific pCO2 0.0082 1 0.9278
CS activity T 0.1636 1 0.6858
(mmol g animal Day 3.0808 2 0.2143
protein21min21) pCO
2x T 0.8207 1 0.3650
pCO2x Day 3.1308 2 0.2090
T x Day 40.1282 2 ,0.0001
pCO2x T x Day 8.1727 2 0.0168
Total animal protein pCO2 0.1910 1 0.6621
(mg larva21) T 6.5781 1 0.0103
Day 37.1980 2 ,0.0001
T x Day 12.0144 2 0.0025
Comparisons were made using a three-way ANOVA with pCO2, temperature (T) and day of release (Day) as fixed effects. Interaction terms that were removed from the
model are not shown here. doi:10.1371/journal.pone.0096172.t003
Table 4.Q10values for rates of O2consumption and citrate synthase activity ofP. damicornislarvae incubated for six hours in seawater at different temperature and CO2levels.
Dependent variable Batch of Larvae Q10at Low-CO2 Q10at High-CO2 Delta Q10
Larval-specific Day 9 2.38 3.37 0.98
O2consumption Day 10 1.26 2.59 1.33
Day 11 3.89 2.83 21.06
Protein-specific Day 9 1.98 1.52 20.45
O2consumption Day 10 1.37 1.10 20.26
Day 11 3.70 3.81 0.11
Larval-specific Day 9 1.39 1.80 0.41
CS activity Day 10 1.07 0.82 20.25
Day 11 0.44 0.97 0.52
Protein-specific Day 9 0.95 0.74 20.21
CS activity Day 10 1.51 1.59 0.08
Day 11 0.38 0.75 0.36
incubated at High-pCO2, due to slower growth or
down-regulation of thermotolerance pathways, could have removed the larval-specific effect of pCO2. Other factors could generate
these respiration rates: differences in the composition of equal-sized protein pools between treatments, variation in volume of the larvae with respect to the size of the protein pool, differences in holobiont cell number, and differences inSymbiodiniumdensity.
In this study, CS, a rate-limiting enzyme in the Krebs cycle, was used as a biochemical indicator for changes in metabolic function, notably mitochondrial density [87]. This methodological approach is commonly used to assess the impacts of environmental
parameters and ontogeny on the metabolism of marine organisms (e.g.[99–105]); we used this enzyme assay to examine the effects of OA and temperature on the oxidative capacity of P. damicornis larvae. While O2consumption was measured for the entire larva,
oxidative capacity was measured for the animal compartment only.
Temperature and pCO2did not dramatically affect larval- and
protein-specific CS activity, though CS activity became suppressed at high temperature across days, particularly for late-release larvae (Fig. 3A,B). These data contrast those for O2consumption, which
generally show elevated rates of aerobic metabolism at higher
Figure 4. Time series of temperature and pH at a fringing reef in Moorea, French Polynesia.During the month prior to larval release, environmental temperature (A) and pH (C) oscillated on a 24-hour period. A three-day window, March 13–15, 2011, corresponds to ambient temperature (B) and pH (D) conditions adjacent to the natal reef of the larvae used in manipulative experiments on those days. Temperatures represent averages from duplicate thermisters, processed by a one-hour low-pass filter. pH data from a SeaFET sensor were processed by a one-hour low-pass filter.
doi:10.1371/journal.pone.0096172.g004
Table 5.Summary of oceanographic conditions on a fringing reef in Moorea, French Polynesia from February 12– March 19, 2011 (UTC).
Summary Statistics Temperature (6C) pH Varag Vcalc pCO2(matm)
n 25841 5169 5169 5169 5169
Mean 27.730 8.075 4.022 6.049 374.27
SD 0.376 0.0229 0.155 0.232 24.86
Range 1.578 0.110 0.698 1.049 117.89
Max 28.620 8.129 4.378 6.587 437.33
Min 27.042 8.019 3.680 5.538 319.44
25% 27.421 8.058 3.903 5.871 354.32
75% 28.048 8.093 4.147 6.238 392.44
Temperatures were recorded by duplicate thermisters. pH (in total scale) was recorded by a SeaFET. Salinity and ATwere measured from a discrete seawater sample
Study Location
Species,
Reproductive mode Day of release
Treatment conditions
Length of exposure
O2consumption
(nmol O2larva21min21)
Effect of pCO2
Effect of T
Effect of
Day Interaction(s)
Cumboet al.
(2013) [48]
Taiwan Pocillopora damicornis,
brooder
Near peak-release (4 days)
25, 29uC; 400, 750matm pCO2
1 d 0.068–0.262 Mostly NS, but
few
-Mostly
+
Yes T x Day,
CO2x T x Day
Cumboet al.
(2013) [62]
Taiwan P. damicornis, brooder Peak-release only
(1 day)
24, 31uC; 488, 851matm pCO2{
1–5 d 0.077–0.188{
NS + N/A T x Incubation
time
Putnamet al.
(2013) [63]
Taiwan P. damicornis, brooder Near peak-release
(1 day)
24, 29uC 415, 635matm pCO2
9 d 0.035–0.129 NS – N/A NS
This study Moorea, French Polynesia P. damicornis, brooder Peak-release and after
(3 days)
28, 30uC 450, 950matm pCO2
0.25 d 0.083–0.139 - + Yes NS
Nakamuraet al.
(2011) [60]
Sesoko Island, Okinawa Island, Japan
Acropora digitifera, BS N/A 26uC; 350, 1400, 2500matm pCO2
3, 7 d 0.002–0.005 NS, - N/A N/A N/A
Albright and Langdon (2011) [59]
Summerland Key, Florida, USA
Porites astreoides, BS N/A 26uC; 380, 560, 800matm pCO2
1–2 d 0.015–0.033 2 N/A N/A N/A
This table highlights comparisons of study location, study species (BS = broadcast spawner), release days of larvae used, duration of incubations (d = days), treatment conditions, metabolic rates, and presence/directionality of main effects and interactions (NS = not significant).{
Units have been converted to match other studies. doi:10.1371/journal.pone.0096172.t006
Metabolism
of
Coral
Larvae
under
Future
Conditions
ONE
|
www.ploson
e.org
10
April
2014
|
Volume
9
|
Issue
4
|
temperatures and depressed rates at high pCO2. While the O2
consumption measurements represent the average respiration rate across the 6-hour exposure period, CS activity was a snapshot of oxidative capacity at the end of the incubation (t = 6 hours). Our O2 consumption measurements likely captured the peak in
respiration rates while larvae were actively swimming but averaged out any variation due to developmental changes. Though all individuals used remained in the larval stage throughout the exposure, high temperatures do decrease time to metamorphosis in brooded larvae (e.g.[50]). As a result, minute developmental and behavioral changes as larvae progressed towards non-motile states could have generated the lower rates of CS activity found in larvae incubated at 30.6uC [36,105,106]. However, our interpretation is limited because the oxidative capacity ofSymbiodinium within the larvae was not assessed. High densities of mitochondria in the Symbiodinium fraction at 30.6uC could have caused the effect differences between O2 consumption and CS activities. CS
activities measured here were lower than those published for adult coral (0.0007–0.041 units mg protein21 [99,101]), whose stage-specific processes like calcification may demand higher respiration rates. Lower densities of mitochondria during larval development as well as lower surface area to volume ratios may contribute to the differences between life history stages (e.g. [102,107,108]).
An excellent proxy for the short-term metabolic responses of coral larvae, CS activity correlates well with oxidative capacity required to satisfy routine and maximal energy demands (e.g. [87,109]). As measured by CS activity, larval oxidative capacity did not increase in response to elevated temperature or pCO2.
Thus, increased demands for respiration during the short experimental exposures were likely met by an increase in the energy production of the existing pool of mitochondria through metabolic regulation of enzymes rather than de novo synthesis of new enzymes. Furthermore, the lack of increase in oxidative capacity at elevated temperatures despite greater flux of aerobic machinery suggests that P. damicornis larvae may be unable to tolerate additional stresses like OA on their energy budget. Energy demands to maintain homeostasis under higher pCO2 (.
1000matm) may approach or surpass the ceiling of oxidative
capacity, triggering metabolic suppression. However, following longer exposures (days to weeks), the sustained increase in energy demand imposed by acidity and warming may elicit mitochondrial biosynthesis as a compensatory response.
In this study, Q10 values for larval-specific rates of O2
consumption generally fell within the common range for chemical reaction rates (2–3;e.g.[81]). Notably, aerobic respiration in other brooded coral larvae (Porites astreoides) had Q10 values close to 2
[50]. Indicated by Q10,2, protein-specific metabolic rates were
less sensitive to changes in temperature for larvae released on Day 9 and 10. For larvae released on Day 11, protein-specific O2
consumption rates were hypersensitive to temperature change, as shown by Q10.3. Oxidative capacity (i.e.maximum activity of CS)
on all days was temperature-independent or had negative temperature dependence, with Q10,2 and often 1. These low
Q10values indicate immediate temperature compensation; many
poikilotherms exhibit compensation to acute fluctuations in temperature over a portion of their natural environmental temperature range [110]. The Q10patterns shown here indicate
that specific components of the metabolic machinery are less sensitive to changes in temperature, but this toxicity or compen-sation is not detectable at the whole-organism level following acute exposures.
Rates of O2consumption and CS activity ofP. damicornislarvae
are affected by pCO2, but not consistently, as shown by the change
in sign ofDQ10between days (Table 4). The absence of dramatic
changes in Q10 values as pCO2increased indicates resistance or
compensation to OA that is not revealed by biological responses of O2consumption and CS activity. In general, larvae seem to be
able to preserve a homeostatic level of energy metabolism under the treatment conditions, though not through the metrics that we quantified. Still, high CO2levels may reduce performance of coral
larvae, especially at the edges of their thermal envelope where larvae may be spending more of their energy metabolism on maintenance rather than growth or development [111]. Variable compressions or shifts in thermal tolerance windows ofP. damicornis larvae between days could explain the Q10values calculated [111].
Elevated pCO2could compress the thermal envelope, resulting in
lower maximum reaction rates and a narrower range of functional capacity. Alternatively, elevated pCO2 could shift the thermal
envelope to a lower range of temperatures, decreasing the temperature for optimum functional performance.
Variation in Physiological Plasticity among Larval Cohorts Our results indicate that there are differences in larval sensitivity to environmental change between three cohorts that were released from adult colonies at different times. This work, along with similar studies, reveals that larvae released on different days throughout the spawning period respond differently to changes in seawater temperature and acidity (e.g.[49]). Larvae ofP. damicornis and other brooding corals are known to differ by size,Symbiodinium density, and photophysiology throughout the spawning period ([47,49,50,112]; EB Rivest, unpublished data). As larvae are stacked within coral polyps during pre-release development, variation in microenvironment by tissue depth may promote these physiological differences [113,114]. Depending on development time within the maternal coral polyp, larvae may have different endowments of maternalSymbiodiniumand lipid that consequently affect physiological performance. Variation in larval traits could also be a function of genotype. Due to low release numbers, genotype ratios within the larval pool were not consistent between days; however, our observations still reflect variation in biological response at the population level. Additionally, differences in larval physiology could be related with days in captivity, which was not possible to distinguish from day of release in this experiment. Variation in traits that affect physiological performance may be a product of natural selection – the range of phenotypes represented within larvae released monthly could confer selective advantage under different environmental conditions. Some phenotypes may favor retention of larvae on the natal reef, with physiology optimized for local conditions. Other phenotypes may favor longer dispersals through open-ocean ecosystems with different abiotic pH and temperature regimes.
Natural Variation of Environmental pH and Temperature In order to elucidate the range of environmental conditions of the water mass bathing the fringing reef whereP. damicornisadults were collected, we measured the variability of pH and temperature on the natal coral reef in Moorea. These data were recorded as close to the site where the adult coral colonies were collected as was possible. The conditions experienced by the adult coral collected within 100 m of the sensor location may have varied (e.g. [115]), but our environmental data likely represent the conditions experienced by freshly-released larvae in the plankton. In February-March 2011, the average pCO2 on the study site
middle of this century [70]. The pH and temperature time series recorded during this study confirm that the average values for our experimental treatments of pCO2and temperature were
approx-imations of present-day reef conditions as well as extremes not yet observed within the seawater surrounding the fringing reef at the study site.
A key observation within the data was a 24-hour oscillation of pH (Fig. 4C,D). Larvae released from sunset to sunrise experience the nightly decrease in pH during the first part of their larval duration. The timing of the pH oscillation supports a hypothesis that within 1m of the fringing reef at this location, biological processes (respiration and photosynthesis) are driving the 24-hour pattern in the surrounding seawater. This oscillation may have been larger at the 1–2m collection depth of the adult corals used in this study. The slopes of the daily ascent and descent of pH are slightly different in absolute value and do not reflect a simple turning on and off of the balance between photosynthesis and respiration with the photoperiod. Particularly, the onset of the photosynthesis signal is delayed 5 hours after sunrise, perhaps due to calm weather reducing mixing at this time of day or lower physiological rates at the pH minima.
While fluctuations of temperature and pH are common in coral reefs and other habitats (e.g. [16]), variability in environmental carbonate chemistry recorded at the Moorea site differs slightly from conditions at other coral reefs [17,116–118]. Compared with SeaFET pH time series data from protected reef terraces in the Northern Line islands [17], pH on the Moorea fringing reef had similar amplitudes but a higher mean value (8.075 vs. 7.958– 7.981). Oceanographic features, seawater retention times, and differences in community composition may be responsible for these differences. These and other studies reporting the variability of nearshore pH and in situ biological responses are becoming more common (e.g. [17,116,119–124]) and are refining our understanding of natural variability of pH and carbonate chemistry which has historically come from open-ocean measure-ments (e.g. WOCE, http://woce.nodc.noaa.gov/wdiu; BATS, http://www.bios.edu/research/bats.html; HOTS, http:// hahana.soest.hawaii.edu/hot/hot_jgofs.html).
Implications for the Future of Coral Reefs
The over-arching outcome of this study suggests that only a portion of larvae produced monthly exhibited physiological phenotypes suited for tolerating these levels of high temperature and low pH. Furthermore, biochemical limits for increasing oxidative capacity to satisfy elevated energy demands in a warming, acidifying ocean may ultimately override the advantages offered by current phenotypes, barring acclimation and/or adaptation. If larvae cannot tolerate elevated temperatures and pCO2 levels by upregulating mitochondria biosynthesis to fuel
stress response pathways, their demands for ATP synthesis may soon surpass the capacity of their aerobic machinery. These measured acute responses can inform a bigger picture: given longer exposures to ocean warming, acidity, and other concurrent stressors, even over multiple generations, do corals have the potential to acclimate to changing carbonate chemistries, thereby avoiding a narrowing of their thermal tolerance windows? Population-specific functional traits, such as the ones quantified here, can predict shifts in species’ ranges and phenologies in response to global climate change [125].
Comparisons between coral populations on reefs with different carbonate chemistry conditions (e.g.Moorea, French Polynesia and Nanwan Bay, Taiwan) may provide clues as to how physiological plasticity can be shaped by environmental variability and whether local adaptation to temperature and pH regimes buffers
sensitiv-ities to OA and rising temperature. Local adaptation in coral dinoflagellate endosymbionts has already been documented, and thermotolerant Symbiodinium groups may be able to enhance the tolerance and fitness of their coral host [12,126]. Furthermore, on a global scale, there is a high degree of spatial variability in the intensity of multiple stressors for coral reefs [127,128]. Acclima-tization or local adaptation along this gradient of stress may maintain populations with suitable phenotypes for future ocean conditions. Estimates of physiological plasticity as well as contextual frameworks for variability of environmental conditions present potentially robust tools for marine conservation, allowing us to predict the influence of anthropogenic stressors on larval fitness, dispersal, and recruitment success and to manage local populations within a global context.
Supporting Information
File S1 Optimization of number ofP. damicornislarvae per vial for measurements of oxygen consumption rates under pCO2and temperature treatments.
(DOC)
File S2 Optimization of reagent concentrations for quantification of citrate synthase activity inP. damicor-nis larvae incubated in pCO2 and temperature treat-ments.
(DOC)
File S3 Comparisons of temperature and seawater chemistry conditions in experimental aquaria and vials during the experiment.
(DOC)
File S4 Protein concentrations ofP. damicornis larvae following 6-hour exposures to combinations of pCO2and temperature. Mean 6 SE concentrations of total holobiont protein for larvae used to measure rates of oxygen consumption (n= 6) (A) and total animal protein for larvae used to measure rates of citrate synthase activity (n= 3) (B). Total holobiont protein was higher at Low-pCO2and on Days 10 and 11. Total animal protein
at 30.6uC (vs. 27.8uC) was higher on Day 10 but lower on Day 11. Refer to Tables 2 and 3 for statistical details. Symbols are offset to improve clarity: Low-pCO2at 450matm (circles), High-pCO2at
950matm (triangles), 27.8uC (blue), and 30.6uC (red). Total protein values were used to assess a measure of fitness and to normalize metabolic performance under combinations of control and elevated temperature and pCO2. Total holobiont protein
varied significantly by pCO2and by Day (Table 2), with highest
densities in larvae released on Days 10 and 11 (vs. Day 9; Tukey’s HSD,p,0.0001, 0.0214, respectively). Larvae incubated at High-pCO2 had slightly lower densities of total protein than at
Low-pCO2(Tukey’s HSD;p= 0.0494). Total animal protein responded
differently to changes in temperature depending on day of release (Table 3) and in general was lower in larvae released on Day 9. Main effects of temperature and day were also significant (Table 3). Post-hoc analysis of the significant interaction (T x Day, Table 3) revealed significant effects of temperature on Day 9 (linear contrast with Bonferroni correction;F=22.406,p= 0.0484) and Day 10 (F= 2.319, p= 0.0612), but no difference between temperatures on Day 11. The directionality of the difference in animal protein content between temperature treatments changed across days.
Acknowledgments
We thank Dr. Anderson Mayfield and Lydia Kapsenberg for assistance during experiments and Keith Seydel, Vince Moriarty, Dr. Peter J Edmunds, Aaron Dufault, Chelsea Behymer, and staff at the University of California Berkeley Richard B. Gump South Pacific Research Station for field support. We thank Dr. Stephen Gosnell and Daniel Okamoto for
statistical support. We appreciate feedback on this manuscript from Drs. Peter J. Edmunds, Tyler Evans, and Raul Suarez.
Author Contributions
Conceived and designed the experiments: EBR GEH. Performed the experiments: EBR. Analyzed the data: EBR. Contributed reagents/ materials/analysis tools: EBR GEH. Wrote the paper: EBR GEH.
References
1. Feely RA (2008) Ocean acidification. In: Levinson D, Lawrimore J, editors. State of the Climate in 2007: Bulletin of the American Meteorological Society. S1–S179.
2. Meehl GA, Stocker TF, Collins WD, Friedlingstein P, Gaye AT, et al. (2007) Global climate projections. In: Solomon S, Qin D, Manning M, Chen Z, Marquis M et al., editors. Climate Change 2007: The Physical Science Basis Contribution of Working Group I to the Fourth Assessment Report of the Intergovernmental Panel on Climate Change. Cambridge, United Kingdom and New York, NY USA: Cambridge University Press. 747–845.
3. Feely RA, Doney SC, Cooley SR (2009) Ocean acidification: present conditions and future changes in a high-CO2world. Oceanography 22: 36–47.
4. Fabricius KE, Langdon C, Uthicke S, Humphrey C, Noonan S, et al. (2011) Losers and winners in coral reefs acclimatized to elevated carbon dioxide concentrations. Nat Clim Chang 1: 165–169.
5. Hauri C, Gruber N, Plattner G-K, Alin S, Feely RA, et al. (2009) Ocean acidification in the California Current System. Oceanography 22: 60–71. 6. Kelly M, Hofmann G (2012) Adaptation and the physiology of ocean
acidification. Funct Ecol 27: 980–990.
7. Pandolfi JM, Connolly SR, Marshall DJ, Cohen AL (2011) Projecting coral reef futures under global warming and ocean acidification. Science 333: 418–422. 8. Waldbusser GG, Voigt EP, Bergschneider H, Green MA, Newell RI (2011) Biocalcification in the eastern oyster (Crassostrea virginica) in relation to long-term trends in Chesapeake Bay pH. Estuaries Coast 34: 221–231.
9. Yu PC, Matson PG, Martz TR, Hofmann GE (2011) The ocean acidification seascape and its relationship to the performance of calcifying marine invertebrates: laboratory experiments on the development of urchin larvae framed by environmentally-relevant pCO2/pH. J Exp Mar Biol Ecol 400: 288–
295.
10. Jokiel PL, Coles SL (1990) Response of Hawaiian and other Indo-Pacific reef corals to elevated temperature. Coral Reefs 8: 155–162.
11. Middlebrook R, Hoegh-Guldberg O, Leggat W (2008) The effect of thermal history on the susceptibility of reef-building corals to thermal stress. J Exp Biol 211: 1050–1056.
12. Oliver TA, Palumbi SR (2011) Do fluctuating temperature environments elevate coral thermal tolerance? Coral Reefs 30: 429–440.
13. Martz TR, Connery JG, Johnson KS (2010) Testing the Honeywell Durafet for seawater pH applications. Limnol Oceanogr-Methods 8: 172–184. 14. Boatta F, D’Alessandro W, Gagliano AL, Liotta M, Milazzo M, et al. (2013)
Geochemical survey of Levante Bay, Vulcano Island (Italy), a natural laboratory for the study of ocean acidification. Mar Poll Bull 73: 485–494. 15. Frieder CA, Nam SH, Martz TR, Levin LA (2012) High temporal and spatial
variability of dissolved oxygen and pH in a nearshore California kelp forest. Biogeosciences 9: 3917–3930.
16. Hofmann GE, Smith JE, Johnson KS, Send U, Levin LA, et al. (2011) High-frequency dynamics of ocean pH: a multi-ecosystem comparison. PLoS One 6: e28983.
17. Price NN, Martz TR, Brainard RE, Smith JE (2012) Diel variability in seawater pH relates to calcification and benthic community structure on coral reefs. PLoS One 7: e43843.
18. Byrne M (2011) Impace of ocean warming and ocean acidification on marine invertebrate life history stages: vulnerabilities and potential for persistence in a changing ocean. Oceanogr Mar Biol 49: 1–42.
19. Hendriks IE, Duarte CM, Alvarez M (2010) Vulnerability of marine biodiversity to ocean acidification: a meta-analysis. Estuar Coast Shelf Sci 86: 157–164.
20. Hofmann GE, Barry JP, Edmunds PJ, Gates RD, Hutchins DA, et al. (2010) The effect of ocean acidification on calcifying organisms in marine ecosystems: an organism-to-ecosystem perspective. Annu Rev Ecol Evol Syst 41: 127–147. 21. Kroeker KJ, Kordas RL, Crim RN, Singh GG (2010) Meta-analysis reveals negative yet variable effects of ocean acidification on marine organisms. Ecol Lett 13: 1419–1434.
22. Somero GN (2010) The physiology of climate change: how potentials for acclimatization and genetic adaptation will determine ’winners’ and ’losers’. J Exp Biol 213: 912–920.
23. Sunday JM, Bates AE, Dulvy NK (2012) Thermal tolerance and the global redistribution of animals. Nat Clim Chang 2: 686–690.
24. Hofmann GE, Todgham AE (2010) Living in the now: physiological mechanisms to tolerate a rapidly changing environment. Annu Rev Physiol. 72: 127–145.
25. Lannig G, Eilers S, Poertner HO, Sokolova IM, Bock C (2010) Impact of ocean acidification on energy metabolism of oyster,Crassostrea gigas: changes in metabolic pathways and thermal response. Marine Drugs 8: 2318–2339. 26. Po¨rtner HO (2008) Ecosystem effects of ocean acidification in times of ocean
warming: a physiologist’s view. Mar Ecol Progr Ser 373: 203–217. 27. Walther K, Sartoris FJ, Bock C, Po¨rtner HO (2009) Impact of anthropogenic
ocean acidification on thermal tolerance of the spider crabHyas araneus. Biogeosciences 6: 2207–2215.
28. O’Donnell M, Hammond L, Hofmann G (2009) Predicted impact of ocean acidification on a marine invertebrate: elevated CO2alters response to thermal
stress in sea urchin larvae. Mar Biol 156: 439–446.
29. Parker LM, Ross PM, O’Connor WA (2010) Comparing the effect of elevated pCO2and temperature on the fertilization and early development of two
species of oysters. Mar Biol 157: 2435–2452.
30. Parker LM, Ross PM, O’Connor WA (2009) The effect of ocean acidification and temperature on the fertilization and embryonic development of the Sydney rock oysterSaccostrea glomerata(Gould 1850). Glob Chang Biol 15: 2123–2136. 31. Sheppard Brennand H, Soars N, Dworjanyn SA, Davis AR, Byrne M (2010) Impact of ocean warming and ocean acidification on larval development and calcification in the sea urchinTripneustes gratilla. PLoS One 5: e11372. 32. Walther K, Anger K, Po¨rtner HO (2010) Effects of ocean acidification and
warming on the larval development of the spider crabHyas araneus from different latitudes (54 degrees vs. 79 degrees N). Mar Ecol Progr Ser 417: 159– 170.
33. Hofmann GE, Blanchette CA, Rivest EB, Kapsenberg L (2013) Taking the pulse of marine ecosystems: the importance of coupling long-term physical and biological observations in the context of global change biology. Oceanography 26: 140–148.
34. Hoegh-Guldberg O (1999) Climate change, coral bleaching and the future of the world’s coral reefs. Mar Freshwater Res 50: 839–866.
35. Anthony KRN, Kline DI, Diaz-Pulido G, Dove S, Hoegh-Guldberg O (2008) Ocean acidification causes bleaching and productivity loss in coral reef builders. P Natl A Sci USA 105: 17442–17446.
36. Okubo N, Yamamoto HH, Nakaya F, Okaji K (2008) Oxygen consumption of a single embryo/planula in the reef-building coralAcropora intermedia. Mar Ecol Progr Ser 366: 305–309.
37. Veron J (2000) Corals of the World. Townsville, Australia: Australian Institute of Marine Science and CCR Qld Pty Ltd.
38. Fan TY, Li JJ, Ie SX, Fang LS (2002) Lunar periodicity of larval release by pocilloporid corals in southern Taiwan. Zool Stud 41: 288–294.
39. Harriott VJ (1983) Reproductive seasonality, settlement, and post-settlement mortality ofPocillopora damicornis(Linnaeus), at Lizard Island, Great Barrier Reef. Coral Reefs 2: 151–157.
40. Richmond RH, Jokiel PL (1984) Lunar periodicity in larva release in the reef coralPocillopora damicornisat Enewetak and Hawaii. Bull Marine Sci 34: 280– 287.
41. Harrison P, Wallace C (1990) Reproduction, dispersal and recruitment of scleractinian corals. In: Dubinsky Z, editor. Ecosystems of the world, vol 25: coral reefs. New York: Elsevier. 133–207.
42. Richmond R (1981) Energetic consideration in the dispersal ofPocillopora damicornis(Linnaeus) planulae. Proceedings of the 4thInternational Coral Reef Symposium 2: 153–156.
43. Harii S, Yamamoto M, Hoegh-Guldberg O (2010) The relative contribution of dinoflagellate photosynthesis and stored lipids to the survivorship of symbiotic larvae of the reef-building corals. Mar Biol 157: 1215–1224.
44. Adjeroud M, Guerecheau A, Vidal-Dupiol J, Flot J-F, Arnaud-Haond S, et al. (2014) Genetic diversity, clonality and connectivity in the scleractinian coral
Pocillopora damicornis: a multi-scale analysis in an insular, fragmented reef system. Mar Biol 161: 531–541.
45. Torda G, Lundgren P, Willis BL, Van Oppen MJH (2013) Genetic assignment of recruits reveals short- and long-distance larval dispersal in Pocillopora damicornison the Great Barrier Reef. Mol Ecol 22: 5821–5834.
46. Richmond RH (1987) Energetics, competence, and long-distance dispersal of planula larvae of the coralPocillopora damicornis. Mar Biol 93: 527–533. 47. Cumbo VR, Fan TY, Edmunds PJ (2012) Physiological development of
brooded larvae from two pocilloporid corals in Taiwan. Mar Biol 159: 2853– 2866.
48. Cumbo VR, Edmunds PJ, Wall CB, Fan T-Y (2013) Brooded coral larvae differ in their response to high temperature and elevated pCO2depending on