SNPs at the Promoter under Both Basal and Heat Stress
Conditions
Judit Salces-Ortiz1*, Carmen Gonza´lez1, Natalia Moreno-Sa´nchez1, Jorge H. Calvo2, M. Dolores Pe´rez-Guzma´n3, Magdalena M. Serrano1
1Dpto. Mejora Gene´tica animal. Inst. Nac. Invest. Agrarias y Alimentarias, Madrid, Spain,2ARAID, Zaragoza, Spain,3CERSYRA, Valdepen˜as, Spain
Abstract
The aim of this work was to investigate the association between polymorphisms located at theHSP90AA1 ovine gene promoter and gene expression rate under different environmental conditions, using a mixed model approach. Blood samples from 120 unrelated rams of the Manchega sheep breed were collected at three time points differing in environmental conditions. Rams were selected on the basis of their genotype for the transversion G/C located 660 base pairs upstream the gene transcription initiation site. Animals were also genotyped for another set of 6 SNPs located at the gene promoter. Two SNPs, G/C2660and A/G2444, were associated with gene overexpression resulting from heat stress. The
composed genotype CC2660-AG2444was the genotype having the highest expression rates with fold changes ranging from
2.2 to 3.0. The genotype AG2522showed the highest expression levels under control conditions with a fold change of 1.4.
Under these conditions, the composed genotype CC2601-TT2524-AG2522-TT2468is expected to be correlated with higher
basal expression of the gene according to genotype frequencies and linkage disequilibrium values. Some putative transcription factors were predicted for binding sites where the SNPs considered are located. Since the expression rate of the gene under alternative environmental conditions seems to depend on the composed genotype of several SNPs located at its promoter, a cooperative regulation of the transcription of theHSP90AA1gene could be hypothesized. Nevertheless epigenetic regulation mechanisms cannot be discarded.
Citation:Salces-Ortiz J, Gonza´lez C, Moreno-Sa´nchez N, Calvo JH, Pe´rez-Guzma´n MD, et al. (2013) OvineHSP90AA1Expression Rate Is Affected by Several SNPs at
the Promoter under Both Basal and Heat Stress Conditions. PLoS ONE 8(6): e66641. doi:10.1371/journal.pone.0066641
Editor:Vladimir N. Uversky, University of South Florida College of Medicine, United States of America
ReceivedFebruary 25, 2013;AcceptedMay 8, 2013;PublishedJune 24, 2013
Copyright:ß2013 Salces-Ortiz et al. This is an open-access article distributed under the terms of the Creative Commons Attribution License, which permits
unrestricted use, distribution, and reproduction in any medium, provided the original author and source are credited.
Funding:RTA2009-00098-00-00 INIA project (Subprograma de Investigacio´n Fundamental orientada a los Recursos y Tecnologı´as Agrarias) and FEDER (Fondo
Europeo de Desarrollo Regional) funding. The funders had no role in study design, data collection and analysis, decision to publish, or preparation of the manuscript.
Competing Interests:The authors have declared that no competing interests exist.
* E-mail: malena@inia.es
Introduction
Current concern about global warming and its effects over agricultural and livestock production systems have opened novel scientific opportunities to study the adaptation of organisms to new and harsher environmental conditions. In this context, the study of the genetic basis of traits linked with adaptation and fitness has great importance. Heat is one of the main sources of stress which has an important impact in livestock production. The genetic variability underlying animal’s thermo tolerance could be exploit-ed in livestock breexploit-eding programs to achieve animals that could cope with the effects of heat stress over productive and functional traits. Among the livestock animals, sheep (Ovis aries), is one of the oldest domesticated species [1]. It is widely distributed throughout the world due to its high plasticity and adaptability to withstand poor nutrient diets and tolerance to extreme climatic conditions [2], [3]. Sheep is thus an interesting biological material to study the genetic basis of thermo-tolerance. There is some literature about heat stress effects over physiological and productive traits in cattle [4], [5], [6] and sheep [7], [8], [9], [10]. Also, at the molecular level, genes involved in the heat stress response have been described [11], [12], [13], [14]. Among them, those encoding
heat shock proteins have been the most studied. However, in sheep there are few works regarding this topic.
Heat shock proteins (HSPs) [15], play a fundamental role in the maintenance of cellular homeostasis, under both physiological and stress conditions [16]. HSPs are organized into several families according to their molecular size (kDa). HSPs are highly conserved across species [17], particularly the 90 kDa heat shock protein (HSP90) [18]. In eukaryotes there are two major isoforms of HSP90 constituted by gene duplication [19]: the inducible form, HSP90a and the constitutive form, HSP90b. The HSP90AA1
HSP90AA1gene, being either the causal mutation which putatively modifies a transcription factor binding site or in linkage disequilibrium with the causal mutation. However, the study was based on a limited number of animals and on standard basic statistical methods used to analyze quantitative real-time PCR (qPCR) data and to asses differences in expression levels of alternative genotypes under control and heat stress conditions.
In general, qPCR has provided a powerful tool for quantifying gene expression. Nevertheless, it makes necessary to carefully consider some technical and analytical factors to ensure repro-ducible and accurate measurements and not lead to misinterpre-tations [25]. However, commonly, several of these essential procedures have been widely ignored. Those technical factors include the initial sample amount, RNA recovery and RNA purity and integrity [26], [27] among others. Some factors considered as analytical are the selection of the suitable housekeeping gene(s) (HK), the experimental design [28], the statistical method used, etc.
Traditional statistical analyses have been restricted to pair-wise comparisons of treatments in which Cq (quantification cycle) values of GOIs (genes of interest) were previously normalized using standard HKs. This kind of approach does not allow to include technical and biological effects having influence over gene expression data. The joint analysis of GOIs and HKs data can lead to a better partition of such sources of variation [29] and allows checking HK stability and subsequent normalization of GOIs. Mixed model methodology makes possible this kind of approach, giving the possibility of including systematic and random effects, and interactions among them. They constitute a powerful tool in qPCR analyses including more than two treatments and multiple experimental factors [30], [31].
The objectives of this study were to 1) confirm gene expression differences observed for alternative genotypes of the G/C2660 transversion of theHSP90AA1gene promoter using more animals and a wider range of climatic conditions that those in [12]; 2) study the effect over the expression levels of another six polymorphisms (A/C2601, G/A2528, G/T2524, A/G2522, G/T2468 and A/ G2444) selected on the basis of their population genotype frequencies (Table S1) and relative position regarding SNP G/ C2660; and 3) to simultaneously select the best HK and analyze expression data using a mixed model statistical approach that includes technical and biological sources of variation.
Materials and Methods
Ethics Statement
The current study was carried out under a Project License from the INIA Scientific Ethic Committee. Animal manipulations were performed according to the Spanish Policy for Animal Protection RD 53/2013, which meets the European Union Directive 86/609 about the protection of animals used in experimentation. We hereby confirm that the INIA Scientific Ethic Committee, which is the named IACUC for the INIA, specifically approved this study. Animals belong to an artificial insemination centre, were raised in small groups in different barns and fed according to their necessities.
Linkage Disequilibrium Analysis and Haplotype Determination
Animal material, nucleic acid isolation, DNA amplification and SNPs genotyping. Peripheral whole blood samples were collected from 103 animals of the Manchega Spanish sheep breed in order to analyse linkage disequilibrium among the 7 SNPs of interest located at theHSP90AA1promoter.
Animals were grouped in 48 parent-offspring trios. Trios consist of 10 sires, 48 dams and 1 offspring per pair (all females). Three of the dams were also daughters from another trio. Genomic DNA was extracted from lymphocytes according to the salting out procedure [32]. The polymerase chain reaction was performed from 100 ng of genomic DNA using CERTAMP complex amplifications kit chemistry (Biotools, Madrid, Spain) with specific primers (Forward: 59CGAGGCTCTGGCAGGCACTTGTTG39
and Reverse: 59 GCCGCCGTTCCCA GCCCTACCT 39). A 499 bp fragment of the promoter containing SNP2660and 6 more SNPs (2601, 2528,2524,2522, 2468,2444) was obtained. The resulting PCR fragment was purified with ExoSAP-IT (USB Corporation, OH, USA) and sequenced with specific primers (shown above).
Linkage disequilibrium estimation. PLINK software [33] was used to estimate linkage disequilibrium among all pairs of the 7 SNPs measured as r2, the squared correlation based on genotypic allele counts [34]. Hardy-Weinberg equilibrium exact test and observed and expected heterozygosities for each SNP were also calculated using PLINK.
Detection of Putative Transcription Factor (TF) Binding Sites in OvineHSP90AA1Promoter
Putative TF binding sites were predicted using TESS [35] (keeping default settings) and ALGGEN-PROMO [36], [37] (limiting to mammal transcription factors) softwares.
Expression Analysis
Animal material. In order to confirm the association of the
HSP90AA1 polymorphism (G/C2660) previously associated with the adaptation to different thermal conditions in sheep previously described [24], 428 unrelated rams of Manchega Spanish sheep breed were genotyped (same protocol and primers as described in [24]). All animals belonged to an artificial insemination centre, and therefore they were reared under the same environmental and management conditions. A total of 120 out of 428 rams were selected based on their genotype: 40 CC2660, 40 GC2660and 40 GG2660. Genomic DNA from these 120 animals was used to genotype the previosly defined 499 bp amplicon of theHSP90AA1
promoter. Genotype frequencies are shown in Table 1.
Peripheral whole blood samples from the 120 rams were collected in 3 time points, corresponding to different climatic conditions in a dry region of central Spain (Ciudad Real). The 3 time points were in March, when environmental temperature conditions are mild, and in July and August when heat stress temperatures occur. Hereafter, we will refer to the March collection as the control. The temperature humidity index (THI) equation proposed by Marai et al. [8] was used as another indicator of thermal stress. This index combines both temperature and relative humidity. The enviromental parameters for the 3 points in time are shown in Table 2.
Quantitative reverse transcription polymerase chain reaction (qRT-PCR). qRT-PCR was performed on all samples collected. Three HKs were tested,MDH1,SDHAandHSP90AB1.
MDH1andSDHAbecame the most stable HK pair for the heat stress response in sheep under similar conditions [38]. Also the
HSP90AB1 gene was included as HK candidate since its expression is ubiquitous, less inducible and more constitutive than that of theHSP90AA1gene [39], [40]. Primers were designed with NetPrimer software (Biosoft International, CA, USA), and are listed in Table 3 together with amplicon sizes and CG content. Primers were designed avoiding possible genomic DNA amplifi-cations. In silico specificity of the amplicons was screened by BLAST searches.
qPCR amplification reactions were performed from 100 ng of cDNA using LightCyclerH480 SYBR Green I Master kit (Roche, Switzerland). Reactions were run in triplicate on a LightCyclerH
480 (Roche, Switzerland) following manufacturer’s cycling pa-rameters. Dissociation curves were performed for each gene to check primer specificity and to confirm the presence of a unique PCR product. The corresponding mRNA levels were measured and analyzed by their Cq.
To estimate PCR efficiencies, standard curves based on 6 serial dilutions (1/20 from a departure concentration of 50 ng/ml) of a cDNA stock (a cDNA mixture of more than 121 samples accounting for the 3 genotypes and the 3 time points) were
performed. Efficiencies (E) were calculated from the slope of curves as in Rasmussen and coworkers’ [41]. Estimated E for each gene are shown in Table 3.
Statistical Procedures
Statistical analysis of RIN values. A mixed model was fitted by using the MIXED procedure of the SAS statistical package [42] for determining factors affecting RIN values. RIN value of all samples were included as a dependent variable. Fixed effects included were genotype G/C2660(G) - 3 levels: CC, GC and GG -; date of collection (D) - 3 levels: Control, July and August -; group of sample processing (GP) - 4 levels corresponding to the barn where a group of animals were located and sampled -and the interaction date of collection x group of sample processing (DxGP) were included as fixed effects. The barn needs to be included because it is related to the period of time between samples collection and processing. The animal (A) was included as random effect. Goodness of fit statistics AIC (Akaike’s Information Criterion) and BIC (Schwarz’s Bayesian Criterion) were used as criteria for model selection. A type III fixed effects test was used to determine significance of the effects included in the model.
P,0.05 was established as threshold for statistical significance. HK selection. HK selection amongHSP90AB1, MDH1and
SDHA genes followed the strategy from Serrano et al. [38]. As amplification efficiencies of some genes were ,2 (,100%), Cq
Table 1.Genotype frequencies of the SNPs located at theHSP90AA1promoter in 120 rams of Manchega sheep breed.
SNPs
2660 2601 2528 2524 2522 2468 2444 N Freq.%
CC AC AA GT GG GT GG 2 1.63
CC AC AA TT GG TT GG 1 0.81
CC AC AG GT GG GT GG 1 0.81
CC CC AA GT GG GT GG 1 0.81
CC CC AA TT AG TT GG 3 2.44
CC CC AA TT GG GT GG 1 0.81
CC CC AA TT GG TT AA 1 0.81
CC CC AA TT GG TT AG 1 0.81
CC CC AA TT GG TT GG 26 21.14
CC CC GA TT AG TT GG 2 1.63
CC CC GA TT GG TT GG 2 1.63
CC CC GG TT GG TT GG 1 0.81
GC AC AA GT GG GT GG 1 0.81
GC AC GA GT GG GT GG 4 3.25
GC CC AA TT GG TT AG 1 0.81
GC CC AA TT GG TT GG 2 1.63
GC CC GA GT GG GT GG 1 0.81
GC CC GA TT AG TT GG 5 4.07
GC CC GA TT GG TT GG 21 17.08
GC CC GG TT GG TT GG 4 3.25
GG CC AA TT GG TT AG 1 0.81
GG CC AA TT GG TT GG 1 0.81
GG CC GA TT GG TT AG 2 1.63
GG CC GA TT GG TT GG 9 7.32
GG CC GG TT GG TT GG 29 23.58
data were transformed using the equation proposed by Steibel et al. [29] to rescale Cq values.
The equation of the mixed model used was the following:
yoijkmr~MozTizGjzPkzb(RG)imj
zSimzAmzMTGoijzeoijkmr
ð1Þ
where yoijkmris the transformed Cq data of the jthgene, from the rthwell, in the kthplate, collected from de mthanimal under the ith treatment; Mois the fixed effect of the othgenotype; Tiis the fixed effect of ithtreatment; Gjis the fixed effect of the jthgene; Pkis the effect of the kthplate; b(RG)imnjis the interaction between the RIN value of the mithsample and the jthgene, where b is the regression coefficient of RIN x gene variable on Cq; Simis the random effect of the biological sample(Sim*N(0,s2
s)); Amis the random effect of the animal from where samples were collected(Am*N(0,s2
A));
MTGoijis the random interaction effect among the othgenotype, the ithtreatment and the jthgene(MTGoij*N(0,s2
MTG)); eoijkmris the random residual. Gene specific residual variance (heteroge-neous residual) was fitted to the gene by treatment effect
(eoijkmr*N(0,s2
eij)).
Expression stability values were obtained by calculating the Mean Square Error (MSE), which was defined as in [38].
Analysis of expression results. Statistical analysis of gene expression was carried out following the method proposed by Steibel et al. [29]. As amplification efficiencies for HSP90AA1,
HSP90AB1andMDH1genes were,2, Cq data were transformed as aforementioned. The mixed model fitted was:
yoijkmr~MTGoijzPkzb(RG)imjzSimzAmzeoijkmr ð2Þ
where effects were as in model 1, except that in this case the MTG factor was included in the model as fixed effect and the residual variance was heterogeneous for the gene effect) .
To test differences,diffGOI, in the expression rate of alternative genotypes and to obtain fold change (FC) values from the estimated MTG differences, the approach suggested in [29] was used. Significance ofdiffGOI estimates was determined with thet statistic.
Also asymmetric 95% confidence intervals (up and low) were calculated for each FC value by using the standard error (SE) of
diffGOI:
FCUP~2{(diffGOI{1:96xSE)) ð3Þ
FCLOW~2{(diffGOIz1:96x SE) ð4Þ
Results
Linkage Disequilibrium Analysis
Results from Hardy-Weinberg equilibrium exact test and expected and observed heterozygosities are shown in Table S5. No deviations from the Hardy-Weinberg equilibrium were observed for any of the SNPs genotyped on population composed by trios. The average expected and observed heterozygosities were 0.256 and 0.306, respectively. The SNPs with the lowest allele frequencies were A/G2522 and A/G2444 (0.018 and 0.053, respectively).
Results from linkage disequilibrium analyses are shown in Table S6. The analysis revealed the existence of two blocks of SNPs segregating jointly. One block was constituted by the SNPs at
positions2660 and2528 (r2= 0.95), and the other was integrated by the SNPs mapped at2601,2524 and2468 (r2between them ranged from 0.92 to 1.00). Linkage disequilibrium between other SNP pairs showed values lower than 0.06, ranging from 0.001 to 0.059.
Statistical Analysis of RIN Values
The model including the interaction DxGP as a fixed effect and the animal as a random effect, showed the lowest values for the goodness of fit criteria (AIC and BIC). Estimated animal and residual variance were 0.11 and 2.25, respectively. Type III fixed effects test showed a highly significant (p,0.0001) effect of DxGP on RIN values but no significant effect were observed for G, D and GP on the trait.
Table 3.Primers and efficiencies of the qPCR reactions.
Gene Forward primer (59-39) Reverse primer (59-39)
Amplicon
size (bp) Efficiencies Amplicon % bases and GC content
HSP90AA1 CCACTTGGCGGTCAAGCATT AAGGAGCTCGTCTTGGGACAA
80 1.951 A/22.50 G/25.00 C/31.25 T/21.25 GC content 47.50
MDH1 GGTCAAATTGCATATTCACTACTA ACCATCCAGGACACCCATCAT
117 1.883 A/23.07 G/20.51 C/32.48 T/23.93 GC content 43.58
SDHA GGCATCCCCACCAACTACA TACACCACCTCAAAGCCCCG
134 2.000 A/35.55 G/29.62 C/17.03 T/17.77 GC content 65.17
HSP90AB1 TACATCACTGGTAAGAGCAAAGA TACACCACCTCAAAGCCCCG
81 1.950 A/37.03 G/18.52 C/22.22 T/22.22 GC content 55.55
doi:10.1371/journal.pone.0066641.t003
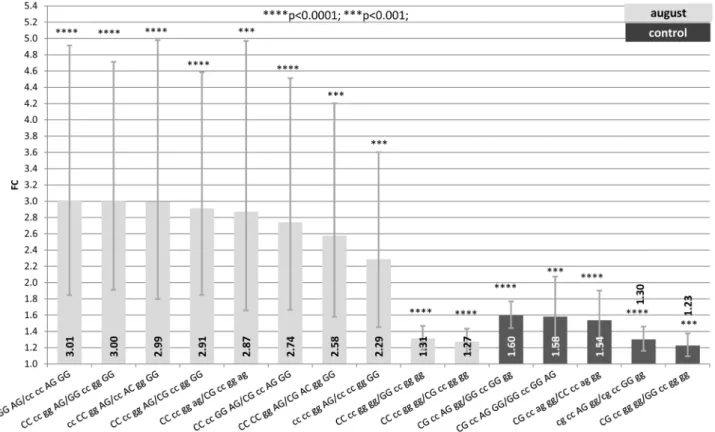
Figure 1. Fold change (FC) for the contrast among alternative genotypes G/C2660-C/A2601-G/A2522-A/G2444 of the HSP90AA1 promoter within each treatment (Control, July and August) normalized byHSP90AB1.Segments indicate the 95% confidence interval
(FCup-FClow). In abscissa the FC, in ordinate genotype contrasts. Asterisk over each bar indicates the significance level of the contrasts.
Thus, as RIN values only depend on the order in which samples were processed after their collection, it can be included as a systematic effect in the statistical model used to analyse expression data.
Best HKs
Given the linkage disequilibrium results for the 7 SNPs, the ‘‘genotype’’ included as an effect in the mixed model to test the stability of genes was G/C2660-A/C2601-A/G2522-A/G2444. Table 4 shows MSE values obtained for each gene within treatments and across genes.HSP90AB1was in all cases the most stable gene, followed by HSP90AA1. Therefore,HSP90AB1 was selected as the only HK to normalize the expression results of
HSP90AA1. The highest stability values for all genes corresponded to samples collected in August and lowest stability values corresponded to the control samples.
Environmental Conditions and Statistical Analysis of Gene Expression
As it is shown in Table 2 the maximum temperatures for days of samples collection in July, 35.0uC, and August, 34.4uC, exceeded the sheep thermoneutral zone, but this is not the case for the average temperatures, 26.8uC and 24.7uC, respectively. For both time points, average and maximum THI values occurred in the zones of severe and extreme heat stress [43]. The THImax was one unit higher in August than in July. Also in August the THImax, calculated over the five days before collection, was two
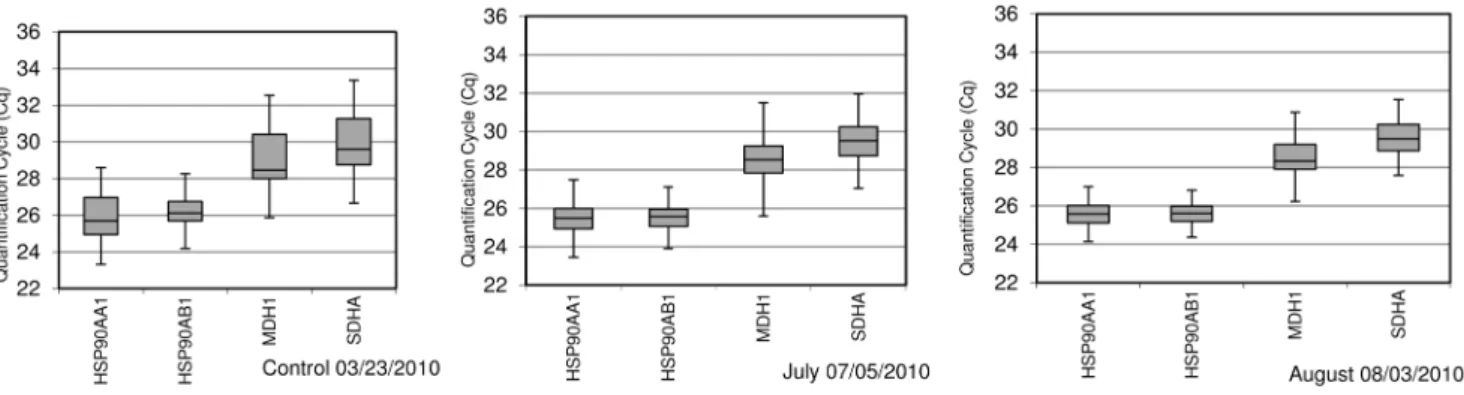
units higher than those of July. For the control time point, temperatures and THI values indicated no heat stress conditions. Raw Cq values for all genes in each treatment are shown in Figure 4. Under control conditions, Cq values for theHSP90AA1, HSP90AB1, MDH1and SDHA genes were 26.2, 26.6, 29.4 and 30.3, respectively. Smaller Cq values were observed for all genes in samples collected under high temperatures (July and August). They were 25.7 for both chaperones and 28.8 and 29.7 forMDH1
and SDHA, respectively. Variability in the expression rate of all genes was higher in samples collected under control conditions.
Based on linkage disequilibrium results, 3 sets of genotypes were selected to carry out expression studies. Genotypes considered in separate analyses were: 1) G/C2660-A/C2601-A/G2522-A/G2444, 2) A/C2601- A/G2522-A/G2444, 3) G/C2660.
Overall outcomes from fitting the mixed model. Test type III of fixed effects shows high significant F values (p,0.0001) for the MTG, P and b(RG) effects in all sets of genotypes. Estimates of the P effect levels (74) averaged 0.73 and ranged between 0.01 to 1.41 Cq. Regression coefficient estimates relating covariation of Cq and RIN values for each gene, were20.28,
20.47,20.55 and20.67 forHSP90AB1, HSP90AA1, MDH1and
SDHA, respectively.
Estimates of animal, sample and residual variances were very similar for the 3 sets of genotypes studied. Animal variance was very small and ranged between 0.03 and 0.05. Sample variance (1.40) was 2.8 times higher than the animal effect one.HSP90AB1
showed a residual variance (0.0086) 34 times lower than the one of
HSP90AA1(0.27) and 53 times lower than the one ofSDHA(0.46).
MDH1had the highest residual variance (1.34).
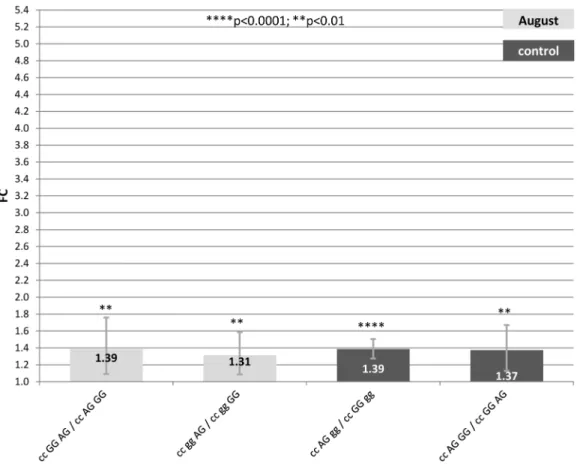
Figure 2. Fold change (FC) for the contrasts among alternative genotypes A/C2601-G/A522-A/G2444of theHSP90AA1promoter within each treatment (Control, July and August) normalized byHSP90AB1.Segments indicate the 95% confidence interval (FCup-FClow).In abscissa
1) Genotype G/C2660-A/C2601- A/G2522-A/G2444. Table S2 and Figure 1, show results for contrasts among G/C2660-A/ C2601-A/G2522-A/G2444 genotypes under the different climatic conditions considered.
For samples collected in August, CC2660-CC2601-GG2522 -AG2444showed the highest expression rate (differences in FC from 2 to 3) when comparing with other 8 genotypes. Seven of these 8 genotypes were GG2444, highlighting the importance of this position for the expression rate of the gene under heat stress conditions independently of the other three SNPs. Two significant contrasts pointed out the effect of SNP2660in terms of expression efficiency. CC2660 showed differences in FC of 1.27 and 1.31 when comparing with GC2660 and GG2660, respectively. It is important to note that contrasts showing differences in FC from 2.3 to 3.0 were those with wider confidence intervals which indicate higher estimated standard errors. This is due to the fact that in many of these contrasts, composed genotypes are at very low frequencies. In some cases only one animal exhibit the genotype compared. For comparisons where FC differences ranged between 1.2 and 1.3, confidence intervals were narrower due to the higher frequencies of the genotypes compared.
For samples collected in July, no comparisons between alternative genotypes were significant after the Holm-Bonferroni correction.
For the 5 significant contrasts of control samples the loose of the effect over the expression rate of the SNP2444 in the gene
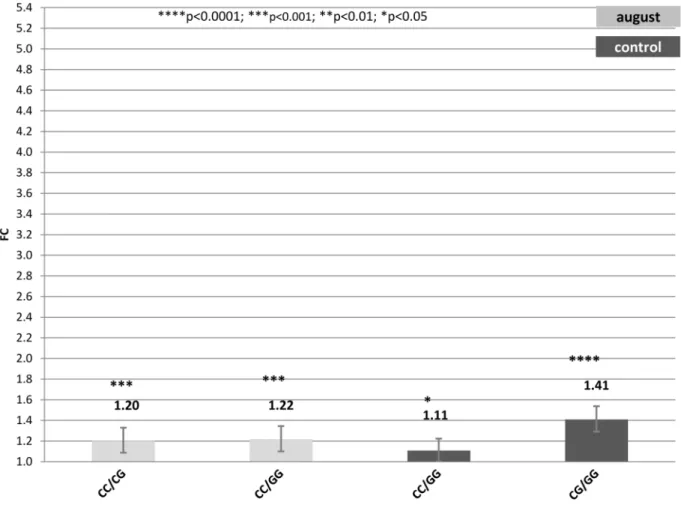
Figure 3. Fold change (FC) for the contrast among alternative genotypes G/C2660of theHSP90AA1promoter within each treatment (Control, July and August) normalized byHSP90AB1.Segments indicate the 95% confidence interval (FCup-FClow).In abscissa the FC, in ordinate
genotype contrast. Asterisk over each bar indicates the significance level of the contrasts. doi:10.1371/journal.pone.0066641.g003
Table 4.Minimum square error (MSE) within and across treatments forHSP90AA1, HSP90AB1, MDHAandSDHAgenes.
treatment gene MSE within treatment MSE within gene
August HSP90AB1 2.51
August HSP90AA1 3.17
August SDHA 3.84
August MDH1 9.81
July HSP90AB1 3.27
July HSP90AA1 6.07
July SDHA 7.46
July MDH1 9.92
control HSP90AB1 4.62 4.62
control HSP90AA1 6.39 6.39
control MDH1 8.20 9.92
control SDHA 9.94 9.94
promoter and the change in the expression rank of the 2660 genotypes were the most important effects observed. In 4 contrasts the GC2660-CC2601-AG2522-GG2444genotype showed differenc-es in FC from 1.3 to 1.6 when compared with alternative genotypes at 2660 and 2522. The superiority in terms of expression rate seems to depend in this case on the combination of genotypes existing at 2660 and 2522. Thus, the double heterozygous GC2660-AG2522 showed higher expression levels than GG2660-GG2522 (1.58–1.60), CC2660-AG2522 (1.54) and GC2660-GG2522(1.30). Finally, the SNP2601did not seem to be involved in the regulation of the basal expression of the gene. In this case, differences in the confidence intervals were smaller since genotypes compared had higher frequencies.
2) Genotype A/C2601- A/G 2522-A/G2444. To determine the impact of SNP2660over the expression rate of the gene under the different environmental conditions previously described [24], we have tested a genotype of three SNPs excluding SNP2660.
Table S3 and Figure 2, show results for contrasts among A/ C2601- A/G2522-A/G2444genotypes under the different climatic conditions considered.
Regarding the high decrease in the magnitude of the FC differences for the 4 significant comparisons, we can confirm the critical influence of SNP2660 over the gene expression rate. Surprisingly, higher differences in FC were detected for contrasts in control than in August, revealing a more important effect of these SNPs on the basal expression of theHSP90AA1gene under control conditions.
In samples collected in August, the two significant contrasts with the highest expression rate implied the AG2444 genotype in all cases. Again, AG2444 showed higher expression rate (FC = 1.3– 1.4) over GG2444under heat stress conditions. Genotypes at2601 and 2522 did not show any clear effect. No significant contrast was found among genotypes from samples collected in July.
Once more, under mild temperatures the SNP2444lost its effect over theHSP90AA1expression which appeared under heat stress conditions. As in the case above mentioned, AG2522 showed a positive effect over the expression of the gene comparing with GG2522(FC = 1.37–1.39).
3) Genotype G/C2660. Table S4 and Figure 3, show results for contrasts among G/C2660 genotypes under the different climatic conditions considered.
Contrasts of this genotype showed lower differences in FC than that observed for the previous 2 sets of genotypes. Two comparisons were significant in samples collected in August. Differences in FC were 1.22 and 1.20 for the contrasts CC2660vs.
GG2660 and CC2660 vs. GC2660, respectively, showing the superiority of the CC genotype at position2660 over the other genotypes in terms of gene expression rate under heat stress conditions.
In July samples, no comparison had statistic significance. However, under control temperatures, 2 contrasts showed significant differences in FC, CC2660 vs. GG2660 with a FC equal to 1.11 and GC2660vs. GG2660with a FC of 1.41.
Thus, when considering only SNP2660, results indicated no differences inHSP90AA1expression rate across treatments, but the existence of such differences across genotypes.
In order to understand better the results obtained, contrasts involving SNP2601and SNP2522, were carried out (Figure S2 and Figure S3). In the first analysis, alternative genotypes of A/C2601 -A/G2522were compared. Only one significant contrast was found under control conditions. A FC value of 1.4 was observed for the contrast CC2601-AG2522 vs. CC2601-GG2522, confirming the effect of A/G2522over the basal expression of the gene under mild temperatures. SNP2601, did not seem to play any clear role in the
HSP90AA1expression rate.
In the second additional analysis, genotypes of G/C2660-A/ G2522 were compared to elucidate the relevance of SNP2522 under heat stress conditions. In this case, significant contrasts were found for control samples and those collected in August. The importance of SNP2660in August was again revealed. CC2660had higher expression rate than GC2660and GG2660(FC = 1.24 and 1.27, respectively). Under control conditions the effect of SNP2522 was clear (FC = 1.28 at least). Changes in the behavior of G/C2660 under control conditions were observed as well. In this case, GC2660was superior to CC2660and GG2660as it was showed in previous analyses.
Discussion
In this study, we aimed to confirm the results obtained previously [24], that showed an association of the SNP2660 of the ovineHSP90AA1gene promoter with the expression levels of this gene under different environmental temperatures, using a higher amount of samples. We also aimed to increase the information available of the biological process underlying this type of stress conditions. With these purposes we have studied new polymorphisms found at the promoter region, which would affect the expression rate of the gene not only in heat stress events as it was firstly thought, but also modulating its basal expression.
Figure 4. Distribution of Quantification Cycle (Cq) values for the target geneHSP90AA1and the reference genesHSP90AB1,MDH1 andSDHA.They were obtained by qPCR from samples collected at three different time points (Control, July and August) along the year. Boxes show the range of Cq values within each gene and treatment; the centre line indicates the median; extended vertical bars show standard deviation of the mean.
RIN Effect
Best conservation and minimum degradation processes are critical points when sampling commercial livestock animals for expression studies. The degree of RNA degradation in the samples affects gene expression measurements. We have established that RIN values depended neither on the source of biological sample (the animal) nor on the environmental conditions surrounding samples collection. The only factor having a significant effect on RIN values was the period of time occurring between blood extraction and blood processing in LeukoLock platforms for each time point (DxGP). The higher this period of time was, the higher the RNA was degraded (lower values of RIN). Therefore, we proposed to include RIN values as a fixed effect or as a covariate in the statistical model used to analyze expression differences. In fact, the same results were obtained using both approaches (data not shown).
RIN values affect Cq of samples depending on amplicon size [44]. The higher the amplified DNA fragment is, the higher the probability is to be broken down. The length of the amplified product was more correlated with RIN values than expected. Amplicon sizes were in the range of 70 to 250 bp (Table 3) for which Fleige and Pfaffl [26] indicates a more or less independence of qPCR products and RNA quality. Furthermore, DNA CG content did not seem to affect RNA stability as it has been previously described, where lower CG degree content was correlated with higher RIN values [45].SDHAamplicon was the one with the highest CG content (65%) but was the most affected by RNA degradation. Only forMDH1,which has the lowest CG content and a high RIN effect, this relationship seems to be true. These results reveal that the effect of RNA integrity over both the GOI and the HK should be taken into account in expression analyses.
HK Selection
A crucial aspect revealed in this work, is the need to test the stability of the candidate HKs and the GOI simultaneously.
MDH1 and SDHA were previously selected [38] among 16 candidates tested, as the most stable pair in similar conditions to those evaluated here. HSP90AA1 was not included in that experiment. In the present work, we have verified that the GOI,
HSP90AA1, is much more stable than the two previously selected HKs,MDH1andSDHA. Therefore, none of them can be used to normalize the GOI expression data. The constitutive counterpart of the HSP90AA1 gene, HSP90AB1, showed the best stability values within and between treatments (Table 4), and it was chosen as the HK to normalize the expression data of the HSP90AA1. Differences in the stability of both chaperone genes might be due to the effect of the SNPs existing at the promoter of theHSP90AA1
[13] [40] and to the more inducible behavior of this gene.
qPCR Experimental Design and Statistical Methods for Expression Data Analyses
When a great number of samples and treatments are included in a qPCR study the experimental design is important since qPCR plates have a limited capacity (96 or 384 wells). In our design, plates contained a randomized set of animals, treatments, genotypes, RIN values and genes to avoid estimation biases. The repetition of one or more samples in all plates connects the plate’s system allowing to remove technical nuisance from this source of variability and to compare results from all plates. We have confirmed that the plate effect is an important source of variability since differences in Cq among plates can reach values up to 1.4.
Traditional statistical methods to analyze qPCR data was restricted to pair-wise comparisons of treatments in which expression data from GOIs are previously normalized with one or more HKs. This kind of approach does not include systematic nor random effects and their interactions that could affect expression results. In the linear mixed model used in this study, GOI and HKs data are simultaneously analyzed.This model includes different sources of biological and technical variation (i.e. plate, RIN, genotypes, genes, and interactions among them) as fixed or random effects. Fitting this model let us checking HK stability, normalization of GOI data with the most stable HK(s) and test the linear hypothesis of the existence of different expression levels of the HSP90AA1 gene depending on the genotype of the mutations located at its promoter and on diverse environmental conditions.
Environmental Conditions and Gene Expression
Sheep are believed to be one of the most resistant species to climatic extremes, especially to high environmental temperatures. Environmental conditions in Ciudad Real often exceed sheep thermo neutral zone which is comprised between 5uC and 25uC [46]. As expected, expression results differed between heat stress and control conditions. However, unexpectedly, differences in expression rate among genotypes were observed in samples collected in August but not in July. The scarce differences in climatic parameters existing between August and July collects did not explain the observed differences between these time points in terms of FC. The higher THImax values at collection time and during 5 days before collection in August than in July could be the clue to such differences. Other environmental factors here unknown such as wind speed, number of hours over the comfort temperature, insulation, etc. included in Fanger’s comfort equation [47] would have also contributed in such differences.
Significant differences among A/C2601-A/G2522-A/G2444and G/C2660among genotypes, found for August and control samples but not for July ones would be explained by the existence of a transition in the expression state of the gene between the basal transcription and the heat stress response. Changes in the expression ranking of G/C2660 observed between control and August samples, and also for other SNPs in a less evident way, would support this hypothesis. Also, since the heat stress response is not a permanent state, in terms of gene expression, even when heat shock conditions are still present, acclimatization processes cannot be discarded as possible source of differences found in samples collected in July and August [48].
Expression Analysis and Genotype Comparisons
Our initial hypothesis was that differences in the expression rate of the gene with different G/C2660genotypes would be observed only under heat stress conditions [24]. Surprisingly, after including a higher amount of samples and a set of 6 additional polymorphisms located also at the HSP90AA1 promoter, the existence of expression differences under non heat stress situations was confirmed as well. Thus, polymorphisms located in the promoter of HSP90AA1 affect not only its expression rate as response to heat shock but also its basal transcription levels.
HSF1 binding to the heat-shock response element (HSE) and integrating to modulate HSP transcription have been reported [49]. Additional positive or negative factors may modulate the transcriptional induction of HSF1-bound genes. Moreover, eukaryotic gene expression is tightly regulated at many levels, and can vary its regulation complexity [50]. The core promoter (TATA box, initiator –INR- and downstream promoter element – DPE-), is the essential part. Next to the core, proximal enhancers as cis-control elements (i.e. CCAAT box, GC box, B recognition element (BRE) and STRE elements) might be acting. Upstream, distal enhancers (hormone responsive elements -HRE- and nuclear factor element –NFE-) and a huge diversity of regulators that recruit a cascade of more transcription factors contribute to gene transcription regulation [51], [52]. The SNPs studied in this work are located enough upstream to the beginning of the transcription initiation to consider them as binding sites of these co-regulators, or distal enhancers that do not directly activate the transcription of the gene but modulate its expression.
The role of the SNP G/C2660in the transcription of the gene under heat stress has been confirmed through analysis in which only this mutation is tested. However, results from the analyses of composed genotypes G/C2660-A/C2601-A/G2522-A/G2444 and A/C2601-A/G2522-A/G2444 revealed a cooperative relationship among several SNPs in terms of transcription efficiency. Thus, alternative genotypes of SNP2660-SNP2444 seem to affect the expression of the gene in response to heat stress and those of SNP2660-SNP2522 the basal transcription of HSP90AA1, which may occur under climatic conditions comprising comfort temper-atures. Under heat stress conditions, the superiority of CC2660 over GC2660and GG2660and of GC2660over GG2660indicated an additive effect for this mutation. However, for the control samples, the GC2660 genotype was superior to CC2660 and GG2660. The effect of the SNP2444was less clear due to the low frequencies of the AG2444and AA2444 genotypes; however, for the SNP located at2522, more clear conclusions can be extracted. Several putative TFs have been predicted (Table S7 and Table S8) for the presence of C and A at SNPs 2660 and 2444, respectively. Some TFs that could co-activate gene expression as distal enhancers only with CC2660were NFI/CTF (Nuclear factor I or CCAAT box-binding transcription factor) and VDR (Vitamin D receptor) together with RxR-alpha (Retinoid X receptor Alpha). The last two TFs form a heterodimer which attracts a complex of co-activators proteins. This complex links the heterodimer to the initiation complex formed at the TATA box, promoting the transcription machinery [53]. Both TFs bind putatively at the sequence around the SNP2660, and VDR only when this position is C. For AG2444 a heat shock element that could bind a heat shock factor was predicted for the presence of the A nucleotide [39].
The presence of an INDEL of two adenines (AA) located at position -704 in the promoter [21] completely linked, at least in this breed with SNP2660, must also be considered in the expression regulation of the gene under heat stress conditions. Thus, CC2660 animals are also homozygous for the AA insertion (AA/AA), animals with GC2660 are heterozygous ins/del (AA/2) and animals with GG2660are homozygous for the AA deletion (2/2). This INDEL (AA) was located within a putative glucocorticoid receptor (GR) transacting factor binding site. The AA deletion (2/
2) created a GR transcription site. It has been pointed out that glucocorticoids can suppress the heat shock response in stressed cells by inhibiting the action of the heat shock factor 1 (HSF1) [54]. Therefore, this mutation would be the responsible of the expression differences observed for SNP2660. Because of the high linkage disequilibrium between the SNPs at 2660 and 2528
(R2= 0.95) the possible effect of the SNP2528over the transcrip-tion rate of the gene under heat stress conditranscrip-tions is masked by the first, and therefore no conclusions could be extracted from this position.
Under control conditions, A/G2522 seems to have a predom-inant effect over the transcription rate of the gene, being AG2522 (AA2522 was not found in these samples) superior than GG2522. Due to the proximity of this mutation to the SNPs located at2528 (5pb) and 2524 (1pb) TF binding sites were predicted for a sequence containing the three SNPs (Table S7 and Table S8). Several putative TF binding sites linked to the presence of adenine at 2522 and thymine at 2524 were found. Among them, the stress response element (STRE) [39] and the JunD (functional component of the AP1 -activator protein 1- transcription factor complex) related with transcription coactivator activity, oxidative stress response [55] and spermatogenesis [56] seemed to be closer to theHSP90AA1functions. The TF c-Fos stimulates transcription of genes containing AP-1 regulatory elements and was predicted for the sequence AtagTcA for the SNPs at2528,2524 and –522. In our samples animals with AG2522were always CC-601-TT2524 -TT2468 and in most cases (70%) CC-601-AG2528-TT2524 -TT2468. Two putative TF binding sites implying the presence of cytosine were found for A/C2601, HES-1 (hairy and enhancer of split-1) [57], which can act as a repressor or activator, and USF1 (Upstream stimulatory factor 1) [58], that has been found to be involved in the stress-activated signaling cascade [59] and in the cessation of Sertoli cell proliferation and differentiation to spermatozoids [60]. For the SNP2468one interesting homolog of the human ZNF395 binding Sp1 was found for maize [61] linked to the response to oxidative stress (Table S7).
Most stress-response genes are regulated in a concordant manner with respect to transcript levels and translational efficiency. A strong overall correlation has been observed between transcriptional/translational induction of genes and induction of the corresponding proteins [62]. During environmental stress in fission yeast, most mRNAs are regulated both at transcription and translation level but only up-regulated mRNAs showed a strong correlation with protein expression, while down-regulated mRNAs showed no such correlation [62]. Therefore changes in the expression rate of theHSP90AA1here observed as a function of environmental temperatures and genotypes at the SNPs located in its promoter will be accompanied by changes in the amount of protein produced. Thus, those genotypes which showed higher expression levels under heat shock also will display higher protein amounts. Despite the low magnitude of the changes inHSP90AA1
expression rate observed, even a small proportion may be significant as HSP90 is one of the most abundant proteins in most cells [39]. Higher amounts of HSP90a protein would increase its capacity to exert its protective role over the effects caused by heat stress at the cellular level. Effects of changes in the protein amount as consequence of several stress sources must be studied in tissues in which HSP90apredominates, such as brain and testis [39]. In this context, our results for two of the known functions of the HSP90a, refolding proteins with aberrant conformation [39] and spermatogenesis and meiotic progression in testis [63], confirm this hypothesis. GG2660 was related with higher sperm DNA fragmentation values in rams under heat stress conditions [23] and also to lower scrapie incubation period in sheep (missfolding stress) [22].
CpG islands located at gene promoters is a well known mechanism of expression regulation and gene silencing [64]. A CpG island has been predicted for the promoter of this gene and some of the polymorphisms here analyzed are susceptible to be methylated (SNPs located at 2660, 2601, 2528 and 2522). Therefore, future research will be also focused in the study of the methylation pattern of alternative genotypes of the SNPs containing cytosine by bisulfite sequencing techniques.
Supporting Information
Figure S1 Sequence and polymorphisms of the ovine
HSP90AA1gene promoter (DQ983231).Intron sequence in
lower case and exons in capital letters. Primers sequences used to amplify the 499pb fragment are highlighted in dark. SNPs are in square brackets. The 7 SNPs of interest included in the 499pb amplicon sequenced (2660, 2601, 2528, 2524, 2522 and
2444) are in grey. INDELs are in brackets. Putative methylated SNPs are also circled. Initiation of transcription (TATA box) and translation (ATG) in bold. A HSE already detected is underlined. Modified from Marcos-Carcavilla and coworkers [20].
(TIF)
Figure S2 Fold change (FC) for the contrast among alternative genotypes G/C2660-G/A2522of theHSP90AA1
promoter within each treatment (Control, July and August) normalized by HSP90AB1. Segments indicate the 95% confidence interval (FCup-FClow). In abscissa the FC, in ordinate genotype contrasts. Asterisk over each bar indicates the significance level of the contrasts.
(TIF)
Figure S3 Fold change (FC) for the contrast among alternative genotypes A/C2601-G/A2522of theHSP90AA1
promoter within each treatment (Control, July and August) normalized by HSP90AB1. Segments indicate the 95% confidence interval (FCup-FClow). In abscissa the FC, in ordinate genotype contrasts. Asterisk over each bar indicates the significance level of the contrasts.
(TIF)
Table S1 SNP frequencies of the polymorphisms found at the HSP90AA1 promoter as described in
Marcos-Carcavilla’s work[24].
(XLSX)
Table S2 Genotype contrasts of G/C2660-A/C2601-A/
G2522-A/G2444.Estimates, standard error (SE), t values and p values of significant contrasts among genotypes G/C2660-A/ C2601-A/G2522-A/G2444 of the HSP90AA1 gene promoter normalized with HSP90AB1 in each treatment (Control, July
and August). Also Fold change (FC) and the 95% FC confidence interval (FCup-FClow) are included.
(XLSX)
Table S3 Genotype contrasts of A/C2601-A/G522-A/
G2444. Estimates, standard error (SE), t values and p values of significant contrasts among genotypes A/C2601-A/G522-A/G2444 of theHSP90AA1 gene promoter normalized withHSP90AB1in each treatment (Control, July and August). Also Fold change (FC) and the 95% FC confidence interval (FCup-FClow) are included. (XLSX)
Table S4 Genotype contrasts of SNP G/C2660.Estimates, standard error (SE), t values and p values of significant contrasts among genotypes G/C2660 of the HSP90AA1 gene promoter normalized withHSP90AB1in each treatment (Control, July and August). Also Fold change (FC) and the 95% FC confidence interval (FCup-FClow) are included.
(XLSX)
Table S5 Hardy-Weinberg equilibrium analysis of the 7SNPs of interest atHSP90AA1gene promoter on trios
population.
(XLSX)
Table S6 LD analyses from trios population with PLINK software.Linkage disequilibrium values between each couple of SNPs are shown. The couples of SNPs in bold show a high degree of linkage disequilibrium between them.
(XLSX)
Table S7 Predicted transcription factor binding sites from TESS software.
(XLSX)
Table S8 Predicted transcription factor binding sites from ALGENN-PROMO software.
(XLSX)
Acknowledgments
We thank the AGRAMA breeders association, CERSYRA Valdepen˜as and INIA for providing the biological samples and Professor Juan Pedro Steibel (Michigan State University) for his statistic advice. Also to Dr Villanueva for her suggestions and revision.
Author Contributions
Conceived and designed the experiments: MMS JSO. Performed the experiments: JSO CG NMS. Analyzed the data: MMS JSO. Contributed reagents/materials/analysis tools: JHC MDPG. Wrote the paper: JSO MMS.
References
1. Pedrosa S, Uzun M, Arranz JJ, Gutierrez-Gill B, Primitivo FS, et al. (2005) Evidence of three maternal lineages in near eastern sheep supporting multiple domestication events. Proceedings of the Royal Society B-Biological Sciences 272: 2211–2217.
2. Maijala K (1997) Genetic aspects of domestication, common breeds and their origin. In: Piper LR, A., editor. The genetics of sheep. 13–49.
3. Kijas JW, Townley D, Dalrymple BP, Heaton MP, Maddox JF, et al. (2009) A Genome Wide Survey of SNP Variation Reveals the Genetic Structure of Sheep Breeds. Plos One 4.
4. Morton JM, Tranter WP, Mayer DG, Jonsson NN (2007) Effects of environmental heat on conception rates in lactating dairy cows: Critical periods of exposure. Journal of Dairy Science 90: 2271–2278.
5. Sanchez JP, Misztal I, Aguilar I, Zumbach B, Rekaya R (2009) Genetic determination of the onset of heat stress on daily milk production in the US Holstein cattle. Journal of Dairy Science 92: 4035–4045.
6. Aguilar I, Misztal I, Tsuruta S (2009) Genetic components of heat stress for dairy cattle with multiple lactations. Journal of Dairy Science 92: 5702–5711.
7. Finocchiaro R, van Kaam J, Portolano B, Misztal I (2005) Effect of heat stress on production of Mediterranean dairy sheep. Journal of Dairy Science 88: 1855– 1864.
8. Marai IFM, El-Darawany AA, Fadiel A, Abdel-Hafez MAM (2007) Physiolog-ical traits as affected by heat stress in sheep - A review. Small Ruminant Research 71: 1–12.
9. Marai IFM, El-Darawany AA, Fadiel A, Abdel-Hafez MAM (2008) Reproduc-tive performance traits as affected by heat stress and its alleviation in sheep. Tropical and Subtropical Agroecosystems 8: 209–234.
10. Sevi A, Caroprese M (2012) Impact of heat stress on milk production, immunity and udder health in sheep: A critical review. Small Ruminant Research 107: 1– 7.
12. Trinklein ND, Murray JI, Hartman SJ, Botstein D, Myers RM (2004) The role of heat shock transcription factor 1 in the genome-wide regulation of the mammalian heat shock response. Molecular Biology of the Cell 15: 1254–1261. 13. Collier RJ, Collier JL, Rhoads RP, Baumgard LH (2008) Invited review: Genes involved in the bovine heat stress response. Journal of Dairy Science 91: 445– 454.
14. Charoensook R, Gatphayak K, Sharifi AR, Chaisongkram C, Brenig B, et al. (2012) Polymorphisms in the bovine HSP90AB1 gene are associated with heat tolerance in Thai indigenous cattle. Tropical Animal Health and Production 44: 921–928.
15. Becker J, Craig EA (1994) Heat-shock proteins as molecular chaperones. European Journal of Biochemistry 219: 11–23.
16. Sorensen JG, Kristensen TN, Loeschcke V (2003) The evolutionary and ecological role of heat shock proteins. Ecology Letters 6: 1025–1037. 17. Huang LH, Wang HS, Kang L (2008) Different evolutionary lineages of large
and small heat shock proteins in eukaryotes. Cell Research 18: 1074–1076. 18. Chen B, Zhong DB, Monteiro A (2006) Comparative genomics and evolution of
the HSP90 family of genes across all kingdoms of organisms. Bmc Genomics 7. 19. Krone PH, Sass JB (1994) HSP 90 alpha and HSP 90 beta genes are present in the zebrafish and are differentially regulated in developing embryos. Biochem-ical and BiophysBiochem-ical Research Communications 204: 746–752.
20. Marcos-Carcavilla A, Calvo JH, Gonzalez C, Moazami-Goudarzi K, Laurent P, et al. (2008) Structural and functional analysis of the HSP90AA1 gene: distribution of polymorphisms among sheep with different responses to scrapie. Cell Stress & Chaperones 13: 19–29.
21. Oner Y, Calvo JH, Serrano M, Elmaci C (2012) Polymorphisms at the 59 flanking region of the HSP90AA1 gene in native Turkish sheep breeds. Livestock Science 150: 381–385.
22. Marcos-Carcavilla A, Moreno C, Serrano M, Laurent P, Cribiu EP, et al. (2010) Polymorphisms in the HSP90AA1 59flanking region are associated with scrapie incubation period in sheep. Cell Stress & Chaperones 15: 343–349. 23. Ramo´n M, Salces-OrtizJ, Garde J, Gonza´lez C, Sa´nchez-Moreno N et al. (2012)
Effect of environmental temperature and Hsp90aa1 genotype over sperm DNA fragmentation in rams.; 10–21 September, 2012; Les Diablerets, Switzerland. 24. Marcos-Carcavilla A, Mutikainen M, Gonzalez C, Calvo JH, Kantanen J, et al.
(2010) A SNP in the HSP90AA1 gene 59flanking region is associated with the adaptation to differential thermal conditions in the ovine species. Cell Stress & Chaperones 15: 67–81.
25. Dheda K, Huggett JF, Chang JS, Kim LU, Bustin SA, et al. (2005) The implications of using an inappropriate reference gene for real-time reverse transcription PCR data normalization. Analytical Biochemistry 344: 141–143. 26. Fleige S, Pfaffl MW (2006) RNA integrity and the effect on the real-time
qRT-PCR performance. Molecular aspects of medicine 27.
27. Bustin SA, Vandesompele J, Pfaffl MW (2009) Standardization of qPCR and RT-qPCR. Genetic Engineering & Biotechnology News 29: 40–43. 28. Auer PL, Doerge RW (2010) Statistical Design and Analysis of RNA Sequencing
Data. Genetics 185: 405–U432.
29. Steibel JP, Poletto R, Coussens PM, Rosa GJM (2009) A powerful and flexible linear mixed model framework for the analysis of relative quantification RT-PCR data. Genomics 94: 146–152.
30. Lim A, Steibel JP, Coussens PM, Grooms DL, Bolin SR (2012) Differential gene expression segregates cattle confirmed positive for bovine tuberculosis from antemortem tuberculosis test-false positive cattle originating from herds free of bovine tuberculosis. Veterinary medicine international 2012.
31. Arceo ME, Ernst CW, Lunney JK, Choi I, Raney NE, et al. (2012) Characterizing differential individual response to porcine reproductive and respiratory syndrome virus infection through statistical and functional analysis of gene expression. Frontiers in genetics 3.
32. Miller SA, Dykes DD, Polesky HF (1988) A simple salting out procedure for extracting dna from human nucleated cells. Nucleic Acids Research 16: 1215– 1215.
33. Purcell S, Neale B, Todd-Brown K, Thomas L, Ferreira MAR, et al. (2007) PLINK: A tool set for whole-genome association and population-based linkage analyses. American Journal of Human Genetics 81: 559–575.
34. Hill WG, Robertson A (1968) Linkage disequilibrium in finite populations. Theoretical and Applied Genetics 38: 226–231.
35. Schug J (2008) Using TESS to predict transcription factor binding sites in DNA sequ ence. Curren t protocols in bioinformatics/editoral board, Andreas D Baxevanis [et al] Chapter 2.
36. Messeguer X, Escudero R, Farre D, Nunez O, Martinez J, et al. (2002) PROMO: detection of known transcription regulatory elements using species-tailored searches. Bioinformatics 18: 333–334.
37. Farre D, Roset R, Huerta M, Adsuara JE, Rosello L, et al. (2003) Identification of patterns in biological sequences at the ALGGEN server: PROMO and MALGEN. Nucleic Acids Research 31: 3651–3653.
38. Serrano M, Moreno-Sanchez N, Gonzalez C, Marcos-Carcavilla A, Van Poucke M, et al. (2011) Use of Maximum Likelihood-Mixed Models to select stable reference genes: a case of heat stress response in sheep. Bmc Molecular Biology 12.
39. Csermely P, Schnaider T, Soti C, Prohaszka Z, Nardai G (1998) The 90-kDa molecular chaperone family: Structure, function, and clinical applications. A comprehensive review. Pharmacology & Therapeutics 79: 129–168. 40. Deuerling E, Patzelt H, Vorderwulbecke S, Rauch T, Kramer G, et al. (2003)
Trigger Factor and DnaK possess overlapping substrate pools and binding specificities. Molecular Microbiology 47: 1317–1328.
41. Rasmussen R (2001) Quantification on the LightCycler. In: Meuer S, Wittwer, C, Nakagawara, K, eds, editor. Rapid Cycle Real-time PCR, Methods and Applications Springer Press, Heidelberg;. 21–34.
42. Littell RC, Milliken GA, Stroup WW, Wolfinger RD, and Schabenberger O (2006) SAS for Mixed Models. Second Edition, Cary, NC: SAS Institute Inc. 43. Marai IFM, Ayyat MS, Abd El-Monem UM (2001) Growth performance and
reproductive traits at first parity of New Zealand White female rabbits as affected by heat stress and its alleviation under Egyptian conditions. Tropical Animal Health and Production 33: 451–462.
44. Fleige S, Walf V, Huch S, Prgomet C, Sehm J, et al. (2006) Comparison of relative mRNA quantification models and the impact of RNA integrity in quantitative real-time RT-PCR. Biotechnology Letters 28: 1601–1613. 45. Opitz L, Salinas-Riester G, Grade M, Jung K, Jo P, et al. (2010) Impact of RNA
degradation on gene expression profiling. Bmc Medical Genomics 3. 46. Curtis SE (1983) Environmental management in animal agriculture. Ames, Iowa
50010: Iowa State University Press. 47. Fanger O (1970/1982) Thermal Comfort.
48. Basu N, Todgham AE, Ackerman PA, Bibeau MR, Nakano K, et al. (2002) Heat shock protein genes and their functional significance in fish. Gene 295: 173–183. 49. Stephanou A, Latchman DS (2011) Transcriptional modulation of heat-shock
protein gene expression. Biochemistry research international 2011.
50. Lemon B, Tjian R (2000) Orchestrated response: a symphony of transcription factors for gene control. Genes & Development 14: 2551–2569.
51. Thanos D, Maniatis T (1995) Virus induction of human IFN beta gene expression requires the assembly of an enhanceosome. Cell 83: 1091–1100. 52. Blau J, Xiao H, McCracken S, Ohare P, Greenblatt J, et al. (1996) Three
functional classes of transcriptional activation domains. Molecular and Cellular Biology 16: 2044–2055.
53. Bikle DD (2010) Vitamin D: newly discovered actions require reconsideration of physiologic requirements. Trends in Endocrinology and Metabolism 21: 375– 384.
54. Wadekar SA, Li DP, Periyasamy S, Sanchez ER (2001) Inhibition of heat shock transcription factor by GR. Molecular Endocrinology 15: 1396–1410. 55. Mendelson KG, Contois LR, Tevosian SG, Davis RJ, Paulson KE (1996)
Independent regulation of JNK/p38 mitogen-activated protein kinases by metabolic oxidative stress in the liver. Proceedings of the National Academy of Sciences of the United States of America 93: 12908–12913.
56. Thepot D, Weitzman JB, Barra J, Segretain D, Stinnakre MG, et al. (2000) Targeted disruption of the murine junD gene results in multiple defects in male reproductive function. Development 127: 143–153.
57. Yan B, Raben N, Plotz PH (2002) Hes-1, a known transcriptional repressor, acts as a transcriptional activator for the human acid alpha-glucosidase gene in human fibroblast cells. Biochemical and Biophysical Research Communications 291: 582–587.
58. Kumari D, Usdin K (2001) Interaction of the transcription factors USF1, USF2, and alpha-Pal/Nrf-1 with the FMR1 promoter - Implications for Fragile X mental retardation syndrome. Journal of Biological Chemistry 276: 4357–4364. 59. Galibert MD, Carreira S, Goding CR (2001) The Usf-1 transcription factor is a novel target for the stress-responsive p38 kinase and mediates UV-induced Tyrosinase expression. Embo Journal 20: 5022–5031.
60. Wood MA, Walker WH (2009) USF1/2 Transcription Factor DNA-Binding Activity Is Induced During Rat Sertoli Cell Differentiation. Biology of Reproduction 80: 24–33.
61. Lal A, Peters H, St Croix B, Haroon ZA, Dewhirst MW, et al. (2001) Transcriptional response to hypoxia in human tumors. J Natl Cancer Inst 93: 1337–1343.
62. Lackner DH, Schmidt MW, Wu SD, Wolf DA, Bahler J (2012) Regulation of transcriptome, translation, and proteome in response to environmental stress in fission yeast. Genome Biology 13.
63. Grad I, Cederroth CR, Walicki J, Grey C, Barluenga S, et al. (2010) The Molecular Chaperone Hsp90 alpha Is Required for Meiotic Progression of Spermatocytes beyond Pachytene in the Mouse. Plos One 5.