The purpose of this paper is the analysis of the mechanical performance of concrete deep beams. To overcome the shortcomings inherent to the pioneer models, the inite element approximation on a non linear orthotropic model is employed. The obtained results showed that the practiced range on steel reinforcement did not inluence, signiicantly, the beam performance, and one testiies a behavior, in the overall way, pursuant the fashion accepted in the scientiic literature on the subject. Nevertheless, it should be detached that the material failure resulted from the concrete crushing on beneath load region, in addition to the occurrence of horizontal tensile stress and “snap back”, at the upper edge in the center region, for the beams of greatest height.
Keywords: concrete, deep beam, mechanical performance, analysis.
O objetivo deste trabalho é a análise do desempenho mecânico de vigas parede de concreto. Visando suplantar as deiciências inerentes aos modelos pioneiros, emprega-se o método dos elementos initos sobre um modelo ortotrópico não linear. Os resultados obtidos revelaram que as variações praticadas na taxa de armadura de tração pouco inluenciaram o desempenho mecânico da viga, constatando-se comportamento, de um modo geral, conforme a acepção consagrada na literatura cientíica sobre o assunto. Entretanto, ressalva-se que a ruína do elemento estru -tural resultou do esmagamento do concreto na região situada abaixo da carga, além da incidência de tensão de tração horizontal e “snap back”, no bordo superior ao centro do vão, para as vigas de maior altura.
Palavras-chave: concreto, viga parede, desempenho mecânico, análise.
Numerical simulation of the mechanical performance
of deep beam
Simulação numérica do desempenho mecânico
de vigas parede
E. L. MADUREIRA a [email protected]
J.I.S.L. ÁVILA b [email protected]
a Universidade Federal do Rio Grande do Norte, Centro de Tecnologia, Departamento de Engenharia Civil, Email: [email protected],
Av. Sen. Salgado Filho S/N – Lagoa Nova, -CEP 59072 –970, Natal, Brasil
b Universidade Federal de Pernambuco, Centro de Tecnologia e Geociências, Departamento de Engenharia Civil, Email: [email protected],
Av. Acad. Hélio Ramos, S/N – Cid. Universitária CEP 50730-000, Recife, Brasil
Abstract
1. Introduction
Among the pioneering procedures aimed, for the evaluation of the mechanical performance of reinforced concrete deep beams, there are two alternate segments. One of them is based on the model of connecting-rods. The other is based on horizontal stress distribu-tion diagrams along the height of the beam, in hypothetically criti-cal sections [5].
In the irst model conception, the reinforcement steel bars play the role of tie rods by absorbing the tensile stresses. Concrete, in turn, when loaded, presents cracking mechanisms charac -terized by establishing the standard connecting rods, located strategically in outlined regions, which transmit the compressive stresses. The rest of the beam concrete mass remains in idle condition.
In another procedure, the stress distribution diagrams, obtained from the theory of elasticity, are taken as reference for the determi-nation of efforts to design the structural member.
It should be emphasized that the mechanical behavior of Portland cement concrete is not linear since from the low-intensity stress -es, as revealed on experimental tests [1], [2],[3],[4],[6],[7],[9],[11]. The source of its non-linearity is, especially, cracking develop-ment prior to loading, arising from the shrinkage phenomenon and thermal changings associated to the cement hydration heat, as well as to the cracking propagation during the load-deforma -tion process [3] e [9].
Thus, on the perspective for adoption bolder solutions, the design of concrete deep beams, from the modeling criteria presented above, can be precarious. It is appropriate, therefore, to adopt models more suitable to structures design on the base of better use of material.
The nonlinear Orthotropic Model [9], in spite of its modest formu-lation, describes, properly, the mechanical behavior of concrete, providing effective resources to overcome the shortcomings of pio-neer models.
The subject of this work is the numerical simulation of mechanical behavior of reinforced concrete deep beams by inite element ap -proximation on a nonlinear Orthotropic Model.
2. Modelling
The numerical analysis was performed from the employing of an incremental iterative procedure and inite element approximation. The adopted mathematical modeling was based in the non-linear orthotropic formulation [9], according which the constitutive matrix elements to be used are deined in the base on similar equations to those employed in uniaxial state of stress, however, taking as a reference, the equivalent strains, which are given by:
(1)
ii
j
ij
i
ei
D
/
D
The “i” and “j” indexes refer to principal plane directions. The pa -rameters “Dij” represent the matrix constitutive elements.
For concrete in compression simulation the constitutive relations proposed by Hognestad [6] was adopted, presented in the form:
(2)
ei
ip
ei
ip
ip
i
.
.2
1
.2
for
ip<
ei< 0; and
ip
cu
ip
ei
ip
i
20
3
1
for
cu<
ei<
ip.The parameters” “eip” and “sip” represent the concrete peak strain and the peak stress, respectively, on the principal direction “i”, and
“ecu”, the failure limit strain. These equations represent the hard -ening and soft-ening snippets, OA and AB segments, respectively, of the curve in Figure 1.
To represent the behavior of concrete in tension it was ad -opted the smeared crack model, whose advantages are consider the continuity of the displacement fields, and to dispense topological character modifications in finite ele-ment mesh, in the course of its calculation procedures [12]. In addition, it will adopt the multidirectional cracking pat -tern, represented by a mutually orthogonal system of rotat-ing cracks, in which its plane slope is conditioned upon the state of current stresses and may change depending on the stage of loading.
The concrete behavior, for strains of magnitude lower than one corresponding to tensile strength, stretch OC on the curve of Fig-ure 1, is considered linear elastic. For strains of magnitude higher than that, its behavior is plastic softening, and it is represented by the straight line segment CD that is deined from the ultimate strain value, “εo”.
The cracking on the mass of the concrete disturbs, signiicantly, its uniformity and continuity, and the larger the inite element will be the greater stiffness variation in its interior. In order to com-pensate the errors arising from such disturbance and minimize the loss of quality of the results, in this work, it is used the fea
where
β
1=
s
1/
f
c' ,β
2=
s
2/
f
c' . “s1” e “s2” are principal stresses so that 0 > s1 > s2. “f
c'” is the concrete uniaxial compres -sive strength. Consideringα =
s
1/
s
2, then the biaxial com-pressive strength is given by:
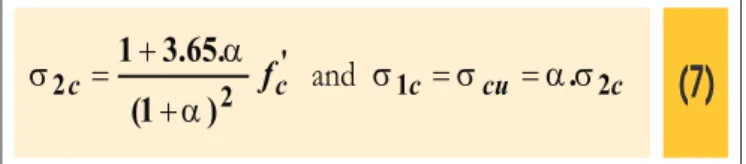
(7)
'
2
2
)
1(
.
65
.3
1
c
c
f
and
1
c
cu
.
2
c
In compression-tension state of stress, compressive strength is given by the fashion proposed by Darwin and Pecknold, deined in [3] and [9], in the form:
(8)
'
2
2
)
1
(
.
28
.
3
1
c
c
f
The tensile strength, in turn, can be obtained from the equation:
(9)
tu
c
pt
f
1
0
.
8
2
'
.
in which “stu” represents the uniaxial tensile strength.
For elements under tension-tension, the tensile strength is con-stant and equal to the concrete uniaxial tensile strength.
The strains related to peak stresses in biaxial compression state is obtained according to the relationships:
(10)
3
2
2
2
p
co
and
1
2
1
3
1
1
1
.
6
2
.
25
0
.
35
p
co
where c p
f
1 1s
β
=
,c p
f
2 2s
β
=
and “eco” is the straincorresponding to the compressive stress peak on uniaxial state of stress.
For concrete subjected to plane state of stresses it is adopted the constitutive relationship on incremental fashion proposed by Desai and Siriwardance, (apud [9]), written by:
(11)
.
).G
-(1
0
0
0
E
.
E
0
E
1
1
12
22
11
2
2
2
1
2
1
1
2
12
22
11
d
d
d
E
E
E
d
d
d
where the “ Ei’s “ are the deformation modules for each one of the principal directions, which are considered as they are oriented according the crack directions. The shear module is obtained from:
ture proposed by Kwak and Filippou [9], that deine the ultimate concrete strain by:
(3)
)
3
.(
)
/
3
ln(
.
.
2
b
f
b
G
t
f
o
to which “b” is the inite element length, expressed in inches. The parameters “ft”and “Gf” represent, respectively, the tensile strength and the concrete fracturing energy per unit of area. The latter is deined according to the CEB-FIP model code 90 criteria [4]. In reference to concrete deformation modulus it was adopted its reduced version, obtained from:
(4)
0
85
,
0
E
E
cs
where “Eo” is the initial deformation modulus, expressed, from [13],
in the form:
(5)
)
MPa
(
f
5600
E
o
ck
The concrete ultimate stresses are deined by the failure envelope proposed by Kupfer and Gerstle [8], Figure 2, described by:
(6)
0
65
.
3
)
(
1
2
2
2
1
tive Analysis-ACNL [10]. The program was developed according to incremental iterative procedure and the inite element method (MEF), on an Orthotropic non-Linear Formulation [9]. It includes in its algo-rithmic framework the element formulations described on the item 2.
4. Computational program validation
From the computational program adopted for calculation support a beam 1.80 m height and length and 0.20 m thick was analyzed, Figure 4.a. It was casted using C 20 concrete, reinforced by two CA-50 steel bars with diameter equal to 6.3 mm. The beam has undergone a couple of loads applied on its top, in equidistant points to 0.30 m from to the
(12)
1
2
1
2
2
).
0
.
25
2
.
1
(
G
E
E
E
E
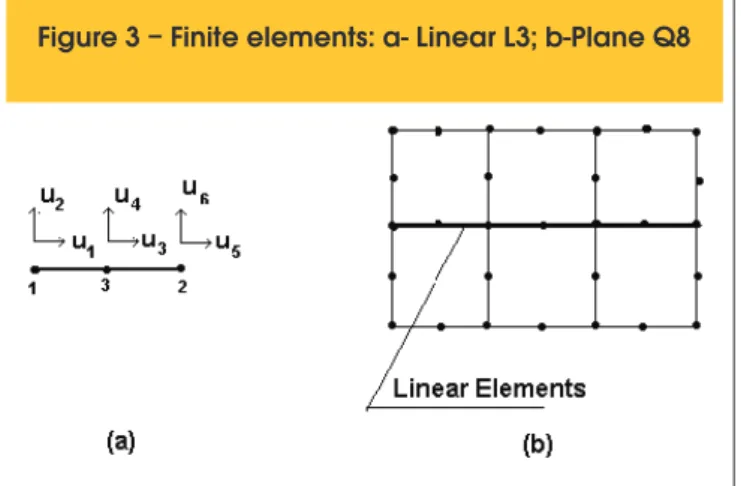
In the present analysis it was adopted inite elements in their iso -parametric versions and quadratic approximation.
The region of the mass of concrete will be simulated from the eight nodal point quadrilateral plane elements, Q8, Figure 3.b.
The steel behavior is considered elastic perfectly plastic. Because of the great transverse lexibility of the reinforcement steel bars it is just considered its axial stiffness which is simulated by three nodal point linear elements, L3, Figure 3.a. Thus, the referred stiffness matrix shall be expressed by:
(13)
2
1
1
-1
1
0
1
0
1
2
L
AE
K
where “E” represents the steel Young modulus, and it is considered, in this work, equal to 210000 MPa. “A” is the cross section area of the reinforcement steel bars, for each one-dimensional element. “L” represents the length of one-dimensional inite element.
3. Computational Support
In order to obtain the results focused on the fulillment of the objec -tives of this work, it was employed the “software” nonlinear Constitu
-Figure 3 – Finite elements: a- Linear L3; b-Plane Q8
span center, each one presenting intensity equal to 200 kN. The results were compared with those obtained from stress diagrams proposed by Forster and Stegbauer [5], Figure 4.b. It is possible to observe the good agreement between the curves, except near the upper edge, for which, it was noted discrepancies, including, in relation to the stress signal.
5
Analyzed models
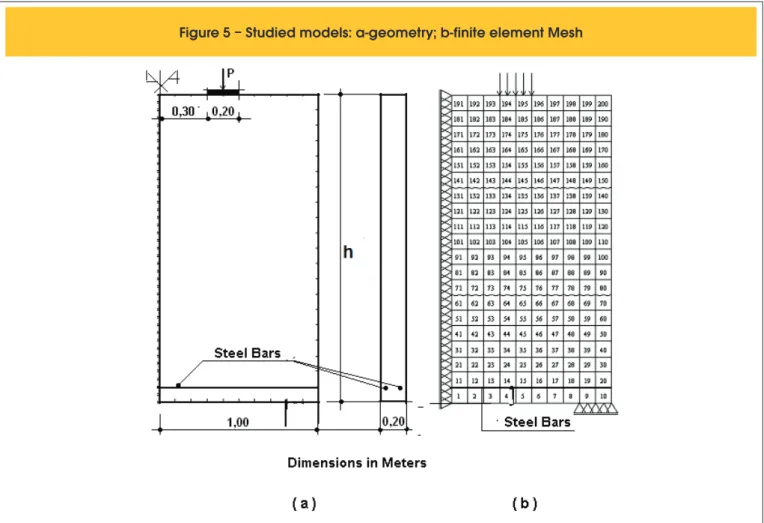
The models studied constitute single deep beams 2.00 m width and 20 cm thick, casted in C 20 concrete, reinforced with CA-50 steel bars, placed along its lower edge, Figure 5.a.
The structural member is subjected to a gradual loading process by the action of a couple of equal intensity concentrated loads. The loads are applied simultaneously, on the top of the beam, in equidistant points 0.40 m from its span center, on plates 0.20 m x 0.20 m dimensioned. In the loading process the load intensities evolves from zero to a inal value deined, in some cases, by local concrete failure, and in other cases, for convenience, determined by the particular observed behavioral aspect.
The analysis was performed considering six cases, differentiated among themselves by the reinforcement cross-sectional area, by load intensity and by the beam height, as detailed in table 1. Due to the structural symmetry, the problem domain might be de-ined from the rectangle sector whose base is equal to half length of the beam span, and whose height is equal to the structural member height. Its discretization was held based on the adoption of square
plane elements, and linear elements, both 0.10 m dimensioned, re-sulting in the inite element mesh similar to that illustrated in Figure 5.b. In all cases the mesh is composed by ten linear elements. On the other hand, the variety of the beam heights resulted in the total diversity of plane elements which was 140, 160, 180 and 200, for 1.40 m, 1.60 m, 1.80 m and 2.00 m height beams, respectively. The analysis was carried out according to the “Plane State of Stress “.
Figure 5 – Studied models: a-geometry; b-finite element Mesh
Table 1 – Characterization of the studied cases
Case
Steel Cross Sectional
2
Area (cm )
Heigth
(m)
Load
(kN)
A
0,16
2,00
900
B
0,40
2,00
900
C
0,63
2,00
900
D
0,63
1,80
630
E
0,63
1,60
450
6. Results and discussions
The results showed that, the “A”, “B” and “C” cases, distinguished from each other solely by the reinforcement, presented similar
mechanical behavior. In these cases, the internal instability of the structural member was triggered at the extent that the load inten -sity hit the value around 900 kN. The equilibrium coniguration at this level of loading may be represented graphically from the stress
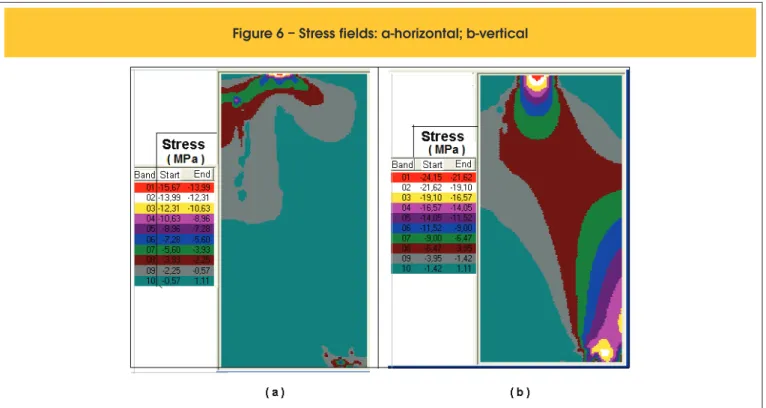
Figure 6 – Stress fields: a-horizontal; b-vertical
and displacement ields presented in igures 6 and 7.
By examining the ield of horizontal stresses, igure 6, it may be ob -served, as already reported in [10], the development of tensile stress-es in the upper edge at the span center, rather than comprstress-ession stresses, contrary to the meaning of the scientiic literature on the sub -ject, based on the theory of elasticity. This response pattern is corrob -orated by the morphology of vertical displacements ield, igure 7.b, sinking more pronounced in the region beneath the load, of course, resulting on a down-oriented concavity curvature, in the vicinity of the span center, to the horizontal line at the top of the beam, igure 8. The curves on igure 9 conirm the incidence of such tensile stress -es. Note that, just beneath the top line of the beam surface, the tensile stresses change to compressive stresses, assuming maxi -mum value of, approximately, 4.7 MPa, at the point distant 1.80 m
from its lower edge. It turns out that, in point at 1.20 m of that edge, the stress assume null value egain, thereafter to be tension, reach-ing value of 1.1 MPa at a distance of 1.00 m from both edges. It represents, therefore, the establishment of two neutral axys at the section under consideration.
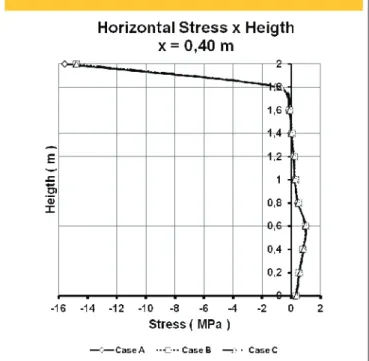
To the section localized 0.40 m from the span center, it is observed that the maximum horizontal stress compression focuses on the area placed immediately beneath the load application surface, Figure 10. Its intensity is around 15.7 MPa. There is even the occurrence of maximum horizontal tensile stress in the point 0.60 m distant from
Figure 8 – Top of the beam horizontal
line deformed configuration
versus
heigth at the span center section
Figure 10 – Horizontal stress
versus
heigth at
the section beneath the load aplication surface
the lower edge, with magnitude of, approximately, 1.0 MPa, while on the lower edge the tensile stress intensity is of, approximately, 0.35 MPa. The comparison of these values induces the reader, at irst instance, to deduce that the former point is more strainned than the latter. However, analyzing the stress evolution with load, Figure 11, one note that, for the inal load intensity, the point of the lower edge is already at the descended branch of the curve, while the point at 0.60 m from that edge remains in its ascendant branch.
In addition, analyzing, thoroughly the vertical stress ield, igure 6.b, one testify, as expected, concentration of stresses at the load application regions and at the support vicinity. More speciic re -sults of vertical stress distribution along the beam upper surface, igure 12, elucidate how drastic is such stress concentration, when it turns out that all the stress is restricted, practically, to the load immediate vicinity, reaching in its center, intensity of 25 MPa. In a fair agreement with the stress envelope adopted in this work, this value, that is 25% higher than the concrete uniaxial compressive
strength, is very close to the peak stress to the analyzed point, which is subjected to biaxial compression state, because, as re -ported in the previous paragraph, in its perpendicular direction, on a same way, the mass of concrete is compressed.
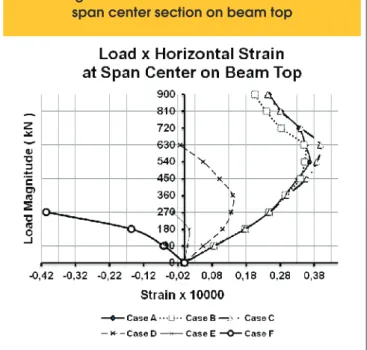
And more, it may be noted that, to the extent that the point considered departs from the horizontal edges of the beam along the thread that interconnects the support and the load introdution region, occurs the spread of the stress concentrations reported above, Figure 6.b. The horizontal stress evolution curves with loading for the “A” “B” and “C” cases referring to the point of the upper edge at the span center, igure 13, point out that the maximum value is reached when the intensity assume a value in the range between 540 kN and 630 kN, giving margin to the deduction of dealing with peak tensile stress at failure. However, the analysis of load-deformation curves related, igure 14, reveals that the horizontal strain, initially increasing, precisely from this loading level, begin to decrease, characterizing the phenomenon that in the scientiic literature is known as “snap back”.
To explain the “snap back” phenomenon, consider the truss especi -men, igure 15, whose ends “C” and “D” are restrained for any trans -lational displacement. Upon the load “P” action, whose intensity is,
Figure 12 – Vertical stress distribution along
the longitudinal direction on beam top
Figure 13 – Horizontal stress
versus
load
at the span center section on beam top
Figure 14 – Load strain curves at the
span center section on beam top
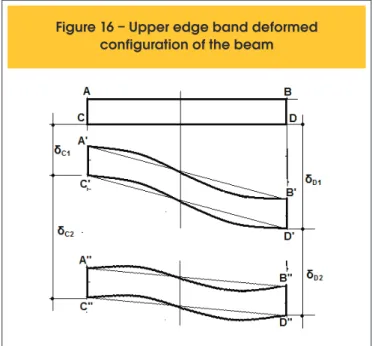
progressively, increased, the articulated “A” point, that is attached to the truss body, moves toward “B” point, and, concomitantly, the “AC” and “AD” bars suffer progressive shortening. If, once “A” point having hot “B” point, and the load intensity continues increasing, rollback oc-curs, and then the strain gradient changes to stretching deformation. In reference to the cases that are being studied, notice the hori-zontal band of the beam, closer to its upper surface, in the stretch between the span center and the load application point, Figure 16. In each one of load increments, on the initial stage of loading up to the threshold at which the load magnitude hits a value between 540 kN and 630 kN, the deformational pattern is such that “C” and “D” points move in the vertical direction by δC1 and δD1 displacements,
respectively, in such a way that δC1 < δD1. In the increments of the
consecutive stage, C’ and D’ points suffer displacements of δC2 and
δD2, respectively, on this case, however, with δC2 > δD2. Thus, on
the irst stage the deformational reality contributes to the curvature of that band, in the vicinity of AC, by down side oriented concave -ness, whereas, in the next stage, it presents contrary trend. This response is due to the fact that the displacements at any point of the beam result in part from mass deformations, and, on the other hand, from bending strains. Of course, while the displacements of the beam span center are more inluenced by bending strains, to those located below the load, the higher contribution is associated with mass deformations, and each of these strain parcels evolves according distinct patterns in each of the above loading stages. From closer analysis of the curves on igures 13 and 14, it follows that the occurrence of horizontal tensile stress as well as the “snap back” phenomenon, that is reported in this paper, are intrinsic phe-nomena by the deepest beams, because, they are evidents on those beams by height from 1.80 m and do not manifest on beams by height up to 1.40 m.
7. Conclusions
This work refers to the analysis of mechanical performance on re -inforced concrete deep beams.
Figure 16 – Upper edge band deformed
configuration of the beam
The inherent tasks were carried out on six cases, differentiated among themselves by the adopted reinforcement, by the beam height and the load magnitude.
In each of the analyzed cases the structural member was sub -jected to loading process in which the load magnitudes evolved in increments, from the initial null value up to a inal value deined, in some cases, by localized concrete crushing failure and, in oth-ers cases, by convenience determined according observed special behavioral aspect.
From the numerical analysis, it was found that, for the beams of height equal to 2.00 meters, the internal instability of the struc -tural member was triggered when the load magnitude assumed the value close to 900 kN.
The results obtained showed that the reinforcement rate variation did not result in signiicant change in the overall performance of the beam.
Moreover, it was observed that the beam failure started from the crushing collapse of concrete in point immediately beneath the load application surface, for a vertical stress compression whose magnitude is close to 25 MPa. This value, that is 25% higher than the uniaxial compressive strength of the material, is consistent, as the adopted stress envelope, considering, in particular, that this point is subjected to biaxial compression state of stress, since in the horizontal direction, it is subjected to a stress of magnitude close to 15.7 MPa, also in compression.
On the other hand, for the vertical section that passes through the load application point, the maximum horizontal tensile stress for the inal load value occurs on the point at 0.60 m from the lower edge of the beam. However, from an examination of the horizontal stress distribution along the height evolution, during the loading process, it was found that the point on the lower edge presents strain of greater magnitude, and therefore, lies in more advanced stage of deformation.
May one to report that, rather than horizontal stress compression, it was noted the development of tensile stresses on the upper edge of the section at the beam span center, in addition to the manifes-tation of the phenomenon known as “snap back”, the latter charac -terized by consecutive shortening after distention during monoton-ic loading process. It was proven, including, that such occurrences are intrinsic, exclusively, to the highest beams, considering that it is not manifested on those of height up to 1.40 m.
8. Acknowledgements
This report is part of a research work on the numerical simulation of the swelling effect due to alkali-aggregate reaction supported by the Fundação Coordenação de Aperfeiçoamento de Pessoal de Nível Superior – CAPES and by the Pró-Reitorias de Pesquisa da Universidade Federal do Rio Grande do Norte – UFRN and by the Universidade Federal de Pernambuco – UFPE This support is gratefully acknowledged.
9. References
[01] Arnesen, A. Sorensen, S.I. and Bergan, P.G. Nonlinear Analysis of Reinforced Concrete. Computers & Structures, Vol. 12, 1980, pp 571-579.
Structural Engineering, ASCE. Vol. 114, n. 7, 1988, pp. 1449-1466.
[03] Bangash, M.Y.H. Concrete and Concrete Structures: Numerical Modeling and Application. Elsevier Applied Science. London, 1989.
[04] CEB-FIP MODEL CODE Comitê Euro-Internacional Du Beton, 1990.
[05] Förster, W. and Stegbauer, A. Vigas – pared: Gráicos para su cálculo. Ed. Gustavo Gili, Barcelona, Espanha, 1975.
[06] Hognestad, E. A Study of Combined Bending and Axial Load in Reinforced Concrete Members. Bolletin n. 399, Engineering Experiment Station,University of Illinois, Urbana, Illinois, Vol. 49, n 22, 1951.
[07] Hu, H.T. and Schnobrich, W.C. Non Linear Analysis of Cracked Reinforced Concrete. Am. Concr. Inst. Struct. J., Vol. 87, N. 2, 1990, pp. 199-207.
[08] Kupfer, H.B. and Gerstle, K.H. Behaviour of Concrete under Biaxial Stresses. Journal of Engineering Mechanics, Vol. 99, n. 4, 1973, pp. 853-866.
[09] Kwak, H.G. and Filippou, F.C. Finite Elements Analysis of Reinforced Concrete Structures under Monotonic Loads. Report UCB/SEMM-90/14, Berkeley, Califórnia, 1990.
[10] Madureira, E.L. Simulação Numérica do Comportamento Mecânico de Elementos de Concreto Armado Afetados pela Reação Álcali-Agregado. Doctoral Thesis. Universidade Federal de Pernambuco, 2007. [11] Madureira, E.L. and Ávila, J.I.S.L. Simulação Numérica
do Desempenho Mecânico de Chapas de Concreto. 51o Congresso Brasileiro de Concreto. Foz do Iguaçu
– Paraná – Brasil, 2009.
[12] Ngo, D. and Scordelis, A.C. – Finite Element Analysis of Reinforced Concrete Beams. Journal of ACI, Vol. 64, n. 3, 1967, pp. 152-163.