NEW PRODUCT DEVELOPMENT PROJECTS EVALUATION UNDER TIME UNCERTAINTY
Thiago Augusto de Oliveira Silva Leonardo P. Santiago*
Lab. de Apoio à Decisão e Confiabilidade (LADEC) Departamento de Engenharia de Produção / EE Universidade Federal de Minas Gerais (UFMG) Belo Horizonte – MG
[email protected] [email protected]
* Corresponding author / autor para quem as correspondências devem ser encaminhadas
Recebido em 10/2008; aceito em 07/2009 Received October 2008; accepted July 2009
Abstract
The development time is one of the key factors that contribute to the new product development success. In spite of that, the impact of the time uncertainty on the development has been not fully exploited, as far as decision supporting models to evaluate this kind of projects is concerned. In this context, the objective of the present paper is to evaluate the development process of new technologies under time uncertainty. We introduce a model which captures this source of uncertainty and develop an algorithm to evaluate projects that incorporates Monte Carlo Simulation and Dynamic Programming. The novelty in our approach is to thoroughly blend the stochastic time with a formal approach to the problem, which preserves the Markov property. We base our model on the distinction between the decision epoch and the stochastic time. We discuss and illustrate the applicability of our model through an empirical example.
Keywords: decision under uncertainty; dynamic programming; Monte Carlo simulation; project management; R&D projects.
Resumo
O tempo de desenvolvimento é um dos fatores-chave que contribuem para o sucesso do desenvolvimento de novos produtos. Apesar disso, o impacto da incerteza de tempo no desenvolvimento tem sido pouco considerado em modelos de avaliação e valoração deste tipo de projetos. Neste contexto, este trabalho tem como objetivo avaliar projetos de desenvolvimento de novas tecnologias mediante o tempo incerto. Introduzimos um modelo capaz de captar esta fonte de incerteza e desenvolvemos um algoritmo para a valoração do projeto que integra Simulação de Monte Carlo e Programação Dinâmica. A novidade neste trabalho é conseguir integrar meticulosamente o tempo estocástico a uma estrutura formal para tomada de decisão que preserva a propriedade de Markov. O principal ponto para viabilizar este fato é distinção entre o momento de revisão e o tempo estocástico. Ilustramos e discutimos a aplicabilidade deste modelo por meio de um exemplo empírico.
1. Introduction
The main goal of project management is to assure that the project achieves the best possible performance, considering its proposed objectives. Activities that corroborate to such purpose include resource management, activities scheduling, and decision-making support throughout the project’s execution. In particular, the modern approach to project management deals with uncertainty and, therefore, assumes that projects will not be developed exactly as expected. Faced with such reality, decision-makers evaluate the risks inherent to the project and, based on those, define the best course of action – instead of merely trying to predict the precise consequences of each activity and/or the precise value of the input or output parameters.
The development of new products and technologies is characterized by uncertainties that are inherent to the project. Examples of such uncertainties include the outcome of each development activity, the market’s reaction to the project’s result, the development costs, the project’s feedback and/or the development time (Huchzermeier & Loch, 2001). Uncertainties regarding the development time are particularly important because they can directly impact the project’s costs and payoff, as well as market demands.
Focusing on the management process of new products/technologies, the present paper has three goals: (i) develop a decision supporting model which captures the impact of the development time uncertainty, (ii) propose an algorithm, and (iii) discuss, by means of an empirical example, the impact of development time uncertainty on project’s value.
Before incorporating uncertainty in our analysis, a note on the difference between the concepts of uncertainty, ambiguity, and complexity is in order at this point. According to Pich et al. (2002), uncertainty is characterized by the random nature of a known parameter, while complexity is related to the difficulty of analytically reproducing the relations among key variables in the process. Ambiguity, in turn, is related to the lack of knowledge of the environment, in terms of variables and relations among them. Ambiguity and, sometimes, complexity are frequently denoted unforeseeable uncertainties, and some authors refer to them as unknown-unknowns (unk-unk) (e.g., Pich et al., 2002; and Sommer & Loch, 2004). The development of a new technology is frequently characterized by these three kinds of features, namely uncertainty, ambiguity, and complexity.
Based on such difference, Pich et al. (2002) define the concept of adequacy of the available information about the state of the world and action effects. In addition, they classify adequacy as far as transition dynamics, payoff and information is concerned – all of which are extremely important in the choice of the most adequate approach to project management. Each of these three concepts is detailed below.
Transition adequacy is related to the interaction among the manifold possible events and the outcomes of a project. It is modeled through an approximate function ϕ
( )
⋅ , which will be adequate for the project if it is capable of describing all possible relations for a specific event. For instance, in the case of a technology development project the transition function will be adequate if it is capable of reproducing the effect of each decision taken throughout the development project in the technology’s performance.Such concepts are important for project analysis since it is only possible to use optimization techniques as a strategy to define project management policies if one is dealing with information adequacy. Otherwise, due to the lack of information, it would not be possible to measure the payoff, the risk, nor even to plan or compare policies. Thus, the management of projects through optimization techniques has strong limitations in a context of information inadequacy (Pich et al., 2002). In this paper, we guarantee information adequacy by offering a suitable approach to deal with the development time uncertainty.
Several works have been developed in the field of project management under uncertainty, and especially on new product and technology development projects. In general, such works tackle important questions regarding modeling and managerial intuition in that area. However, in spite of the fact that different models have been developed to analyze specific aspects of new product development projects, the great majority of them does not incorporate development time uncertainty in the analysis together with other uncertainties such as development costs, market payoff and development (technical) success.
As an example, we can cite the management of product development projects with multiple alternatives. Weitzman (1979) presents a model that provides an optimal search policy among several alternatives of sequential enterprises. The model can be applied, for instance, in technology development projects where alternative approaches, distinct with regard not only to costs but also to payoff, are sequentially tested. The main result is to show that, for this kind of problem, the policy of first exploring the alternatives that involve greater risk is optimal. Although enlightening, such result is strongly linked to the assumption that payoffs are independent and produced only by the end of the search. Besides that, the time to explore is considered constant. This fact motivates the analysis of the impact of the time variability in this kind of search (project development).
Childs & Triants (1999) present a model to evaluate research and development projects which is capable of determining the optimal investment policy. The model considers the sequential or parallel development of alternatives or concepts and the possibility of learning throughout the development either within a project/activity (learning by doing), or among different alternatives (collateral learning). In this research the authors demonstrate that the increase of a specific project uncertainty increases the value of the development program (i.e., various alternatives). Besides, the project value also increases when the alternatives are similar in terms of performance – that is, when there is no clearness in the definition of the best option. According to the authors, in the presence of competitors, the parallel development policies are better evaluated and the use of acceleration strategies becomes more frequent. As in the work previously described, development time uncertainty was also not modeled in this work.
Ding & Eliashberg (2002) also study management problems in projects with multiple alternatives – which, in this case, are developed in parallel. The proposed model presupposes costs equality, payoff and probability of success among all development alternatives. In addition, the authors assume development time is deterministic, besides considering that there is no additional payoff when the development of more than one alternative succeeds. As a consequence, the answer provided by this model is not fully satisfactory since the authors offer an optimal amount of alternatives that should be approved in each phase of the development process.
markets. Although the model does not focus on managing the whole development process, it offers optimal decisions regarding the exact moment for freezing the concept definition of a product, which is relevant as it is directly related to project’s payoff.
Yang (2005) formulated a model for investment decision when accelerating the phases a project taking into consideration additional costs and the payoff achieved in environments of budget uncertainty. In this case, the project’s payoff was considered decreasing as a function of the deterministic launching time.
The effects of the development time in the success of a technology development project have been widely studied in the literature for diverse types of industries and markets. However, the great majority of the literature does not integrate the impact of time uncertainty into the valuation process of a new technology. One can mention, for instance, the work of Chen et al. (2005), which, through a model and analysis of empirical data proved that velocity for the market is strongly correlated with the project’s success. The development time becomes particularly relevant when new markets are explored and when these are highly dynamic.
Shina & Noble (2005) dissociate the product’s development time from the moment of launching it into the market. Based on empirical data analysis they draw attention to the relevance of factors such as company size, resources allocation, market characteristics, competition, and evidence of relevant gains, to explaining the moment of market entrance of the studied companies. This work, however, is based on a survey analysis and is different from ours to the extent that we are interested in modeling the impact of time in the valuation of the project and in the optimal investments. Thus, we are not only identifying factors that have an impact in the launching time, but also incorporating them into our decision support approach.
It is important to stress that in spite of the correlation between speed to market and the success of the project, this will not always occur. A premature introduction of a product into the market might not reflect (positive) profit in case the sales volume is insufficient to generate positive cash flow at the beginning of the product’s life cycle. In other situations, future gains, produced by being a pioneer (first-mover), may be sufficient to overcome possible losses at launching.
In some cases, it might be even necessary to consider, besides the launching moment and the technology’s performance, the effect of the interaction between these two variables in the project’s payoff. For instance, in some cases, the negative impact of time can be overcome by superior development performances (even in the case of ample competition, the higher the performance reached, the bigger the market share conquered).
Time uncertainty, nevertheless, is related not only to development costs, but also to the payoff of a project. For some markets, models that do not consider the influence of time uncertainties are inadequate in terms of payoff in the sense defined by Pich et al. (2002).
A real option is similar to a financial option. That is to say, when acquiring a real option of investment the decision-maker will have, in a posterior moment, the right, but not the obligation, to exercise his/her option (to invest) and may do so in case it is the alternative of highest payoff. Real options theory combines the characteristics of the irreversibility of an investment, uncertainty on future payoffs, the impact of time, and the interactions among those in order to guide managers in making an optimal decision (Dixit & Pindyck, 1994).
Huchzermeier & Loch (2001) developed a model based on Real Option theory for valuating technology development projects. Besides the traditional options of abandoning or continuing the project under development, such model considers the option of interfering in the course of the development with the purpose of reaching better performances. This model was further improved by Santiago & Vakili (2005) and applied in the development of the Adaptive Optics Scanning Laser Ophthalmoscope (AOSLO) by Santiago & Bifano (2005).
Huchzermeier & Loch (2001) also analyze the influence of project’s development time uncertainty on the option’s value. Nonetheless, the authors consider a simplified model, devoid of technological uncertainty, and regard the possibility that the occurrence of a deterministic delay could be linked to a reduction in the project’s payoff, without relating such reduction neither to the level of development performance achieved nor to the development cost.
More recently, Crespo (2008) considered the model introduced by Huchzermeier & Loch (2001) and proposed a simulation based approach to deal with the development time uncertainty, when valuing a technology that generates energy from alternative sources. The model is concerned with the economic impact of several uncertainties in the project value, which is achieved through a heuristic procedure. Although relevant to practice, one important limitation of this approach is that it is not able to provide managerial guidelines throughout the development process.
In spite of the evident relevance of development time uncertainty’s impact in the assessment of technology development projects, the majority of models found in the literature focus either on the endogenous uncertainties related to the product’s performance along the development process or on the exogenous uncertainty that impacts the market payoff. In this sense, this article contributes for a better understanding of the impact of time in product development, since it incorporates the time dimension in a formal structure for decision-making.
2. Formulation
The model that we will next describe refers to the management of a technology development project characterized by sequential decisions and a terminal payoff that depends on the performance of the development process and the moment in which the product or the technology will be ready to be commercialized (representing the end of a successful development). The problem consists in a process of sequential decisions in which uncertainty plays a fundamental role. The payoff of this project is obtained in a future finite stage, although uncertain. At each decision moment managers should choose the best action so as to balance its costs and the future expected gain. We modeled this problem as a sequential decision process and used stochastic dynamic programming in order to find the optimal decision at each decision stage.
a. State description
Each stage of the finite sequence of decisions (revision) that occur before each phase of development, and that are defined before the beginning of the project’s execution, is associated with a state, represented by the performance reached and by the time epoch in which the decision is being taken. These parameters are stochastic and we consider them as independent.
Specifically, at each revision stage j, ( j=0,...,N ), the project is characterized by a development state that we represent as ( , )t
j j j
y = x τ , where xj is the level of development that one hopes to reach by the end of the project, after the completion of the j first stages of the project, and τj is the time epoch of the revision.
Without lost of generality, we assume that τ0=0 and that xj are random variables that are
independent among themselves and independent of the revision epoch (τj), for each revision
j. In a technology development project this assumption is reasonable as the performance of a development stage is related to the scope of each stage and to the decisions taken throughout the development project, and not to the duration of each phase. Despite time’s relation to the resolution of uncertainties, the expected duration of each stage is sufficiently short to allow us to assume that there is no learning that may be used in the stage itself. Moreover, learning is usually incorporated into subsequent projects.
b. Control Options
Based on the information of the present stage the decision team should choose among the following managerial actions:
• Continue – Which means to follow the project as initially planned.
• Abandon – The managerial action corresponds to the project’s interruption. In this case, there will be no further costs, nor gains.
c. Transition Dynamics
After each decision, the project enters the subsequent development stage that will take it to a new revision. The control option will impact the project’s state in the next revision. For instance, when choosing to improve the project the team expects to reach states that on average have better performance. However, the control policy will not determine exactly the state of the project due to uncertainties with regard not only to level of development, but also to the duration of the phase. Thus the next state will be a function of the actual state, of the applied control, and of the development uncertainties (ξj).
(
)
1 , ,
j j j j
y+ =ϕ y u ξ (1)
It is important to stress that since the next state depends only upon the current state, which is represented by independent random parameters, the decision process can be modeled as a Markov Decision Process. Note that, in spite of the stochastic time, the decision stages are independent upon it. This fact allows us to model the problem as a Markov Process. In the scenario captured in this paper, the state transition will be additive, and depends on the actual state, the control applied and the uncertainties.
1 1 , , j j
j j j
j
j j
j j
j
Stop u abandon
y y u continue
t
I
y u improve
t ω ω + + ⎧ ⎪ = ⎪ ⎪ ⎛ ⎞ ⎪ =⎨ +⎜ ⎟ = ⎝ ⎠ ⎪ ⎪ ⎛ + ⎞ ⎪ +⎜ ⎟ = ⎪ ⎝ ⎠ ⎩ (2)
In the above equation
(
, 1)
t j j tjξ = ω + , where ωj is a random variable that represents the development uncertainty and tj+1 is a random variable that represents the duration of the
next phase k= +j 1. In addition, Ij is a constant of appropriate dimension, which represents the increase in the expected development due to the “improve” control. It is easy
to see that at each revision stage j the time epoch will be given by 1 1 j j k k t τ − =
=
∑
, where( 1,..., )
k
t k= N are independent random variables that represent the duration of phase k.
d. Payoff Function
The project’s payoff will be given by the function Π(yN)= Π(xN,τN), which represents the expected value of a series of profits yielded by the product or technology during its commercial life cycle. The function’s value will depend upon the state reached by the project after the last development stage. That is, the payoff depends upon the moment of launching and the performance reached. For a given τ =N T, we suppose the payoff function Π(xN, )T is increasing in xN and that, for each performance level reached at the end of the project
N
commercial life cycle. In certain scenarios, the payoff might even increase with time – for instance, assume a market that is not ready for a certain technology, which depends on other technologies to be developed or assume a commodity market for which prices have a tendency to increase over the next years.
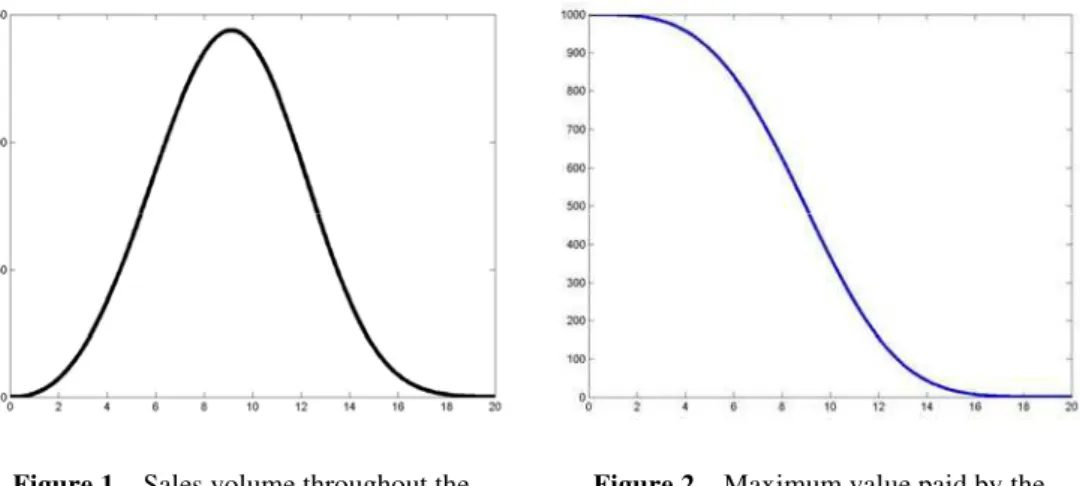
The market size varies throughout the product’s life cycle. It starts with low values and increases until a maximum wherefrom it decreases until the extinction of the product, in a dynamic similar to that of graphic of Figure 1. The sequence of profits is directly related to the size of the market, but varies also with production costs and with the product’s price.
Figure 1 – Sales volume throughout the product’s life cycle as a function of the initial
moment of commercialization.
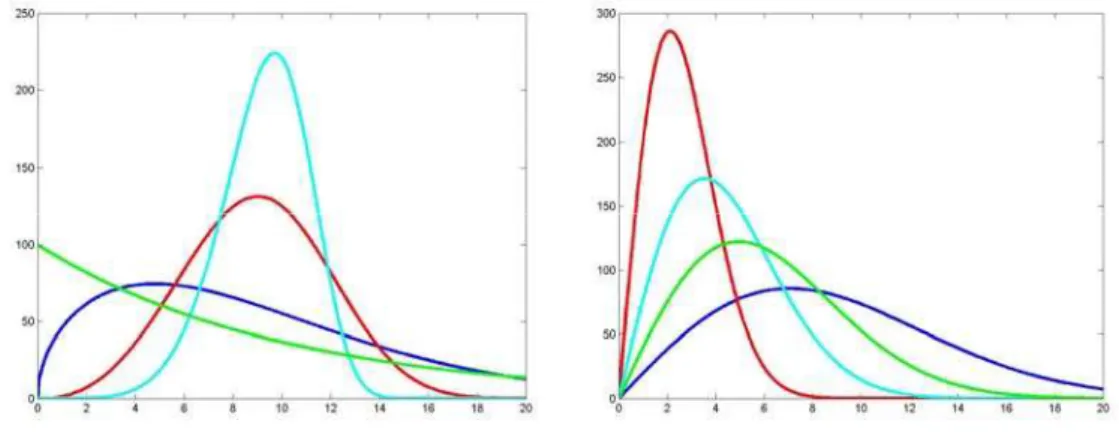
Figure 2 – Maximum value paid by the market as a function of the initial moment of
commercialization.
Let V t( ) be the market size at time t, then, if L t( )=P t( )×V t( ), with P t( ) being the contribution margin for each unit of the product in a time t, L t( ) is the overall contribution to the profit at time t. In this way, the premium value paid by the market will be given by (3) and graphically represented in Figure 2.
( )
[ ] ( ) it
Fτ M mτ P t V t e dt
τ
∞ −
= − =
∫
× × (3)Where i is a discount rate continuously compounded. The value of the payoff function Π ⋅( )
for a state yN, reached at the end of the project, will be given by a function that depends not only on the maximum value paid by the market M( )τ , but also on market’s level of requirement, represented by R( )τ . In addition, m is considered to be a baseline payoff for the product.
In this paper, we will consider the case where the market will pay the maximum value M( )τ
product at time τ into the market if xN ≥R( )τ ; otherwise, it will receive a baseline payoff m . Thus, the payoff function is given by:
(xN,τN) Fτ P x( N R(τN)) m
Π = × ≥ + (4)
In the above equation, Fτ is given by equation (4) for which P t( )=P0×egt (where g represents the logarithm value of the market growth rate and P0 is the contribution to the payoff at the initiation of commercialization). In addition, we consider R( )τ to be normally distributed with mean (µ) and variance (σ2). In order to simplify, we consider that g=i, that is, the market’s growth rate, is equivalent to an appropriate discount rate
(
) ( )
1( )
( )
k
t
k a
V t = V×k a × t a − ×e− (5)
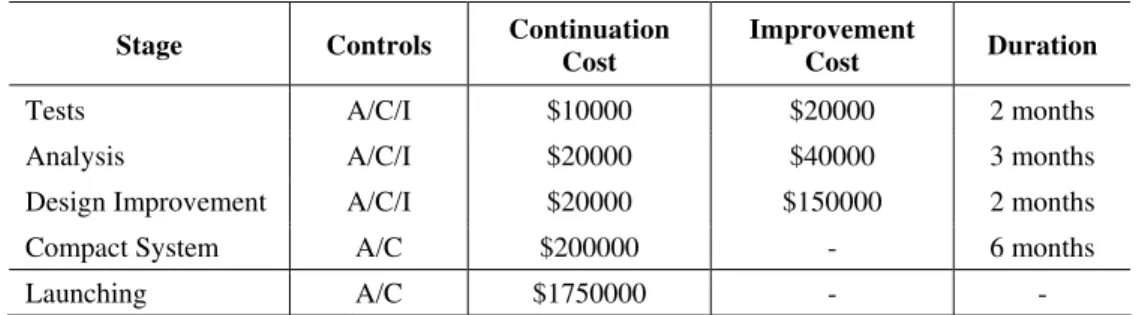
The sales volume after launching V(t) is defined by the equation (5), where k and a are, respectively, form and scale parameters. The form parameter, as the name itself conveys, alters the curve format, as can be noted through the variation V(t) as a function of this parameter, represented in Figure 3 – it is related to the symmetry among the stages of the commercial diffusion process. The increase in the scale parameter “stretches” function V(t) and is related to the variability of volume values among the time epochs, as shown in Figure 4. The constant V represents the largest volume that the market will absorb during the product’s life cycle.
Figure 3 – Variation of V(t) as a function of form parameter ( k ).
Figure 4 – Variation of V(t) as a function of scale parameter ( a ).
From the above definitions we can rewrite (3) as:
( )
0
[ ] ( ) ( )
k
a Fτ M mτ P V t dt M m e τ
τ
∞ −
= − =
∫
× = − × (6)( )
( , ) ( ) exp ( )
k N
N N N
x M m P x R m
a τ
τ −
Π = − × × ≥ + (7)
e. Development Costs
Development costs may vary at each phase, rendering the model more adherent to real situations, where costs are usually increasing in time throughout the phases. On the other hand, we assume that such costs do not depend upon the development state of project xj on
each review stage, but will depend upon the duration of phase k (tj+1). Thus the cost may be
represented by:
0, ( , ) ( , ),
( , ) , j
k j j j k j j
j k j k j
u abandon
C y u K t u u continue
K t u a u improve
⎧ = ⎪ =⎨ = ⎪ + = ⎩ (8)
Function Kj( )• represents the cost of phase k following stage j (j= −k 1), and varies with
the duration of the phase, represented by tk. An additional expenditure αk will always occur when the former decision was “to improve”.
f. Dynamic Programming Model
Let G y uj( j, j) be the expected value function when control uj is applied, at the state yj, which is represented by the following equation:
1 1 1 1 1
0, ( , )
( , ) ( ) ,
j j
j
j j j
t j j j j j j
u abandon G y u
otherwise E + Eω C+ y u V+ y+ t +
⎧ = ⎪⎪ = ⎨ ⎪ ⎡ ⎤ ⎡− + ⎤ ⎪ ⎣ ⎣ ⎦⎦ ⎩ (9)
In the above equation Vj+1 represents the project’s value at decision stage j+1. It is evaluated as:
( ) m ax ( , )
j
j j j j j
u
V y G y u
∈Θ
= (10)
In the above equation, Θ is the set of available controls (Θ= {Abandon, Continue, Improve}). Finally, when incorporating the boundering condition at the commercialization time, VN(yN)= Π(yN), one can write the dynamic programming model as:
Objective: maxV0
S.T.: VN(yN)= Π(yN)
( ) m ax ( , )
j
j j j j j
u
V y G y u
∈Θ
3. Computational model
Since duration time of each phase is a continuous random variable it is impossible to map all of the possible states to be reached at the end of the development process. This fact motivates the technical combination of Monte Carlo simulation and the dynamic programming algorithm. In order to treat the problem we developed a recursive algorithm, combining both techniques, so that the value of the project (V0) can be estimated, and optimal managerial actions be determined.
One of the great difficulties in approaching a problem through optimization techniques based on simulation (simulation based optimization) lies in the development of an efficient algorithm (Fu, 2002). As we will subsequently see, the complexity of the developed algorithm is exponential. We let the development of an efficient algorithm to future work, since the focus of this paper lies in the presentation of the model and the analysis of specific situations.
The algorithm consists, for each revision stage, of predicting future stages, by generating sample paths according to the distribution of development time, until the end of the project is reached. From this final stage, one backtracks calculating the value of the project and such procedure will be repeated (for each stage) a sufficient number of times in order to obtain the expected value, according to an acceptable level of confidence (related to an error).
Assume r the number of values generated for the each (random) time of a certain phase and N the number of revision stages of the project. Keeping r constant, the computational time increases exponentially with the number of decisions and, for a constant N, the algorithm grows polinomially in r. Some features of the R&D problem and also from our formulation were useful to improve the algorithm performance. The first feature is concerned with the state performance independence at each revision stage. That is, the random variables that characterize the state performance (xj,τj) are independent at each stage j. This fact implies that the duration of each review phase is independent and identically distributed for all states.
This independence allows the sampling procedure at each review epoch to be done only once at each visit the algorithm does at this specific stage. In other words, the simulation procedure to estimate the value of state xj is done simultaneously for all states at stage j, which saves computational effort to obtain the random variables that captures the time uncertainty.
Another feature of the model used to improve the computational performance is the multi period nature of the decision process. The optimal solution for each state at a future review stage is important and, therefore, taken into account when obtaining the optimal action at the present stage. However, managers would not make a commitment to act at a future stage according to the recommendation provided today. This fact is due to the need to revise the input information at each revision epoch and, consequently, reevaluate the whole project and provide a “new” optimal action. Therefore, managers should be more concerned with the optimal solution (value and action) of the current decision epoch. We consider this fact and provide optimal managerial action only for the present stage/stage.
However, the algorithm will continue to have exponential complexity and this will be only appropriately treated by developing a new algorithm which explores analytical properties of the problem.
Algorithm1 represents a recursive procedure for the computing of the value of the project for each possible state at revision stage, according to equation (10). The project’s expected value with respect to the duration of the phase is estimated through simulation, as it is a continuous random variable. At each replica s (s=1,...,r), a value for the duration of the current phase is generated according to a distribution previously defined ( , )
k
k k
D t στ . The time duration t of
the next review stage is sampled (step 3), in addition the expected value of the project, given ω (technology uncertainty) is computed at t (step 7). After this stage, the value of the project at each state is given by the largest expected value obtained from the application of one of the available controls (step 12). The function outputs a vector containing the expected value of the project for each state of the revision stage.
ALGORITHM Value rev T
(
, p)
1: For s = 1 to r
2: Sample t from ( , )
k
k k L t στ
3: Tf ←Tp+t
4: Vf
[ ]
s =Value rev(
+1,Tf)
5: ForAll state e in Rev
6: For All u∈ Θ
7: V e up[ , ]+ =
(
Ex⎡⎣−C e u( , )+V sf[ ]⎦⎤)
8: End For
9: End For
10: End For
11: ForAll state e in Rev
12: m[ ] max
(
p[ , ])
uV e V e u r
∈Θ
= ÷
13: End For
14: ReturnVm
4. Example: AOSLO
The ophthalmoscope is a mechanism that allows the visualization of the internal part of the human eye. Santiago & Bifano (2005) used the methodology proposed by Huchzermeier & Loch (2001) and further developed by Santiago & Vakili (2005), to evaluate the development project of an Adaptive Optics Scanning Laser Ophthalmoscope (AOSLO). Such innovative project of a laser ophthalmoscope differed from the ones available in the market especially due to the high resolution of the images produced by it.
In this paper, we will use this development project in order to demonstrate the applicability of our model and also to compare our project valuation approach to the approach that disregards the development time uncertainty. For additional details, omitted in this paper due to space limit and difference in focus, see Santiago & Bifano (2005).
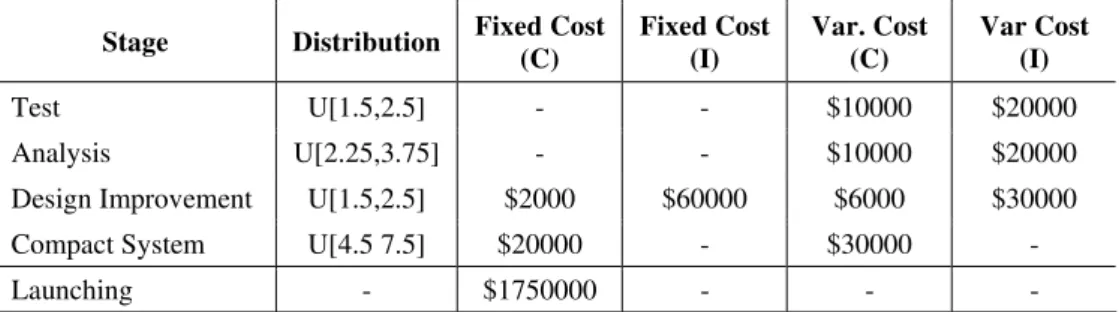
AOSLO’s development project was valuated considering four development stages (Test, Analysis, Design Improvement, and Compact Mechanism Development), whose parameters are described in Table 1.
Table 1 – Stages of the AOSLO development process.
Stage Controls Continuation
Cost
Improvement
Cost Duration
Tests A/C/I $10000 $20000 2 months
Analysis A/C/I $20000 $40000 3 months
Design Improvement A/C/I $20000 $150000 2 months
Compact System A/C $200000 - 6 months
Launching A/C $1750000 - -
Besides, technological uncertainty was evaluated in two dimensions. In the first one, a sorting criterion named usability, and in the second, more important, related to the mechanism’s resolution capability. For illustrative purposes, we consider that the qualifying criterion will be reached with probability 1. That is, we relax the technological uncertainty of the “usability” dimension. The dimension related to the resolution is presented through levels of development that correspond to the percentage increase in resolution logarithm, and it is displayed in discrete unities of 0.1. For such dimension, we consider that the market’s requirement is normally distributed with relative mean equal to 0.2 and standard deviation 0.49 units of measure (for more details, please, see Santiago & Bifano (2005)).
The maximum value paid by the market is $3.75 millions over three years. Such information was used to define parameters a=21 and k=4 of V(t), from which we obtained function
( )
Table 2 – Fixed and Variable costs for development process, when selecting the continuation option (c) or the improvement option (I).
Stage Distribution Fixed Cost
(C)
Fixed Cost (I)
Var. Cost (C)
Var Cost (I)
Test U[1.5,2.5] - - $10000 $20000
Analysis U[2.25,3.75] - - $10000 $20000
Design Improvement U[1.5,2.5] $2000 $60000 $6000 $30000
Compact System U[4.5 7.5] $20000 - $30000 -
Launching - $1750000 - - -
We consider the duration of each stage could be either 25% greater or smaller than the expected duration time – that is, we consider the time to be uniformly distributed in this interval. The percentages of fixed and variable costs at each stage were divided so as to represent reality on the basis of specific characteristics of each stage/phase.
Time Performance
Payoff
Time Performance
Payoff
Figure 5 – Payoff Function.
5. Results
The algorithm was implemented in C ANSI language and computed in an Intel Pentium 4 Core 2 Duo 3.0 GHz with 2 GB RAM. The execution time for each replica was approximately 629 seconds, resulting in a total of 6292 seconds – a fairly acceptable amount of time, especially when taking the time horizon for the decision process into account.
managing the project actively minus the value for the passive management (Vp-NPV). Such result was achieved through 10 estimation replicas, generating 70 random values for the duration of each of the phases, for each iteration, resulting in a total of 704 sample paths, with a standard deviation of $ 1,768.07 (1.02% of the estimated value).
Without considering development time uncertainty, the value of the project would have been $ 191,548.75, which is 11% higher than our estimated value ($ 172,606.97). This demonstrates that a decision that disregards development time uncertainty super estimates, in this case, the value of the project, and may imply suboptimal decisions.
6. Conclusion
The modeling approach presented in this article has proven to be adequate and easily applicable to the analysis of product development projects, with review stages at the initiation of each development phase.
The main novelty and contribution of this paper lies in the fact that it incorporates the uncertainty related to the development time in the process of evaluation and resource allocation in R&D projects. In other words, we incorporate stochastic time in our model, while still preserving Markov property to tackle the problem. This fact opens up many avenues for future research.
The impact of development time uncertainty may vary mainly with market characteristics. As an opportunity for future work, it would be interesting to investigate analytical properties of the model vis-à-vis the time uncertainty in different kinds of markets.
Another possibility would be the development of efficient algorithms for computing the project’s value. In this case, variance reduction techniques can be used to reduce the value of replicas (r), which we expect to reduce the computational effort for small values of N. However, as stated before, to deal with complex projects (larges values of N) one needs to explore structural properties of problem in order to achieve a significant improvement in the computational performance.
Last, but not least, the model captures an important class of valuation and resource allocation problems in R&D projects – the ones characterized by decisions at the beginning of each stage. Indeed the model is not appropriate to evaluate projects with periodic revisions (instead of waiting until each phase is finished, managers would decide periodically on whether or not to continue the project). In spite of that, we believe our model not only captures an important feature of R&D management (i.e., time uncertainty), but also grasps the greatest fraction of resource allocation decisions in R&D projects. That is, our approach captures those decisions that require managers to finish a set of activities before requesting additional financial support.
Acknowledgements
References
(1) Battacharya, S. et al. (1998). Managing new product definition in highly dynamic environments. Management Science, 44, S50-S64.
(2) Chen, J. et al. (2005). The impacts of speed-to-market on new product success: the moderating effects of uncertainty. IEEE Transactions On Engineering Management, 52, 199-212.
(3) Childs, P.D. & Triants, A.J. (1999). Dynamic R&D investment policies. Management Science, 45, 1359-1377.
(4) Crespo, C.F.S. (2008). Avaliação do Impacto Econômico de um projeto de Pesquisa e Desenvolvimento no valor de uma planta Gas-to-Liquid usando a Teoria das Opções Reais. Tese de Doutorado em Engenharia de Produção – Pontifícia Universidade Católica do Rio de Janeiro, Rio de Janeiro.
(5) Ding, M. & Eliashberg, J. (2002). Structuring the new product development pipeline. Management Science, 48, 343-363.
(6) Dixit, A.K. & Pindyck, R.S. (1994). Investment under Uncertainty. Princeton University Press, Princeton, NJ.
(7) Fu, M. (2002). Optimization for Simulation: Theory vs. Practice. Journal on Computing, 14, 192-25.
(8) Huchzermeier, A. & Loch, C.H. (2001). Project management under risk: Using real options approach to evaluate flexibility in R&D. Management Science, 47, 85-101.
(9) Pich, M.T. et al. (2002). On uncertainty, ambiguity and complexity in project management. Management Science, 48, 1008-1023.
(10) Santiago, L.P. & Bifano, T.G. (2005). Management of R&D projects under uncertainty: A multidimensional approach to managerial flexibility. IEEE Transactions on Engineering Management, 52, 269-280.
(11) Santiago, L.P. & Vakili, P. (2005). On the Value of Flexibility in R&D Projects. Management Science, 51, 1206-1218.
(12) Shina, R.K. & Noble, C.H.(2005). A model of market entry in an emerging technology market. IEEE Transactions on Engineering Management, 52, 186-198.
(13) Sommer, S.C. & Loch, C.H. (2004). Selectionism and Learning in projects with complexity and unforeseeable uncertainty. Management Science, 50, 1334-1347.
(14) Trigeorgis, L. (1996). Real Options: managerial flexibility and strategy in resource allocation. MIT Press, Cambrigde, MA.
(15) Weitzman, M.L. (1979). Optimal search for the best alternative. Econometrica, 47, 641-654.