*e-mail: [email protected]
1. Introduction
Solutes in solid solution may segregate to grain boundaries1-4, thus affecting the annealing of metals even in dilute concentrations5-7. The relief of elastic strain due to differences in atomic radius of solute and solvent in the matrix is considered the main reason for solute segregation to grain boundaries. If the driving forces for recrystallization and grain growth are compensated by the attraction forces induced by foreign atoms, the grain boundary will move at a constant velocity limited by solute diffusion and its concentration. The theoretical and mathematical models for a single solute developed by Lücke and Detert8 and Cahn9 can be easily used in calculations when simpliications are possible. However, when considering three or more constituents the model assumes complex equations with parameters of hard and tedious assessment making empirical tests rather necessary. Unfortunately, that is the case for commercial alloys.
Still knowledge on annealing behavior of alloys is of technological and scientiic interest. The inluence of iron content on the annealing behavior of brasses has been studied concerning concentrations around 0.1-0.4 wg%10-12. The recrystallization in these studies was shifted to higher temperatures and the inal grain size was smaller when compared to the pure alloys. However, these results are a consequence of intermetallic precipitation, which may not happen when considering 10 times less concentrated systems. A systematic study of the inluence of dilute iron concentration on the annealing behavior of brasses could not be found in literature.
Among a myriad of techniques, dilatometry has been recently used to assess the recrystallization behavior of different systems13-17. The technique is able to provide both technological information (like the onset and the end of recrystallization) and insights on mechanisms of phenomena related to annealing by registering variations on specimen length.
The aim of this work is to evaluate the residual iron content inluence on annealing of a cartridge brass. This attempt will be made by using the complementary tests dilatometry, microhardness and metallography to assess annealing behavior of the alloy.
2. Materials and Methods
Three samples of 2.4 mm cold rolled (true deformation ɛ = 1.65) cartridge brass strips with different residual iron content were used in this annealing study. All the samples were previously hot rolled (ε = 2.26). The chemical composition determined by X-Ray Fluorescence is presented in Table 1. The specimens were cut from the original sample by spark erosion to a size suitable for dilatometry (4 mm width x 10 mm length – longitudinal direction). The specimens were annealed in vacuum in a Bähr DIL805A Dilatometer. The specimens underwent a nickel electroplating procedure to avoid dezinciication during annealing. Experiments guarantee the thin nickel layer does not inluence the results. Two heating rates were employed in this study: 10 ºC/min, when the specimens were heated up to 500ºC, and 1000 ºC/min, when heated up to 600ºC. To analyze the recrystallization evolution, the heat treatment was interrupted at several peak
A Dilatometric Study of the Inluence of Residual Iron Content on the Annealing Behavior
of Cartridge Brass
Victor Caso Moreiraa,b*, André Paulo Tschiptschina
aPolytechnique, Metallurgical and Materials Engineering Department, University of São Paulo – USP, CEP 05508-030, São Paulo, SP, Brazil
bParanapanema SA, CEP 09220-580, Santo André, SP, Brazil
Received: October 10, 2015; Revised: January 25, 2016; Accepted: February 9, 2016
Solid solutions alloys may have their annealing behavior affected by solute concentration. Mathematical models assume complex equations with parameters of hard and tedious assessment making empirical tests rather necessary. This work evaluated the residual iron content (from ~100 ppm to ~600 ppm) inluence on annealing of a cartridge brass. Dilatometry results showed an anomaly expansion peak on the onset of recrystallization. However, at the end of the annealing process the samples underwent a contraction of 4.68-7.51x10⁻⁴, comparable with literature. The residual iron content had no inluence on recrystallization behavior of the samples, although solute drag effect clearly slowed down grain growth at 600 ppm Fe concentration, especially when annealing happens up to 500ºC. The dilatometric variations between the samples and the anomaly expansion peak during recrystallization were considered as resulting from grain growth of recrystallized nanosized grains and/or from second phase transformations. New tests are proposed to elucidate the phenomena behind observations.
temperatures, at which the specimens were quenched inside the dilatometer in helium gas lux.
The mechanical properties were evaluated in terms of microhardness in a Buehler Micromet Micro Hardness Tester with a 200 grams load. The average of ive impressions was taken for each specimen. The microstructure was revealed by immersion in Klemm’s reagent #2 (5 g of potassium metabisulite added to 50 ml of sodium thiosulfate saturated solution) after electrolyte polishing. The polishing solution was a 40% phosphoric acid aqueous solution and the voltage applied to the sample and a copper cathode was 1.7 V. The recrystallized fraction was determined with the aid of a point grid and the mean of at least 5 micrographs was taken for each condition.
3. Results
The as-received cold rolled strips show elongated grains in the rolling direction with a high length to width ratio. A great number of shear bands can be seen in all the samples. Shear bands appear on the micrographs as readily
etched lines, crossing the deformed grains. The bands cross the grains width almost perpendicularly on longitudinal sections (Fig. 1a), while on transverse sections they happen in both diagonals, in an almost constant angle (Fig. 1b). Strain marks can also be seen inside the elongated grains. All the samples showed the same pattern of cold worked microstructure. The microhardness of the rolled samples were 212 ± 4 HV0.2 (CuZn-1Fe), 206 ±2 HV0.2 (CuZn-4Fe) and 210 ± 3 HV0.2 (CuZn-6Fe), which can be considered statistically the same.
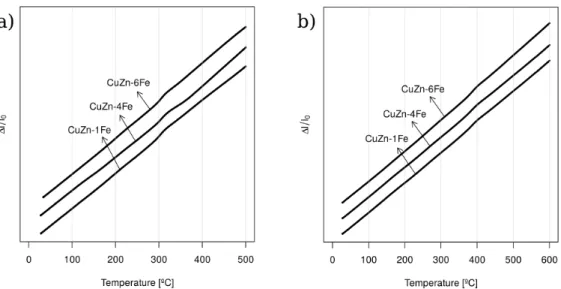
Typical dilatometry results are shown in Fig. 2. An expansion peak is observed between approximately 285ºC and 345ºC for the 10 ºC/min heat treatment and 370ºC to 405ºC for the 1000 ºC/min heat treatment. It is quite unexpected since the recrystallization process is accompanied by point and linear defects elimination. It is noticeable that the residual iron content did not inluence the range of expansion peak.
In order to elucidate these results, a cyclic heat treatment, illustrated in Fig. 3, was proposed. The specimens were heated up to 500ºC (step 1) and held at this temperature for
Fig. 1 Microstructure of cold rolled (ɛ = 1.65) 70/30 brass (sample CuZn-Fe). (a) Longitudinal section, (b) transverse section, (c) strain marks on the longitudinal section.
Table 1. Chemical composition of the samples.
Sample Chemical compostion, weight %
Cu Fe Sn Cr Zn
CuZn-1Fe 69.33 0.0126 0.0191 0.0011 rest
CuZn-4Fe 69.06 0.0417 0.0182 0.0015 rest
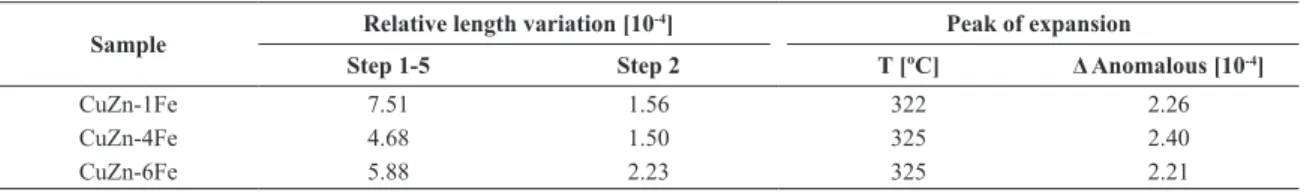
20 minutes (step 2). Then, the specimens were allowed to cool down to 250ºC (step 3), heated again to 500ºC (step 4) and cooled down to room temperature (step 5). All the heating and cooling rates were 10 ºC/min. A typical dilatometric result is illustrated in Fig. 4, which depicts the expansion anomaly as an irreversible one. Changes in specimens’ length were measured and the values at some particular points were considered on the calculation of expansion and contraction of the processes that took place during annealing. Those calculations are presented in Table 2. The column “step 1 – 5” corresponds to the relative length variation (∆l l/ 0) in the whole heat treatment, measured at 250ºC, while “step 2” presents the same variable calculated from the beginning to the end of this step. It is also presented the temperature T and the relative length variation at the peak of the expansion anomaly (∆ anomalous). The peak was determined as the maximum difference between measured and predicted length, considering a linear regression of specimen dilatation within 50ºC and 250ºC.
As it can be seen in Fig. 4, despite the initial expansion, the specimen underwent a net contraction at the end of cyclic heat treatment. As seen in Table 2, the sample CuZn-1Fe has the highest relative length variation while CuZn-6Fe undergoes the highest contraction during step 2. No dependence of expansion or peak temperature on the iron residual content could be noted.
Microhardness of the partially annealed specimens was measured to evaluate mechanical properties changes during annealing. Fig. 5 shows the microhardness dependence on the peak temperature of heat treatment for both heating rates for the sample CuZn-4Fe. The drop in the curves at 300ºC (10ºC/min) and 380ºC (1000ºC/min) are close to the beginning of the expansion peak observed in dilatometry results (Fig. 2). From these points until the end of annealing the microhardness values decreased while temperature rises, although it can be clearly seen that the drops in the curves
Fig. 2 Typical dilatometry results of the samples with gradual residual iron content and different heating rates. (a) 10ºC/min. (b) 1000ºC/min. A constant was added to the results to distinguish the curves.
Fig. 3 Proposed cyclic heat treatment.
assume less intense rates from around 350ºC (10ºC/min) and 440ºC (1000ºC/min) to 500ºC and 600ºC, respectively. The initial increase in the microhardness is well addressed in the literature18-21. It is assigned to the formation of Cottrell atmosphere around dislocations.
A comparison between the three samples is presented in Fig. 6. At the end of the curves, it can be seen that the greater the residual iron content the harder the specimens, in spite of the similar general behavior. This correlation is true for both heating rates (the points in the graphs are bigger than standard deviation bars would be) but it is more evident when 10ºC/min was used.
The recrystallization process was conirmed by the micrographs. The recrystallized fraction versus peak temperature is plotted in Fig. 7. The beginning of recrystallization is in accordance with the sharp fall in microhardness values and the less intense rate of microhardness decrease coincides with the end of recrystallization (Fig. 6). The micrographs at the end of the annealing are shown in Fig. 8. It can be seen that the grain size varies with the residual iron content.
4. Discussion
The expansion observed in all samples and with all heating rates during annealing was unexpected. Although the cyclic heating treatment showed a net contraction it also demonstrated that the transformation taking place at the material is irreversible, that is: no contraction peak is observed upon cooling and no expansion peak can be noted
upon reheating the specimens. After this peak, the samples undergo a contraction, since the slope of the curves does not match the linear thermal expansion expected. Also, the temperature range of the transformation is dependent on the heating rate.
The comparison of the dilatometry to the microhardness and metallography results revealed that the beginning of the expansion anomaly happens approximately 15ºC before the recrystallization can be identiied by those techniques. However, the end of the event may happen almost at the
Fig. 5 Microhardness results for CuZn-4Fe annealed with different heating rates. The increase in heating rate shifts the microhardness drop to a higher temperature.
Fig. 6 Comparison between microhardness results of the samples with increasing residual iron content. (a) 10ºC/min. (b) 1000ºC/min. Table 2. Calculated variation of length from dilatometry results.
Sample Relative length variation [10
-4] Peak of expansion
Step 1-5 Step 2 T [ºC] Δ Anomalous [10-4]
CuZn-1Fe 7.51 1.56 322 2.26
CuZn-4Fe 4.68 1.50 325 2.40
same time of recrystallization. Those statements are true for both heating rates, indicating that the expansion observed may be strictly related to recrystallization.
Since recrystallization is a phenomenon which eliminates in a great extent crystalline defects (the energy associated to these defects is the driving force to the phenomenon) it is expected a contraction of the material during the annealing process. Indeed, many works have found contraction peaks with no prior expansion while studying recrystallization.
Expansion peaks during annealing have been associated to phase transformations22, order-disorder transformations13, dissolution of precipitates23 and anisotropy. None of these phenomena are applicable to alpha-brasses, a single cubic phase material in the whole range of annealing temperatures. However, the residual iron content raises the possibility of an iron-rich phase precipitation.
Transmission Electron Microscopy (TEM) was employed to evaluate any precipitation, but no second phase particles could be noted after complete annealing at 500ºC and cooling
down. So the expansion may not be related to a second phase precipitation, unless it is dissolved during annealing. In this case, the contraction related to the dissolution may be in overlap with the contraction due to crystal defects elimination. Also, previous deformation should be an essential issue to this phase transformation, otherwise it would happen again during cooling. Besides that, if the expansion was related to the iron content it would be expected that the change in length is dependent on iron content (considering that the compound is not limited by other chemical elements). That is not the case, as shown in Table 2. Observations by TEM of the cold worked state and of the quenched microstructure at the expansion peak temperature may add important information to the phase-transformation hypothesis.
Other possibility is that the grain boundary volume generated by the recrystallized grains exceeds the contraction due to crystal defects elimination taking place during recrystallization. This may be possible if the recrystallized grains are very small, in nanometric scale. However, if this is the case, almost all the contraction should be noted during recrystallization and the beginning of grain growth, since both grain boundary volume excess and crystal defects elimination would be greater at this temperature range. The contraction related to grain growth can be calculated by means of equation (1). In fact, the total relative contraction is found to be 4.1x10⁻⁴ when considering an initial grain size of 100 nm and a inal grain size of 1 µm (which would happen in early grain growth stage) and 4.1x10⁻⁵ when considering grain size of 1 µm and 10 µm in initial and inal states, respectively.
,
E GB
0 0
l 1 1
V
l d d
∆ = −
(1)
where
0 l
l
∆
is the relative change in length,
,
E GB V is the grain boundary excess volume, taken from results for copper as 4.6x10⁻⁵ µm17, d and d
0 are the grain size in inal and initial states, respectively.
Fig. 7 Recrystallized fraction evolution during annealing. Measurements made by quantitative metallography (point grid method).
The phenomena behind expansion during the onset of recrystallization could not be determined. Other experiments may be done to assess it, such as TEM observations to provide information about phase transformations, dilatometry in other directions of the rolled samples, to evaluate inluence of the anisotropic grain growth on the expansion peak and recrystallized grain size measurements.
In fact, the residual iron content had inluence neither on the microhardness values, dilatometry and recrystallized fraction results nor on the onset and the end temperature of recrystallization. Probably the driving force for recrystallization was suficiently high to avoid solute drag effects.
Considering the relative length variation during cyclic heat treatment, it can be noticed that the sample CuZn-1Fe has the largest values for the whole annealing (step 1 – 5). It also has the largest grain size and the smallest hardness measurement at peak temperature 500ºC. On the other hand, CuZn-4Fe and CuZn-6Fe have similar variation for the whole annealing but the latter has the greatest contraction at step 2 (500ºC for 20 minutes). Those results may be explained either by contraction due to grain growth or by second phase transformations, since there is no reason to suppose that great differences took place within the samples concerning the recrystallization contraction.
The CuZn-6Fe sample has the smallest grain size at 500ºC peak temperature. Since no precipitates were seen after complete annealing at 500ºC, this is an evidence of the solute drag effect on grain growth of cartridge brass, which is known to be proportional to annealing temperature. The grain size of the samples are much more similar at 600ºC peak temperature, which is an evidence that at this temperature the solute drag effect is much less eficient. With the smallest grain size at the beginning of step 2, CuZn-6Fe has the largest grain boundary area to be eliminated when held at this temperature for 20 minutes. Nevertheless, the contraction calculated by equation 1 due to grain growth at step 2 does not match the measured shrinkage. This is evidence of other events happening during annealing, such as phase transformations. On the other hand, CuZn-1Fe has the lowest iron content, therefore the higher grain boundary migration velocity and the largest grain size both at 500ºC and presumably at the end of heat treatment. But again, the elimination of a wider grain boundary area may not explain the wider length variation among the studied samples, unless the recrystallized grain size of CuZn-1Fe is smaller than the other samples (and at nanometric scale).
The measured net contraction during annealing is within 4.68x10⁻⁴ and 7.51x10⁻⁴. Those values are comparable to the result obtained for high-pressure torsion copper17 (7.02x10⁻⁴) and iron14 (6.4x10⁻⁴). However, one must have in mind that
those studies were made with high-pressure torsion samples which have diverse cold worked states. The number of vacancies, dislocation densities and initial grain size may be considerably different from those of the samples used in this study. It should be pointed that Oberdorfer et. al could observe a three step contraction that could not be seen in this study.
5. Conclusion
The annealing effects on cartridge brass were evaluated in terms of dilatometry, microhardness and metallography. The following conclusions can be drawn from the results of the techniques employed:
- The residual iron content of the alloy did not inluence the recrystallization behavior of the material. However, the effect of chemical composition in the CuZn-6Fe (~600 ppm Fe) grain growth could be clearly noted, especially at 500ºC peak temperature.
- The change in heating rate of annealing caused a shift in the onset and in the end temperature of recrystallization, a typical behavior of thermal activated process. The approximated temperature ranges of recrystallization are 300-345ºC and 370-420ºC to 10ºC/min and 1000ºC/ min heating rates, respectively.
- The annealing treatment was accompanied by a total contraction of the specimens of (4.68-7.51)x10-4 which is comparable to other studies with HPT copper17 (7.02x10⁻⁴) and iron14 (6.4x10⁻⁴). It is essential to highlight that the cold worked states of these materials may be signiicantly different from those of the samples used in this study.
- CuZn-1Fe had the widest relative length variation during annealing (step 1-5) while CuZn-6Fe had the widest one in step 2. The solute drag effect slowed down grain boundary migration of CuZn-6Fe after recrystallization took place. Because of that this sample had the smallest grain size at 500ºC peak temperature
- The annealing of the samples with both heating rates and all compositions lead to an expansion peak which coincides with the recrystallization temperature range. The expansion can be explained by the grain boundary excess volume of nanometric recrystallized grains or by second phase precipitation/dissolution. In both cases, the expansion may exceed the contraction due to crystal defects elimination. TEM analysis and recrystallized grain size measurement may identify the phenomenon behind the results.
6. Bibliography
1 – Thomas WR, Chalmers B. The segregation of impurities to grain boundaries. Acta Metallurgica. 1955;3(1):17-21. DOI: 10.1016/0001-6160(55)90005-5
2 – Aust KT, Rutter JW. Kinetics of grain boundary migration in high-purity lead containing very small additions of silver and gold. Transactions of the Metallurgical Society of AIME. 1960;218(4):682-688.
3 – Hu J, Seidman DN. Relationship of chemical composition and structure on an atomic scale for metal/metal interfaces: the W(Re) system. Scripta Metallurgica et Materialia. 1992; 27(6):693-698. DOI: 10.1016/0956-716X(92)90490-6 4 – Lajěek P, Adámek J, Hofmann S. Anisotropy of grain boundary
5 – Hutchinson WB, Ray RK. Influence of phosphorus additions on annealing behavior of cold-worked copper. Metal Science. 1979;13(3-4):125-130. DOI: http://dx.doi.org/10.1179/ msc.1979.13.3-4.125
6 – Ito K, Musick R., Lücke K. The influence of iron content and annealing temperature on the recrystallization textures of high-purity aluminium-iron alloys. Acta Metallurgica. 1983; 31(12):2137-2149. DOI: 10.1016/0001-6160(83)90033-0 7 – Jakani S, Baudin T, de Novion CH, Mathon MH. Effect of
impurities on the recrystallization texture in commercially pure copper-ETP wires. Materials Science and Engineering A. 2007; 456(1):261-269. DOI: 10.1016/j.msea.2006.11.137 8 – Lücke K, Detert K. A quantitative theory of grain-boundary motion
and recrystallization in metals in the presence of impurities.
Acta Metallurgica. 1957;5(11):628-637.
9 – Cahn JW. The impurity-drag effect in grain boundary motion.
Acta Metallurgica. 1962; 10(9):789-798. doi:10.1016/0001-6160(62)90092-5
10 – Lloyd HK, Oxlee CH. The influence of aluminium and iron additions on copper-manganese-zinc alloys. NML Technical Journal. 1966; 9(1):39-44. http://eprints.nmlindia.org/3139/1/110-116.PDF
11 – Aghaie-Kahfri M, Mohebati-Jouibari, A. Thermomechanical treatment of 70/30 brass containing iron impurity. Journal of Materials Science. 2006;41(22):7585-7589. DOI: 10.1007/ s10853-006-0846-5
12 – Shafiei A, Roshanghias A, Abbaszasdeh H, Akbari G H. Na investigation into the effect of alloying elements on the recrystallization behavior of 70/30 brass. Journal of Materials Engineering and Performance. 2010;19(4):553-557. DOI: 10.1007/s11665-009-9516-5
13 – Cahn RW, Takeyama M, Horton JA, Liu CT. Recovery and recrystallization of the deformed, orderable alloy (Co78Fe22)3V. Journal of Materials Research. 1991;6(1):57-70. http://dx.doi. org/10.1557/JMR.1991.0057
14 – Oberdorfer B, Lorenzoni B, Unger K, Sprengel W, Zehetbauer M, Pippan R, et al. Absolute concentrarion of the free volume-type defects in ultrafine-grained Fe prepared by high-pressure torsion. Scripta Materialia. 2010;63(4):452-455. doi: 10.1016/j. scriptamat.2010.05.007
15 – Oberdorfer B, Steyskal EM, Sprengel W, Pippan R, Zehetbauer M, Puff W, et al. Recrystallization kinetics of ultrafined-grained Ni studied by dilatometry. Journal of Alloys and Compounds. 2011;509(1): S309-S311. DOI: 10.1016/j.jallcom.2010.12.130 16 – Hayoune A, Hamana D. A dilatometric and high-temperature X-ray diffraction study of cold deformation effect on the interaction between precipitation, recovery and recrystallization reactions in Al-12 wt.% Mg alloy. Materials Science and Engineering: A.
2010;527(27-28):7261-7264. doi:10.1016/j.msea.2010.08.011 17 - Oberdorfer B, Setman D, Steyskal EM, Hohenwarter A, Sprengel
W, Zehetbauer M, et al. Grain boundary excess volume and defect annealing of copper after high-pressure torsion. Acta Materialia. 2014;68:189-195. doi:10.1016/j.actamat.2013.12.036 18 – Dlubek G, Brümmer O, Alam A. Recovery and recrystallization
of plastically deformed α-brass – a comparision of positron annihilation, electrical resistance and microhardness results. Solid State Communications. 1979;29(8):597-599. DOI:10.1016/0038-1098(79)90672-0
19 – Migschitz M, Garlipp W, Pfeiler W. Short-range order kinetics in α-AnZn for various states of post-deformation defect annealing after cold-rolling. Acta Materialia. 1996; 44(7):2831-2838. doi:10.1016/1359-6454(95)00377-0
20 – Spanl M, Rosenkranz P, Pfeiler W. Interactions of deformation and short-range order during post-deformation annealing in α-CuAl. Materials Science and Engineering A. 1997; 234-236:541-543. doi:10.1016/S0921-5093(97)00257-8 21 – Spanl M, Korner A, Pfeiler W, Puschl W. Changes of
microstructure during post-deformation annealing in α-CuAl.
Scripta Materialia. 1999;41(5):505-510. doi:10.1016/S1359-6462(99)00181-5
22 – de Cock T, Capdevila C, Caballero FG, de Andrés CG. Interpretation of a dilatometric anomaly previous to the ferrite-to-austenite transformation in a low carbon steel. Scripta Materialia. 2006;54(5):949-954. doi:10.1016/j.scriptamat.2005.10.052 23 – Hayoune A, Hamana D. A dilatometric and high-temperature
X-ray diffraction study of cold deformation effect on the interaction between precipitation, recovery and recrystallization reactions in Al-12 wt.& Mg alloy. Materials Science and Engineering A.