ISSN 0104-6632 Printed in Brazil
www.abeq.org.br/bjche
Vol. 22, No. 02, pp. 173 - 179, April - June, 2005
Brazilian Journal
of Chemical
Engineering
EXPERIMENTAL DETERMINATION OF THE
EFFECT OF TEMPERATURE AND
HUMIDITY ON THE DEVELOPMENT
OF COLOUR IN
Pinus radiata
M. McCurdy, S. Pang and R. Keey
Wood Technology Research Center, Department of Chemical and Process Engineering, University of Canterbury, Christchurch, New Zealand.
(Received: October 20, 2004 ; Accepted: November 20, 2004)
Abstract - Experiments were undertaken to determine the effects of drying conditions (temperature and humidity) on the development of kiln brown stain in radiata pine during drying. Eight schedules were tested with temperatures ranging from 50°C to 120°C and relative humidity from 14% to 67%. The variables measured were moisture content, color expressed using the CIELab color space, and nitrogen content. The experiments have shown that the kiln brown stain is influenced by drying temperature and drying time. The recommendation is therefore that low-temperature and low-humidity schedules be developed for controlling color development.
Keywords: Appearance grade; Accelerated conventional temperature; High temperature; Kiln drying; Low temperature; Color space.
INTRODUCTION
Color development in Pinus radiata wood during kiln drying is a significant problem for the lumber industry in New Zealand and also increasingly around the world as other species are dried at higher and higher temperatures. Color development can be split into two categories, overall darkening of the wood and the formation of kiln brown stain. The latter has to date been a greater concern for the
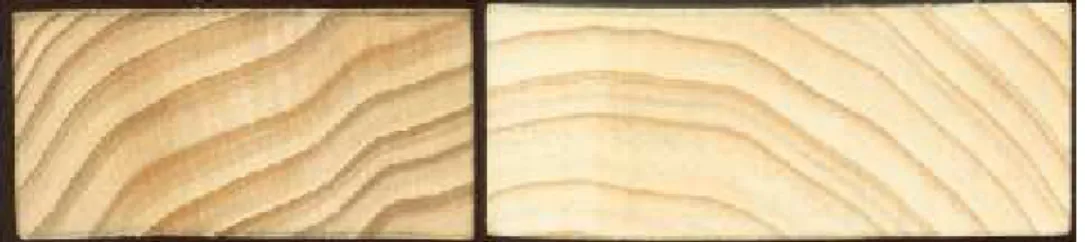
industry as it devalues appearance grade lumber and can also cause problems with further wood processing. The photograph in Figure 1 shows two boards with very different color characteristics. The board on the right side is much lighter overall than the left board and the left board has a distinctive thin dark brown layer around the perimeter just below the surface. This dark layer is called kiln brown stain. There is a very faint line on the right side board but this would not be enough to degrade its appearance.
174 M. McCurdy, S. Pang and R. Keey
Filled Tracheids
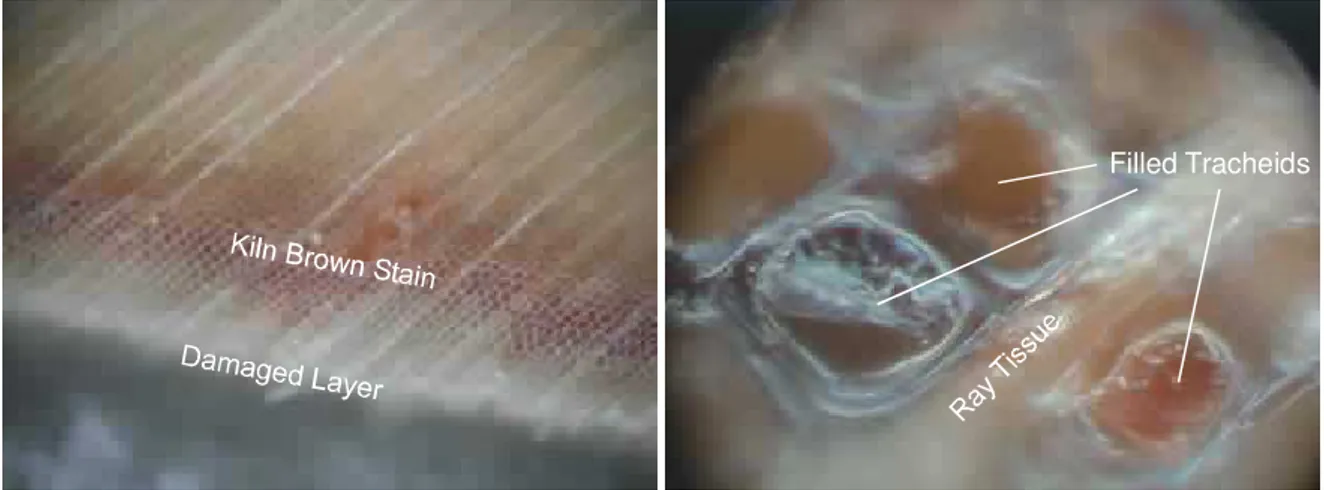
Figure 2: Light micrographs of the kiln brown stain layer viewed on a transverse section.
When observed under the microscope the kiln brown strain layer consists of cells with darkened cell walls as well as a few cells completely filled with a brown amorphous substance. Examples of both are shown in the light micrographs in Figure 2. The darkened cell walls may be due to a coating or staining within the cell material. The darkened cell walls are more important than the filled cells in producing the appearance of kiln brown stain.
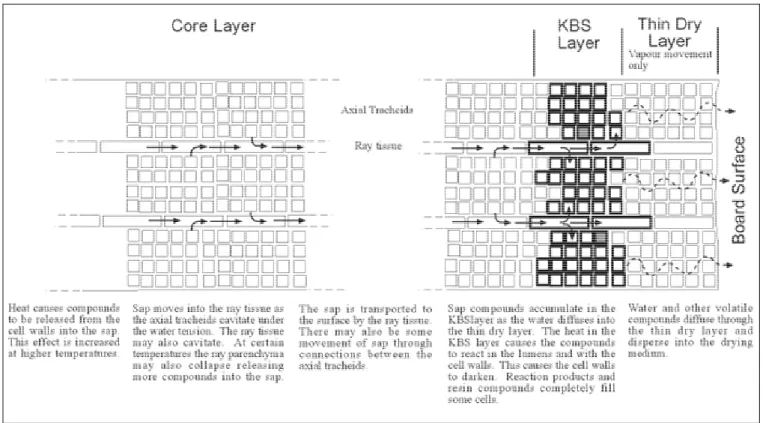
The general mechanism for the formation of kiln brown stain can be expressed in several stages. Firstly, when the wood is in the green state, prior to drying, the sap contains a number of organic compounds including soluble sugars and proteins as well as free amino acids. During drying the sap moves to the surface and evaporates leaving the organic compounds to accumulate at the surface. The combination of high wood temperature and the elapsed drying time causes the sugars and proteins to react by a complicated chemical reaction, termed as Maillard reaction, which ultimately results in formation of melanoidins that appear as kiln brown stain. Gerrard (2001) and Fayle and Gerrard (2002) have reported details of the Maillard reaction. McDonald et al (2000) have studied the chemistry of kiln brown stain formation in detail. A mechanism for kiln brown stain formation based on the literature is shown in Figure 3.
The formation of kiln brown stain is due to both a transport process and a chemical reaction, so there are a number of opportunities within the wood drying process to reduce or eliminate the formation of the kiln brown stain. These opportunities can be split into three categories; those that occur before the
drying process, or pre-treatment processes; those that occur during the drying process, or modified drying processes; and those that are applied after the drying process, or post-drying processes. Some examples of these opportunities are highlighted as follows: § Pre-treatment processes: Removal of reactants, addition of inhibitors, altering the wood structure, biological treatment.
§ Modified drying processes: Schedule manipulation, modified drying mechanism (microwave or radio frequency heating), chemical treatment during drying.
§ Post-drying processes: Mechanical removal of
stain layer, chemical bleaching of stain layer.
A number of studies have been conducted that have attempted to find a solution to kiln brown stain, the majority of them being pre-treatment processes.
Biological treatment (McCurdy et al., 2002),
compression rolling (Kreber and Haslett, 1997), sap displacement (Dieste, 2002; Kreber et al., 2001) and chemical inhibitors (Kreber et al., 1999) have all been used as pre-treatments. In all of the cases, these pre-treatment processes were successful in reducing or eliminating stain but were not considered economically viable.
Vacuum drying (Wastney et al., 1997) and
Figure 3: A mechanism for kiln brown stain formation.
EXPERIMENTAL
The wood used in this experiment was cut from a single log (4m long) that was grown in the West Coast Forest of the South Island of New Zealand. The log was carefully selected which was free from compression wood and had a centrally located pith. The sawmill was set to cut 40mm (thickness) ×100mm (width) flat-sawn boards from the log and the position of each board in the log was recorded during cutting. These boards were subsequently cut into end-matched and edge-matched 800mm long sample boards, treated with Chemicca Hylite Extra, anti-sap stain chemicals, and then wrapped in plastic and stored at a temperature of 4°C.
For the drying experiments, nine schedules were initially selected with dry-bulb temperatures that are used by industry for drying varying grades of lumber. However, this study varied the relative humidity for accelerated conventional temperature and conventional temperature schedules which are most likely to produce better color and to be economically feasible. In this way, nine drying schedules were chosen with dry-bulb temperature ranging from 50 to 120°C and relative humidity from 14% to 67%. The run numbers and drying conditions
are given in Table 1. Initially, the sample boards were dried to a target moisture content of 8-10% (fully drying) at the nine different schedules. These drying operations were carried out in a single board drying tunnel with an airspeed of 5m/s over the board surfaces. One of the schedules (90/60°C) failed due to an equipment malfunction so no results were obtained from it.
The boards used for each dry-bulb temperature series were end-matched. For each schedule a second edge-matched board was cut into four smaller boards that were dried for 20%, 40%, 60% and 80% of the fully drying time to determine how moisture and color profiles develop during drying.
After drying, two 25mm long samples were cut from each board. The first of these was immediately cut into a 25×25×100mm block and then cut from surface to center into 20 slices, each being approximately 1mm thick, to determine the moisture-content profile. The second samples were vacuum-dried at 40°C for 2 days and then sliced in the same way as described above to determine the color profile.
176 M. McCurdy, S. Pang and R. Keey
CIELAB color space where L* is lightness, a* is red-green share, and b* is blue-yellow share.
After the color measurements, chemical
measurements were performed to determine the nitrogen and carbon contents using the same samples as for the color measurements. The four slices at the surface were used for the surface chemical analysis and the four slices at the centre were used for the center chemical analysis. Each set of slices was first ground into small chips using a Wiley Mill with a 2mm mesh screen. The chips were collected and ground into fine powders using a mortal and pestle mill. In combustion analysis the samples were burned in high purity oxygen and the percentage of carbon and nitrogen determined from the thermal characteristics of the resultant gasses.
RESULTS AND DISCUSSION
The results of the color development in the eight schedules are summarized and given in Table 1 below. To get an indication of the total color change throughout drying the mean core lightness (slices 4-20) for the first sample (20% drying time) was subtracted from the mean surface lightness (slices 1-3) for the fully dried sample, for each schedule. This was repeated for the a* and the b* values and, the quantity ∆E was then calculated from these values, using Equation (1) to give a measure of the total change in color.
2 2 2
E L a b
∆ = ∆ + ∆ + ∆ (1)
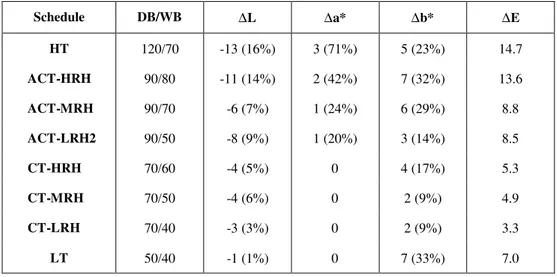
Table 1: Drying schedules and average lightness values for fully dried boards
Schedule DB/WB ∆L ∆a* ∆b* ∆E
HT 120/70 -13 (16%) 3 (71%) 5 (23%) 14.7
ACT-HRH 90/80 -11 (14%) 2 (42%) 7 (32%) 13.6
ACT-MRH 90/70 -6 (7%) 1 (24%) 6 (29%) 8.8
ACT-LRH2 90/50 -8 (9%) 1 (20%) 3 (14%) 8.5
CT-HRH 70/60 -4 (5%) 0 4 (17%) 5.3
CT-MRH 70/50 -4 (6%) 0 2 (9%) 4.9
CT-LRH 70/40 -3 (3%) 0 2 (9%) 3.3
LT 50/40 -1 (1%) 0 7 (33%) 7.0
The first thing of note from the results is that the 50/40°C schedule has a very high ∆b* value and consequently a high ∆E value. This is assumed to be an anomaly and so the color quantity ∆E value in this schedule will not be considered further in the analysis. The ∆E values show a clear trend in all of the other schedules. The higher temperature schedules are clearly producing the greater color change. The ∆E values also show that the higher humidity drying schedules for a given dry-bulb temperature are producing greater color change.
The change in lightness, ∆L, also shows a clear differentiation between different dry-bulb temperature schedules, but the differentiation is not so clear between different humidity schedules with the same dry bulb temperature. The 50/40°C schedule produced the least significant decrease in
lightness while the 120/70°C schedule produced the most significant decrease in lightness.
The change in the red-green chromaticity coordinate, ∆a*, does differentiate between the HT and ACT schedules based on both dry-bulb temperature and relative humidity, but is not very effective in differentiating between the lower temperature schedules. A positive increase in this coordinate indicates a reddening of the sample. These results suggest that the formation of kiln brown stain does not greatly increase the redness of the wood except at high temperature.
50/40°C schedule showed an unexpectedly high change in ∆b*. A positive increase in the yellow-blue chromaticity coordinate indicates that the color contains more yellowness, so clearly the formation of kiln brown stain makes the stain layer more yellow.
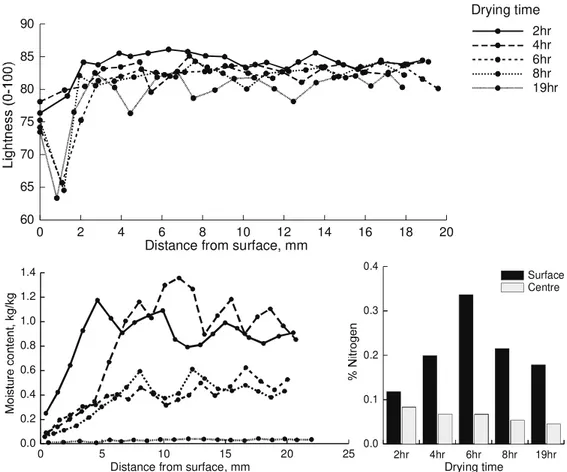
The following three figures show the moisture content profiles, lightness profiles and nitrogen analysis for three selected schedules, HT (Figure 4), ACT-MRH (Figure 5) and LT (Figure 6). These results are indicative of the trends seen in the data. The results became more variable for the lower temperature schedules where the initial properties of the samples possibly have a more significant influence on the color development.
In general, the results show that in the early stages of drying only the surface (1mm thick) darkens slightly and the core of the boards remains light color. This is the stage of drying when liquid moves to and evaporates near the surface. Therefore, due to the fast drying rate the wood temperature would be low and the elapsed time is short, the discoloration is not significant. Also the sap compound will still be accumulating at the surface and will not have reached maximum concentration. Terziev (1995) found that the concentration of low
molecular weight sugars and nitrogen at the surface were increased in the early stage of drying regardless of drying temperatures. The results from these experiments show that there is an accumulation of nitrogenous compounds at the surface, which is in agreement with Terziev’s observations, however, the results from the current study are variable with respect to time.
In the late stages of drying, the color changes are more pronounced and this is particularly significant in the second sliced layer (1-2 mm) from the drying surface. At this stage of the drying process, movement of free moisture to the surface layer will have been inhibited by pit aspiration. The concentration of sap compounds at the surface will have therefore reached a maximum and the rate of the Maillard reaction will be peaking. This is especially evident in the HT schedule results where the greatest change in surface color occurs between 4 and 6 hours of drying when the surface is dried to fiber saturation point. There is also an indication of color development below the fiber saturation point, which suggests the color reaction can occur in the absence of free water. This supports the idea that discoloration occurs within the cell wall material.
2hr 4hr 6hr 8hr 19hr
0 2 4 6 8 10 12 14 16 18 20 60
65 70 75 80 85 90
0 5 10 15 20 25
0.0 0.2 0.4 0.6 0.8 1.0 1.2 1.4
Distance from surface, mm
Drying time
Distance from surface, mm Drying time
Centre Surface
2hr 4hr 6hr 8hr 19hr 0.0
0.1 0.2 0.3 0.4
178 M. McCurdy, S. Pang and R. Keey
7hr 14hr 21hr 28hr 35hr
0 2 4 6 8 10 12 14 16 18 20
60 65 70 75 80 85 90
0 5 10 15 20 25 30
0.0 0.2 0.4 0.6 0.8 1.0 1.2 1.4
Drying time Distance from surface, mm
Distance from surface, mm
Drying time
Centre Surface
7hr 14hr 21hr 28hr 35hr 0.0
0.1 0.2 0.3 0.4
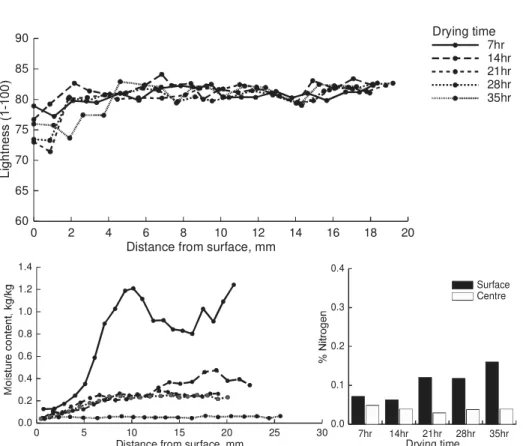
Figure 5: Results for the ACT-MRH schedule, showing lightness profile, moisture content profile and nitrogen analysis.
27hr 54hr 80hr 106hr 135hr
0 2 4 6 8 10 12 14 16 18 20
60 65 70 75 80 85 90
0 5 10 15 20 25
0.0 0.2 0.4 0.6 0.8 1.0 1.2 1.4
Centre Surface
27hr 54hr 80hr 106hr 135hr
0.0 0.1 0.2 0.3 0.4
Drying time
Drying time Distance from surface, mm
Distance from surface, mm
The total nitrogen accumulation at the surface is higher for the HT schedule than the other two schedules, which are similar. This may be due to a higher overall nitrogen level in the samples used for the HT schedule or could be due to a greater release and transport of lignin and hemi-cellulose compounds at the higher temperature. It is also possible that there is a greater diffusion of sap compounds away from the surface in the lower temperature schedules due to the longer drying times and lower convective flow rates.
CONCLUSIONS
These experiments have shown that higher drying temperatures produce more darkening of wood color, which is in agreement with Kreber and Haslett (1997). The development of this darkening appears to be quite rapid as found in the HT drying, but becomes slower and more erratic at lower temperature schedules. This variability may indicate that wood properties have more effect on color development at lower temperatures than at high temperatures, when the temperature-dependent kinetics are much slower.
These experiments have also shown that there is less darkening and stain formation on drying at low relative humidity under the same dry-bulb temperature. This is not in agreement with previous studies on radiata pine (Kreber and Haslett, 1997), but can be explained as the influence of drying time. The lower relative humidity schedules dry faster and, therefore, the color has less time to develop.
ACKNOWLEDGEMENTS
This project was sponsored by New Zealand Foundation of Research, Science and Technology through a subcontract from the Department of Physics, University of Otago. The authors thank
Professor Gerry Carrington of Otago University for his support.
REFERENCES
Dieste, A. 2002. Colour development in Pinus radiata D. Don under kiln-drying conditions. ME thesis, Department of Chemical and Process Engineering, University of Canterbury, New Zealand.
Fayle, S.E.; Gerrard, J.A. 2002. RSC food analysis monographs: The Maillard reaction. Royal Society of Chemistry, Cambridge.
Gerrard, J.A. 2001. The Maillard reaction and wood. Proceedings of Wood Technology Research Centre Workshop, University of Canterbury, Christchurch, New Zealand: 6-8.
Kreber, B.; Stahl, M.R,; Haslett, A.N. 2001. Application of a novel de-watering process to control kiln brown stain in radiata pine. Holz als Roh und Werkstoff 59: 29-34.
Kreber, B., Haslett, A.N., McDonald, A.G. 1999. Kiln brown stain in radiata pine: a short review on cause and methods for prevention. Forest Products Journal, 49(4): 66-70.
Kreber, B.; Haslett, A. N. 1998. The current story on kiln brown stain. FRI Bulletin Issue No.23.
Kreber, B.; Haslett, A. N. 1997. A study of some factors promoting kiln brown stain formation in radiata pine. Holz als Roh und Werkstoff 55 (4): 215-220.
McCurdy, M.C.; Nijdam, J.J.; Keey, R.B. 2002. Biological control of kiln brown stain in radiata pine. Maderas: Ciencia Y Tecnologia 4(2):140-147.
McDonald, A. G.; Fernandez, M.; Kreber, B.; Laytner, F. 2000. The chemical nature of kiln brown stain in radiata pine. Holzforschung 54 (1): 12-22.
Terziev, N. 1995. Migration of low-molecular sugars and nitrogenous compounds in Pinus sylvestris L. during kiln and air drying. Holzforschung 49: 565 – 574.