An Attribute-Based Image Segmentation Method
M.C. de Andrade*
a, G. Bertrand
bA.A. de Araújo
ca
Centro de Desenvolvimento da Tecnologia Nuclear - CDTN, 31270-010 Belo Horizonte - MG, Brazil
b
Ecole Supérieure d’Ingénieurs en Electrotechnique et Electronique, ESIEE, Noisy-le-Grand, France
c
Universidade Federal de Minas Gerais - UFMG/DCC, 30161-970 Belo Horizonte - MG, Brazil
Received: August 15, 1998; Revised: March 30, 1999
This work addresses a new image segmentation method founded on Digital Topology and Mathematical Morphology grounds. The ABA (attribute based absorptions) transform can be viewed as a region-growing method by flooding simulation working at the scale of the main structures of the image. In this method, the gray level image is treated as a relief flooded from all its local minima, which are progressively detected and merged as the flooding takes place. Each local minimum is exclusively associated to one catchment basin (CB). The CBs merging process is guided by their geometric parameters as depth, area and/or volume. This solution enables the direct segmentation of the original image without the need of a preprocessing step or the explicit marker extraction step, often required by other flooding simulation methods. Some examples of image segmentation, employing the ABA transform, are illustrated for uranium oxide samples. It is shown that the ABA transform presents very good segmentation results even in presence of noisy images. Moreover, it’s use is often easier and faster when compared to similar image segmentation methods.
Keywords:image analysis, image segmentation, digital topology
1. Introduction
This paper describes the ABA* transform1,2, a new image segmentation method founded on Digital Topol-ogy3,4 and Mathematical Morphology5 grounds. The ABA transform was originally conceived to simplify the segmen-tation of ceramic materials, whose images often present challenges, like illumination gradients, excessive number of minima, ill-defined regions (grains, pores, etc.), broken contours, etc.
A great number of image segmentation methods is available in the technical literature to deal with this kind of problem. Several efficient image segmentation methods are known as the watershed6,7 the dynamics8, waterfall9, h-domes9 extinction functions10 and attribute opening11. A significant part of these methods, including the ABA trans-form, employ the powerful flooding simulation technique. The flooding simulation, however, is very sensitive to noise requiring an image smoothing step before the image seg-mentation. The ABA transform acts at the scale of the significant structures of the image thus avoiding the smoothing step. Derived from the watershed, the ABA
transform incorporates a set of simple topological rules, which merges the non-significant regions of the image taking into account some of its geometric attributes, thus reducing the typical over-segmentation and producing a segmented image in one single step.
2. Materials and Methods
Routine procedures in quality control often require the determination of the volumetric grain size distribution to characterize a given material12, since many of the its physi-cal properties can be infered from this distribution. The characterization process usually depends on an image analysis step, which, by its turn, requires an image segmen-tation step. The segmensegmen-tation can be done by hand or by an automatic or semi-automatic procedure and this choice usually depends on the problem and on the image quality. Tha ABA transform is classified as a semi-automatic image segmentation method.
To illustrate the ABA transform some typical ceramical samples of uranium oxide, prepared at the CDTN mate-rial’s lab, are presented. These samples are sinterized
lets of uranium oxide that have been submitted to chemical, thermal and mechanical treatment. The images were pho-tographed from an optical microscope and the resulting micrographs were digitized with a scanner.
Many microscopic images, like the ones here shown, reveal a microstructure composed of individual regions separated by thin gaps. As an example, Fig. 1a shows a highly magnified cross-section of a uranium oxide sample. This ceramic material is compound of several grains whose borders should be correctly extracted in order to evaluate the grain size distribution. Figure 1b, the negative image, shows the grains as darker regions, separated by gaps as brighter regions. The negative image is useful in the flood-ing simulation process.
Very few of the known image segmentation methods are robust enough to correctly extract the grain’s borders. Usually the images present illumination gradient, noise,
and defects that preclude the use of conventional segmen-tation techniques. Unless the segmensegmen-tation is done by hand, automatic or semi-automatic segmentation require more effective methods.
Image segmentation based on the watershed transform6,7 is well suited for this task. However, despite its robustness the watershed transformcan not be directly applied to an image, because it would produce a strongly over-segmented image as shown in Fig. 2b. The over-segmentation is often due to the excessive number of local minima present in the original non-filtered image, as shows Fig. 2a. Achieving a suitable segmentation means to suppress, someway, all the non-sig-nificant minima present in the image.
2.1. The watershed transform
The flooding simulation technique interprets a gray level image as a topographic relief. To each gray level is
Figure 1. Micrograph of a highly magnified cross section of a uranium oxide sample: (a) original, and (b) negative image.
assigned a height proportional to its value. The result is a “3D” image presenting several valleys separated by moun-tains, as illustrates Fig. 3. Seen from above, the landscape would have basins corresponding to the regions of interest separated by dams called watersheds. The water, supposed to come from ‘holes’ carved at the bottom of each basin, propagates, step by step, inside each catchment basin (CB). The watershed transform6,7 is based on a stepwise flooding simulation. It is a recursive and inherently serial process since the current flooding level is always dependent on the immediately precedent one. A formal definition of the concept of watershed transform of a digital image can be found in the paper presented by Vincent6. The watershed segmentation is a two step procedure: an intelligent step consisting in the extraction of significant minima, often requiring the human judgment, and a mechanical step where the watershed algorithm, guided by the extracted minima or by markers associated to those minima, is ap-plied to the image. As a rule, to correctly segment an image, its particularities and the expected segmentation results must always be taken into account.
2.2 The ABA transform
The ABA transform1,2 is an image segmentation method derived from the watershed transformation. It can be classified as a region-growing method by a flooding simulation. The ABA algorithm treats the image as a relief flooded from all its local minima, which are progressively detected and conditionally merged as the water fills up the relief. The merging process is guided by the basin’s geo-metric attributes and a set of simple rules allowing the quick and reliable segmentation of a wide class of images without the need to preprocessing the images. The fine tuning of parameters often leads to well-segmented images present-ing very low over or under-segmentation rates.
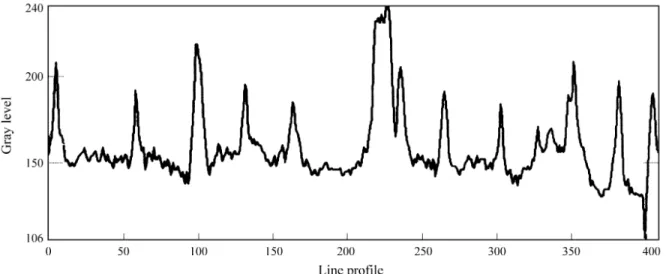
Figure 4 shows an arbitrary 1D vertical profile extracted from the uranium oxide micrograph presented in Fig. 1. It can also be seen as a transversal slice of Fig. 3. The prominent peaks represent the grain boundaries while the small ones are often due to noise or to irregularities in the material’s surface.
The areas inside two relatively high peaks represent the catchment basins (CBs), i.e., in this image the grains, whose boundaries should be detected. A closer inspection of this profile shows that the non-significant minima, which are responsible for the over-segmentation, are located between two small peaks. To achieve a reliable segmentation all these small, non-significant, minima should be somehow ignored. The relative difference between peak heights then suggests an effective way to segment this image. It is possible to merge all the small basins taking into account not only their depths but, as well as, their areas and vol-umes.
Since the relief is being flooded from the bottom of each catchment basin, all local minima are progressively
de-Figure 3. 3D representation of the gray level image of Fig. 1.
tected and eventually merged as the flooding takes place, as illustrated in Fig. 5. The ABA algorithm embeds a set of rules into the original non-hierarchical watershed
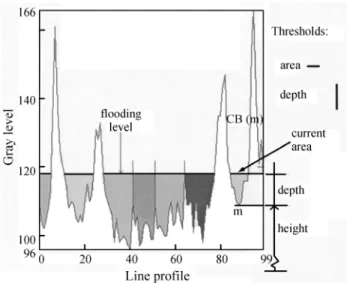
algo-rithm6 to guide the catchment basins merging process. Combining these rules it is possible to merge, to delay or even to prevent the catchment basin’s merging. The method was implemented to allow the free combination of these parameters, i.e.; the user has the option to chose which parameters to use. This simple expedient allows the direct segmentation of the original image without the need of previous filtering or markers detection steps, usually re-quired by the watershed transform. The catchment basin’s depths, areas and volumes are constantly monitored for each basin as the flooding occurs. An additional set of rules, providing intrinsecal filtering capacity, is used to suppress the noise. Figure 6 shows snapshots of the flooding process for different values of the height attribute.
3. Results and Discussion
Figures 7a, 7c and 7e show uranium oxide samples presenting grains, pores and acquisition defects. The pres-ence of strong noise and irregular lighting, prevent the direct segmentation of these images by conventional tech-niques. Applying an histogram thresholding technique, for example, would produce thick, broken, deviated
bounda-Figure 5. Attributes of a catchment basin.
ries and the regions would show undesirable holes due to the interior pores. Figures 7b, 7d and 7e present the respec-tive ABA segmentation results. In these examples, the
ABA transform was directly applied to the negative of original images. It can be seen that, despite the initial noise, almost all contours were correctly detected and the grains
Figure 6 (cont). Time sequence absorptions for different h values (depth) during flooding with ABA.
are clean and well defined. The ABA transform has been applied to several samples of ceramic images producing very good results. The determination of the 3D-grain size distribution can be done from these segmented images employing a stereometric method like the Saltykov method11.
4. Conclusions
When applied to real ceramic micrographs, the ABA method has proved to be efficient even in the presence of strong noise. The ABA transform is a practical solution to the over-segmentation problem. It employs a simple set of “merging criteria” thus enabling faster image segmentation and avoiding the explicit markers detection step found in conventional methods. Despite the need of interactively selecting the thresholds for the image geometrical attrib-utes, the ABA segmentation overall execution time are very good. The ABA transform preserves the linear execution
time of the watershed algorithm. It can be applied to a wide class of images, specially to those presenting similar seg-mentation problems like the ones here shown. The ABA transform is not restricted to the 2D image domain, 3D ou multi-dimensional images could be also be considered.
Acknowledgments
The authors would like to acknowledge ESIEE- France, CNPq, CAPES/MEC, FAPEMIG and CDTN /CNEN for the financial and technical support.
References
1. Andrade, M.C. “Um Método Topológico de Segmen-tação de Imagens por Atributos”. Ph.D. Thesis. Uni-versidade Federal de Minas Gerais, DCC-UFMG, 1998.
2. Andrade, M.C. et al., “Segmentation of microscopic images by flooding simulation: a catchment basins
merging algorithm”. In: Proceedings of Society for Imaging and PhotoOptical Engineering- SPIE, San Jose, USA, 1997.
3. Kong, T.; Rosenfeld, A. Digital Topology: Introduc-tion and Survey, Computer Graphics and Image Proc-essing - CGIP, v. 48, p. 357-393, 1989.
4. Bertrand, G. et al. A topological approach to image segmentation. In: Proceedings of Society for Imaging and PhotoOptical Engineering- SPIE, Vision and ge-ometry V, v. 2826, p. 65-67, 1996.
5. Serra, J. Image Analysis and Mathematical Morphol-ogy, Academic Press, 1982.
6. Vincent, L.; Soille, P. “Watersheds in digital spaces: An efficient algorithm based on immersion simula-tions”. Transactions on Pattern Analysis and Machine Intelligence, v. 13, n. 6, p. 583-598, 1991.
7. Meyer, F. “Un algorithme optimal de ligne de partage des eaux”. Congress AFCET, RFIA, Lyon, 1991.
8. Grimaud, M. “La geodesie numerique en morphologie mathematique. Application a la detection automatique de microcalcifications en mammographie numeri-que”, Centre de Morphologie Mathematique, École Nationale Supérieure de Mines de Paris - ENSMP, Ph.D. Thesis, 1991.
9. Beucher, S. “Segmentation d’image et Morphologie Mathematique” , Centre de Morphologie Mathema-tique, ENSMP, Ph.D. Thesis, 1990.
10. Vachier, C. “Extraction de characteristiques, segmen-tation d’image et morphology mathematique”, Ph.D. Thesis, Centre de Morphologie Mathematique, ENSMP, 1995.
11. Breen, E.J.; Jones, R. Attribute openings, thinnings and granulometrics. Computer Vision ans Image Processing, v. 64, n. 3, p. 377-389, Nov. 1996. 12. Saltykov, “Stereometrische Metallographie”, VEB,