Few Layer Reduced Graphene Oxide: Evaluation of the Best Experimental Conditions for
Easy Production
Giovani Pavoskia, Thuany Maraschinb, Fabiana de Carvalho Fima,c, Naira Maria Balzarettid,
Griselda Barrera Gallanda, Cássio Stein Mourae, Nara Regina de Souza Bassob*
Received: September 5, 2015; Revised: July 14, 2016; Accepted: November 3, 2016
This work aimed to produce graphene oxide with few graphene layers, a low number of defects, good
conductivity and reasonable amount of oxygen, adequate for use as iller in polymeric composites. Two starting materials were evaluated: expanded graphite and graphite lakes. The method of oxidation used was the Staudenmaier one, which was tested over diferent lengths of time. No appreciable diferences
were found among the oxidation times and so the lowest oxidation time (24 h) was chosen as the most
adequate. An investigation was also conducted into suitable temperatures for the reduction of graphite oxide. A temperature of 1000 ºC gave the best results, allowing a good quality material with few defects to be obtained. The reduction was also evaluated under inert and normal atmosphere. The best results were obtained when the least modiied material, e. g., graphite lakes, was used as a starting material, oxidized for 24h and reduced at 1000 ºC for 30 s in a quartz ampoule under a normal atmosphere.
Keywords: Graphene oxide, few layer graphene, graphite, graphene
* e-mail: [email protected]
1. Introduction
Research on new materials has grown exponentially in recent decades due to the requirements of manufacturers
in industry and a plethora of new uses, even in social life.
Graphene—a single sheet of carbon atoms organized in a planar bi-dimensional network—is part of a special class
of nanoillers with the potential to be used in composites.
Graphene, or few layer graphene, can be obtained from graphite (stacked layers of graphene), a low-cost starting material that
is found in nature as lakes or a powder with diverse particle sizes. The three largest producers of graphite are China, India
and Brazil1. Andre Geim and Konstantin Novoselov made an
outstanding contribution to the study of graphene’s properties and received the Nobel Prize of Physics in 2010 for their innovative experiments2,3. They discovered that graphene is
200 times stronger than steel and conducts electricity at room
temperature faster than any other known material. It is also highly transparent (97.3%) and extremely lightweight. Due
to these remarkable properties, a large variety of applications seems possible, including the creation of new materials and
innovative electronic products4. The properties of graphene
are very dependent on its structure and therefore it is of great importance investigating methodologies for producing large
quantities of single layer graphene. A structured material with a little number of layers of graphene is acceptable as well. In
any case, for nanotechnology applications a little amount of
defects is mandatory.
The routes to producing graphene include bottom-up and top-down processes. The bottom-up processis related to the synthesis of the material, while the top-down process refers to graphite exfoliation and it is performed until the desired number of graphene layers is achieved5. Chemical
and mechanical exfoliation of graphite are the only possible methods for obtaining graphene in large quantities and at a low cost6. Chemical exfoliation promotes the oxidation of
graphite through the introduction of functional groups such
as hydroxyl, carbonyl, and epoxide. These groups decrease
the interactions between the graphene layers, resulting in an
increase of the interlayer distance. The larger space between
the graphene sheets helps in carrying out exfoliation, leading to the formation of monolayer or few layers graphene oxide
(GO). Electrical properties are inluenced by the degree of
oxidation and by the surface chemistry of the GO powders7.
a Instituto de Química, Universidade Federal do Rio Grande do Sul – UFRGS, Av. Bento Gonçalves,
9500, 91570-970, Porto Alegre, RS, Brazil
b Faculdade de Química, Pontifícia Universidade Católica do Rio Grande do Sul – PUCRS, Av.
Ipiranga, 6681, 90619-900, Porto Alegre, RS, Brazil
c Centro de Tecnologia, Universidade Federal da Paraíba – UFPB, Cidade Universitária, s/n,
58051-900, João Pessoa, PB, Brazil
d Instituto de Física, Universidade Federal do Rio Grande do Sul – UFRGS, Av. Bento Gonçalves, 9500,
91570-970, Porto Alegre, RS, Brazil
e Faculdade de Física, Pontifícia Universidade Católica do Rio Grande do Sul – PUCRS, Av. Ipiranga,
Some authors compared the most commonly used
oxidation processes, e. g., the Staudenmaier10, Hofmann11
and Hummers12 methods, and showed that the Staudenmaier
method produces thermally reduced graphene with the lowest
proportion of defects. A comparison of the electrochemical
performance of the graphene samples obtained from each
of these three oxidation methods and a reduction at 1000ºC
showed that the sample prepared using the Hummers method presented higher heterogeneous transfer rates and lower overpotentials compared with the samples obtained via the
other two methods. These data indicate that the preparation method has a dramatic inluence on the properties of
graphene13. Some studies have modiied the Staudenmaier
process by experimenting with the oxidation time (between 1 and 7 days) and the HNO3:H2SO4 acids ratio (1:2 and 1:3), with the aim of obtaining graphene oxide with optimum
interlayer spacing. It was found that the optimal conditions
were obtained with HNO3:H2SO4 at a 1:3 volume ratio after
96 h of oxidation. The interlayer distances could be increased from 3.55 Ǻ of the original graphite to 9.13 Ǻ in modiied
Staudenmaier method12. However, the required reaction
time to achieve the appropriate level of intercalation and
oxidation also depends on the starting lake size15. Aksay
et al16. found that 96 h of oxidation reaction was enough to
completely oxidize 45 μm lakes but insuicient for 400
μm lakes. Oxygen can be eliminated partially through
the thermal or chemical reduction of GO17, resulting in reduced graphene oxide. However, it must be considered
that the reduced GO may present defects in the crystalline
network that can afect the graphene’s electrical properties
negatively18. Accordingly, intensive research into improving
the methodologies for reducing GO and restoring the conductive network is being undertaken19. Existing studies
have looked at thermal reduction at high temperatures (1050
°C)16,20 and at low temperatures (125-240 °C) 21,22, whilst other works have examined the inluence of the amount of
carbon and oxygen on conductivity after thermal reductions
at 900°C and 1100°C 23. Many of these studies are diicult to compare because they use diferent oxidation methods and reduction conditions. Difusion coeicient calculations suggest that there is a critical temperature of 550 ºC that
must be exceeded for exfoliation to occur 23. The present
work aims to develop a methodology for obtaining large quantities of few layer reduced graphene oxide from graphite at a low cost, while presenting good quality and a reasonable
amount of oxygen, which could be used as nanoiller for
composites24. Since the starting material plays an important role, we decided to compare two materials: graphite lakes (FK) and expanded graphite (EG). The oxidation process
used was the Staudenmaier10 method. Various reaction times were tested (24, 48, 72 e 96h). Thermal reduction processes at 600, 700, and 1000 °C, in diferent atmospheres (normal and inert), were also investigated.
2. Experimental
2.1. Materials
All materials were used as received. Expanded graphite Micrograph HC11 (EG) with an average size of around 50 μm and Gralake 9950 (FK) with a size of around 150 μm
were provided by Nacional de Graite Ltda. Brazil. Sulfuric
acid, nitric acid, hydrochloric acid, and potassium chlorate
were purchased from Merck Chemical Company (Brazil).
2.2. Graphite Oxide Synthesis
The graphite oxide (GO) was synthesized from EG and FK powders using the Staudenmaier method10. An acidic
mixture of H2SO4 (160 mL) and HNO3 (90 mL) was stirred
in a round-bottomed lask placed in an ice bath for 1 h. After this time, 10g of graphite (EG or FK) were added and stirred for 20 min. Subsequently, 110g of KClO3 was
added slowly over 15 mins, with the temperature being
controlled to prevent a rise above 35°C. Small amounts of KCl were added to minimize the risk of explosion, which can be caused by the ClO2 gas. The reaction was allowed to proceed over diferent intervals of time (24, 48, 72 e 96h). On completion of the reaction, an aqueous HCl solution (10% v/v) was added to the suspension in order to remove sulfate ions. Afterwards, washing with deionized water and
centrifuging (4500 rpm) were carried out several times in
order to reach pH 3. The resulting suspension was placed
in a dialysis membrane until the pH of solution was 5, and then the resulting brown suspension was dried in an oven at
150°C. The graphite oxide was then heated at 600, 700, and
1000oC for 30 s in an oven, using a closed quartz ampoule with either a normal or an inert atmosphere of argon.
2.3. Characterization
X-ray difraction (XRD) measurements for the powdered samples were performed on a difractometer (Rigaku, DMAX 2200) equipped with a Cu tube (λ = 0.15418 nm) and a secondary monochromator. The goniometer used was a Siemens D500 and the detector was the scintillator (NaI and Tl). XRD samples were prepared by coating the sample
holder with a uniform layer of the powdered samples at room
temperature. From the XRD parameters, the interlayer distances
(d002) in the graphene were estimated using Bragg’s Law 25. The grain size (C) was calculated using the Scherrer
equation26, 27:
.
cos
C
0 9
b
i
m
=
The number of graphene layers was calculated by dividing
the crystal size (C) by the interlayer distance (d) added to
the thickness of one graphene sheet (0.1 nm).
Raman analyses were performed at room temperature using an Olympus microscope and an iH320 Jobin Yvon
Spectrometer with a CCD (charged coupled device) detector, cooled by liquid nitrogen. The excitation source was a 10 mW HeNe laser (632.8 nm) and the acquisition time was 20 s.
GO samples were analyzed at 25 °C as pellets diluted in KBr by transmission FT-IR spectroscopy, using a Varian FTIR spectrophotometer (640-IR), which accumulated 32
scans at a 4 cm-1 resolution.
The fractions of C, H, and N in the graphite samples were analyzed using a Perkin-Elmer MCHNSO/2400 analyzer. A sample mass of 2 mg was employed in each analysis.
Scanning Electron Microscopy (SEM) was performed with a Phillips microscope (model XL30) operating at 20 kV, using aluminum stubs and gold metallization.
Transmission Electron Microscopy (TEM) images of the reduced graphene oxide were obtained using a JEOL 2010 transmission electron microscope operated at 200 kV.
All the samples were prepared by depositing an acetone suspension drop on a copper grid (300 mesh) covered with
amorphous carbon.
Electrical impedance spectroscopy was performed to measure the electrical conductivity of the samples. A sine wave with 1.0 Vpp was applied to the sample and the frequency
was varied from 1 to 106 Hz. The current and the potential diferences between the samples’ faces were measured. The phase diference between the voltage and current in the
sample allows the determination of the real and imaginary
parts of electrical impedance. The real part is associated with conductivity. A numerical itting algorithm was applied to the data, which provided the conductivity values.
3. Results and Discussion
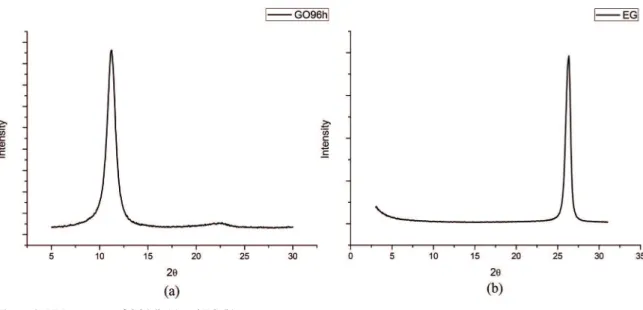
In order to evaluate the need for pre-treatment in the oxidation process, two diferent types of graphite were employed as starting materials: expanded graphite (EG) and graphite lake (FK). Figure 1 shows the XRD patterns of EG and FK. It is possible to observe the interlayer spacing
along the c-axis—(d002) at 26.5º and (d004) at ~55º—as sharp
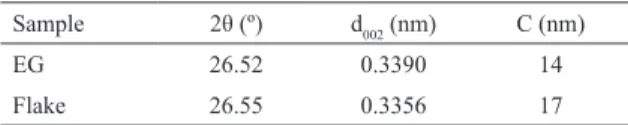
peaks for FK. In Table 1, it can be seen that both graphites
present a very close spacing between the graphene layers but
the crystal size of EG is smaller, which indicates a smaller graphene stack. The inexistence of peak at 55º in EG suggests it has a lower aspect ratio than FK.
Raman spectroscopy is commonly considered to be the most important technique in characterizing the structure of graphitic materials28. The main Raman features of graphene
and graphite are the G band (~1580 cm-1), the D band
(~1330 cm-1) and the G´ band (~2670 cm-1) for an excitation wavelength of 632.8 nm. The G band originates from the
Figure 1: XRD patterns of starting graphite materials
Table 1: Data obtained from the XRD patterns of EG and FK
Sample 2θ (º) d002 (nm) C (nm)
EG 26.52 0.3390 14
Flake 26.55 0.3356 17
in-plane vibration of sp2 carbon atoms. The D band is related
to crystal disorder due to sp3 defects in the sp2 lattice and the G´ band is an overtone of the disorder-induced D-band.
For single layer graphene, the G´ band appears as a sharp and symmetrical peak, whereas it becomes broader when the thickness increases (for example, in few layer graphene)29.
Figure 2 shows the Raman spectra of the two types of graphitic
structures used in this work, namely, FK and EG. It can be observed that both structures present defects (peak D at 1330
cm-1). The larger and less intense G´ band suggests that the EG sheets contain more defects compared to the FK sheets.
Figure 2: Raman spectra of starting graphite materials
3.1. Reduced graphene oxide obtained from
expanded graphite
The strong oxidation of EG using Staudenmaier methodology over 96 h resulted in graphite oxide (GO96h).
various oxygen-containing functional groups in the graphite structure2. Figure 3 shows the XRD patterns of GO prepared from EG oxidation.
The data listed in Table 2 refers to the parameters of
XRD and the percentage of carbon and oxygen obtained from CHN analysis for EG, GO96h and reduced GO at diferent temperatures (600, 700 or 1000°C).
The formation of GO96h is conirmed by the absence of the (002) difraction line at 26.52º (d-space = 0.33 nm) that is typical of EG and the appearance of the difraction peak at 11.23° (d-space = 0.78 nm) (Figure 3). Moreover,
a marked decrease in the crystal size (8 nm) compared to
the starting graphite (14 nm) was also observed. During the
oxidation process, the insertion of various oxygen-containing functional groups that are bonded to the edges of basal
planes of the graphite structure occurs. The ratio between the carbon and oxygen obtained by CHN analysis shows that oxidation was almost complete after 96 h (C/O , 1). A high
percentage of oxygen is very important for the expansion and exfoliation of graphene sheets, since the percentage represents the number of molecules that will decompose in gases during thermal treatment15. Aksayet al.16 determined
the composition of gases that cause the rapid expansion
of graphite—namely, CO2 and H2O—demonstrating they
originate from the exothermic decomposition of the hydroxyl
and epoxide groups of GO.
When EG is oxidized to become GO, the insertion of
oxygen functional groups decreases electrical conductivity due to a disruption in the planar sp2 carbon sheets because
of the introduction of sp3-hybridized carbons5. In order to restore the π-network, the GO was submitted to thermal reduction and the inluence of the reduction temperature on the reduced graphene oxide was evaluated. The thermal treatments were carried out in an oven using a quartz ampoule.
Figure 4 shows the XRD patterns of GO96h samples that were heated at 600, 700, and 1000 °C (GO96h6, GO96h7, and GO96h10, respectively). All the reduced GO samples showed a broad peak that corresponded to 0.78 nm GO
interlayer separation, indicating that the reduction process
was not complete. A very large peak at 2θ , 26.5° reappeared for the samples reduced at 600 and 700°C, showing that the graphitic structure was partially restored. However, the peak
broadens even more for higher temperatures, presumably
due to the corrugated structure of the reduced GO sheets. Although the absence of the (002) difraction line at 2θ = 26.5° in the XRD spectrum of GO96h10 suggests that all
stacking was lost, it may also indicate that any remaining stacking was disordered16.
Figure 3: XRD patterns of GO96h (a) and EG (b)
Table 2: Data obtained from the XRD patterns and CHN of EG, GO96h and reduced GO96h at diferent temperatures.
Sample 2θ (º) d002 (nm) Grain size C (nm) CHN
%C %O
EG 26.52 0.33 14 97.5 2.4
GO96h 11.23 0.78 8 49.9 47.8
*GO96h6 10.74 24.14 0.82 0.37 9 3 73.3 25.7
GO96h7 10.95 24.36 0.81 0.37 8 3 74.1 24.7
GO96h10 10.79 0.82 11 80.2 19.0
Figure 4: XRD patterns of GO and reduced GO96h at diferent temperatures
According to Table 2, the data from the elemental
analysis is consistent with the results obtained from XRD. An increase in the C/O ratios in the reduced samples can be seen when compared with the starting GO96h (1.0), evidencing a successful thermal reduction. Although oxygen functional
groups were still retained in the structure at all the evaluated
temperatures, it was observed that the C/O ratio increased with increasing of the reduction temperature.
The oxygen-functionalized graphene sheets present opportunities for several applications, such as the preparation of composites in which those groups can have an important role in the interaction between graphene sheets and the polymeric matrix7. Covalent functionalization of graphene with the
polymer can improve the dispersion in nanocomposites8. For
example, some hydroxyl functional groups on the surface of graphene were used to support the catalyst system, in the in situ polymerization of ethylene, improving the graphite exfoliation in the polymeric matrix and consequently the nanocomposite properties9. Table 2 also shows that the diferences in the
amount of oxygen in the samples reduced at temperatures of
600 and 700°C are not signiicant. Even at the highest reduction temperature, 1000ºC, roughly 19% of oxygen atoms remained.
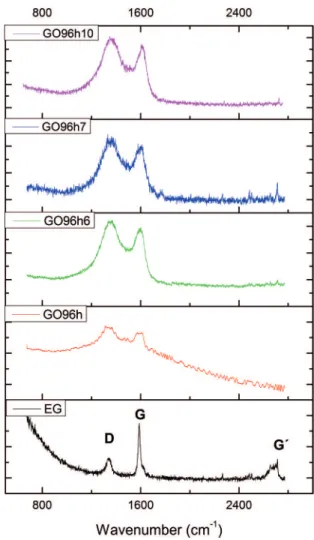
Figure 5 shows the Raman spectra for thermally reduced
GO96h. According to the Raman spectra, part of the sp2 carbon network was restored, though with many defects.
Considering that 96 h of oxidation reaction seems to damage the graphitic structure of EG excessively, shorter
reaction times (24, 48, and 72 h) were evaluated with the purpose of reducing the defects in the graphene sheets obtained
after thermal reduction. However, after thermal reduction of the GO samples at 1000°C, the Raman spectra showed no signiicant diferences, when compared with using an oxidation time of 96 h (see Figure 6).
In fact, these Raman spectra show that a shorter EG
oxidation time neither reduces the prevalence of defects, nor
afects the stacking ordering. The sp2 structure, therefore, is not recovered completely during the reduction process.
Figure 5: Raman spectra of EG, GO96h and reduced GO at 600,
700 and 1000 °C
Figure 6: Raman spectra of EG oxidized over diferent reaction
times (24, 48, and 72h) and reduced at 1000 °C
Considering the EG exfoliation, it is possible to conclude
that a high degree of oxidation was obtainedeven after the lowest
period of oxidation (24 h), giving C/O ratios close to 1, reducing the crystal size, and increasing interlayer distances. However, even at the highest temperature (1000ºC), the reduction was insuicient
3.2. Reduced graphene oxide from graphite lake
Using the same experimental approach as for EG, GO samples were prepared from graphite lakes (FK). Diferent oxidation times (96, 72, 48, and 24 h) were evaluated. Figure 7 shows some of the typical XRD patterns for GO obtained from FK.
Figure 7: XRD patterns of FK oxidized over 24 (FK24h) and 48
h (FK48h)
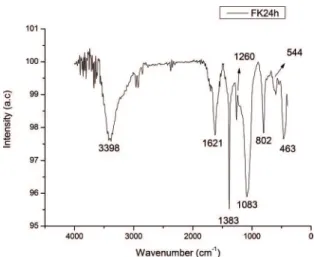
Figure 8: Transmission FTIR spectrum for FK oxidized over 24 h
(FK24h), dispersed in KBr
In contrast to what was observed with EG, FK was only partially oxidized over all the evaluated reaction times. The existence of fewer defects in the FK structure relative to EG may afect the oxidative breakup and a time longer than 96
hours may be required for complete oxidation to occur 16. Elemental analysis was performed on the graphene oxides in order to evaluate the degree of oxidation (Table 3).
Table 3: Elemental analysis of GO obtained from diferent lengths
of oxidation time.
Sample %C %H %N %O
FK24h 64.6 2.0 0.7 32.6
FK48h 62.3 2.1 0.7 34.8
FK72h 68.8 1.6 0.6 28.9
FK96h 68.0 1.6 0.7 29.6
According to Table 3, the degree of oxidation was
practically independent of the reaction time. It is possible
to conclude, therefore, that a 24-hour period of oxidation is
long enough to prepare oxidized graphite lake with about 30% oxygen.
The FTIR spectrum of graphite oxide FK24h (presented
in Figure 8) shows the stretching vibrations of O-H and
C-O at 3398 and 1083cm-1 respectively. The stretching C=C
double bonds of the condensed rings of graphene appear at 1621cm-1. This band has a shoulder at around 1700cm-1 that
can be attributed to the presence of some carbonyl groups
(C=O) in small amounts. The presence of some stretching vibrations from C-H bonds (C sp3) is also evident between
2800 and 3000cm-1.
The thermal reduction of the lake oxidized over 24 h was tested at 600, 700, and 1000 ºC. A very simple method
of reduction was evaluated using an open quartz capsule
placed in the oven. However, this procedure resulted on the
loss of the most exfoliated fractions, especially at the highest
reduction temperatures. Thus, for the reduction reactions, a
closed quartz ampoule was chosen instead, which was tested
using normal and inert atmospheres. Figure 9 shows the XRD patterns for the samples obtained after FK was oxidized over 24 h and reduced at 600, 700, and 1000 °C in a closed quartz ampoule, both in an inert atmosphere (FK24h6APIN, FK24h7APIN, FK24h10APIN) and a normal atmosphere (FK24h6AP, FK24h7AP, FK24h10AP). Table 4 gives the XRD patterns for the data obtained.
According to Figure 9, the reduction of GO in an inert
atmosphere at temperatures of 600 and 700 °C presents large difraction peaks, suggesting heterogeneity in the stacking distances. At a reaction temperature of 1000°C, the peak is
thinner, even though the average interlayer distance is the
same, namely 0.35 nm, which is higher than in the starting graphite (0.33 nm in FK). In all cases, there was signiicant exfoliation from about 40 graphenes per crystal in FK to 5-11 graphenes per crystal in the reduced graphene oxides.
The reduction performed in a closed quartz ampoule in a
normal atmosphere was more eicient at a temperature of 1000°C because at 600 and 700°C, there is still a broad difraction band at 11.29°, which is characteristic of GO. It can thus be seen that the reduction is less eicient at lower temperatures. At a reduction temperature of 1000ºC, the
exfoliation is the same in an inert or a normal atmosphere
(11 graphenes per crystal).
The Raman spectra in Figure 10 show that the oxidized
graphite (FK24h) reduced at 1000°C in a normal atmosphere
gives the best recuperation of the sp2 network, compared
with the sample reduced at lower temperatures or in an inert
atmosphere. The ratio between the intensities of the D and G
Figure 9: XRD patterns for GO samples reduced in a closed quartz ampoule in (a) an inert (APIN) and (b) a normal (AP) atmosphere
Table 4: Data obtained from the XRD patterns for reduced GO
samples treated in a closed quartz ampoule.
Sample 2θ (°) d (nm) C (nm) Graphene #
FK 26.55 0.33 17 40
FK24h6APIN 25.25 0.35 2 5
FK24h6AP 25.65 0.35 3 7
FK24h7APIN 25.08 0.35 3 6
SFK24h7AP 25.67 0.35 9 20
FK24h10APIN 25.52 0.35 5 11
FK24h10AP 25.71 0.35 5 11
Figure 10: Raman spectra of GO samples reduced in a quartz ampoule in (a) an inert and (b) a normal atmosphere
prevalence in graphite. In Figure 10, the ID/IG ratios for normal and inert atmospheres are 0.8 and 1.1 respectively, conirming the presence of fewer defects in the reduced oxide obtained at 1000ºC in a normal atmosphere, compared with other samples.
According to the results of the elemental analysis (Table
5), an increase in the reaction temperature from 600 to 1000°C raises the C/O ratio, as expected. The use of an inert or a normal atmosphere does not have a signiicant inluence on the amount of oxygen that occurs in the reduced graphite. After reduction at the highest temperature (1000°C), there is still a reasonable amount of oxygen present (13%), which
can be used in compatibility reactions for the preparation of
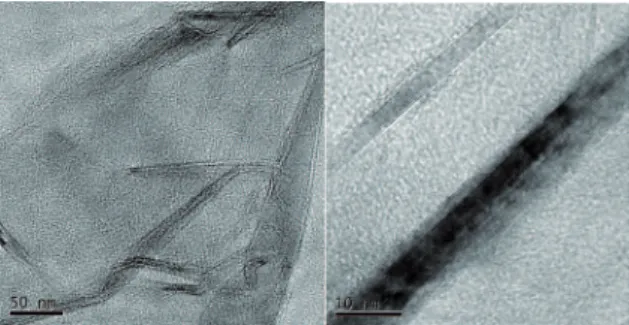
Figure 11: HRTEM micrographic image of oxide graphene oxidized
over 24h and thermally reduced at 1000°C in a closed quartz ampoule in a normal atmosphere.
Table 5: Elemental analysis of reduced GO obtained in a closed
ampoule.
Sample %C %O
GO 64.7 33.9
FK24h6APIN 72.3 27.0
FK24h7APIN 85.5 14.2
FK24h10APIN 86.7 13.1
FK24h10AP 86.3 13.2
Table 6: Electrical conductivity of raw materials oxidized and
reduced graphite.
Sample Electrical conductivity (S/cm)
FK 6.0 x10⁻²
EG 3.5 x 10⁻²
FK24h 1.2 x 10⁻²
FK24h6APIN 1.6 x 10⁻¹
FK 24h7APIN 2.7 x 10⁻¹
FK24h10PIN 2.7 x 10⁻¹
FK24h10AP 1.7 x 10⁻¹
The HRTEM image of the FK24h10AP sample shows a few layer graphene sheet, which indicates that an efective exfoliation of graphite oxide has taken place (Figure 11).
Table 6 shows the conductivity values for the samples, measured by electrical impedance spectroscopy prior to and
after reduction treatment. One can observe that the oxidation of the FK decreased the electric conductivity of sample FK24h
slightly; however, the reduction process, independent of the
temperature, was very eicient in restoring the sp2 network, which is responsible for conductivity. The oxidation process
and the reduction resulted in a material composed of few layer graphene, which is roughly one order of magnitude
more conductive than the raw material.
4. Conclusions
Using expanded graphite (50 μm, crystal size 14 nm) as a starting material to obtain reduced graphite oxide produced
few layer graphene with many defects. The raw untreated
graphite (lake, 150 μm, crystal size 17 nm) was found to be the starting material most appropriate for producing reduced
graphene oxide through the modiied Staudenmaier method. Reduced graphene oxide containing roughly 13% oxygen, a
low density of defects and a low number of graphene layers
was obtained from oxidation of the graphite lake over a 24 h period, followed by thermal reduction at 1000 ºC in a quartz ampoule using a normal atmosphere. The use of
an inert atmosphere during the reduction process did not improve the structure or electrical properties of the resulting
reduced graphene oxide. The electrical conductivity of the
few layer graphene obtained was ten times superior to that
of the starting graphite.
The few layer graphene material with a low defect density that was obtained is adequate for many applications, such
as use in polymeric composites, for example.
5. Acknowledgments
The authors would like to thank CNPq, CAPES and FAPERGS for inancial support. We also thank Nacional de Graite Ltda., Brazil for the Micrograph HC11 and Gralake 9950 supply.
6. References
1. US Geological Survey. Mineral Commodity Summaries. Washington:
US Department of the Interior; 2013. Available from: <http:// minerals.usgs.gov/minerals/pubs/mcs/2013/mcs2013.pdf>. Access in: 15/10/2014.
2. Novoselov KS, Geim AK, Morozov SV, Jiang D, Zhang Y, Dubonos SV, et al. Electric ield efect in atomically thin carbon ilms.
Science. 2004;306(5696):666-669.
3. The Oicial Web Site of the Nobel Prize. The Nobel Prize in Physics 2010. Nobelprize.org; 2010. Available from: <http://
www.nobelprize.org/nobel_prizes/physics/laureates/2010/>. Access in: 04/01/2012.
4. Salavagione HJ, Martinez G, Ellis G. Recent Advances in the Covalent Modiication of Graphene with Polymers. Macromolecular Rapid Communications. 2011;32(22):1771-1789.
5. Moura CS, Amaral L. Carbon nanotube ropes proposed as particle pipes. Carbon. 2007;45(9):1802-1807.
6. Wu ZS, Ren W, Gao L, Liu B, Jiang C, Cheng HM. Synthesis of high-quality graphene with a pre-determined number of layers.
Carbon. 2009;47(2):493-499.
7. Guerrero-Contreras J, Caballero-Briones F. Graphene oxide powders with diferent oxidation degree, prepared by synthesis variations of the Hummers method. Materials Chemistry and Physics. 2015;153:209-220.
8. Zhang M, Li Y, Su Z, Wei G. Recent advances in the synthesis and applications of graphene-polymer nanocomposites. Polymer Chemistry. 2015;6(34):6107-6124.
9. Pavoski G, Maraschin T, Milani MA, Azambuja DS, Quijada R, Moura CS, et al. Polyethylene/reduced graphite oxide nanocomposites with improved morphology and conductivity.
10. Staudenmaier L. Verfahren zur Darstellung der Graphitsäure. Berichte der deutschen chemischen Gesellschaft. 1898;31(2):1481-1487.
11. Hofmann U, König EZ. Untersuchungen über Graphitoxyd.
Zeitschrift für Anorganische und Allgemeine Chemie.
1937;234(4):331-336.
12. Hummers WS Jr., Ofeman RE. Preparation of graphitic oxide.
Journal of the American Chemical Society. 1958;80(6):1339.
13. Poh HL, Šaněk F, Ambrosi A, Zhao G, Sofer Z, Pumera M.
Graphenes prepared by Staudenmaier, Hofmann and Hummers
methods with consequent thermal exfoliation exhibit very diferent electrochemical properties. Nanoscale. 2012;4(11):3515-3522.
14. Sheshmani S, Fashapoyeh MA. Suitable Chemical Methods
for Preparation of Graphene Oxide, Graphene and Surface
Functionalized Graphene Nanosheets. Acta Chimica Slovenica.
2013;60(4):813-825.
15. Jang BZ, Zhamu A. Processing of nanographene platelets (NGPs) and NGP nanocomposites: a review. Journal of Materials Science. 2008;43(15):5092-5101.
16. McAllister MJ, Li JL, Adamson DH, Schniepp HC, Abdala AA, Liu J, et al. Single Sheet Functionalized Graphene by Oxidation and Thermal Expansion of Graphite. Chemistry of Materials.
2007;19(18):4396-4404.
17. Schniepp HC, Li J, McAllister MJ, Sai H, Herrera-Alonso M, Adamson DH, et al. A Functionalized Single Graphene Sheets Derived from Splitting Graphite Oxide. The Journal of Physical Chemistry B. 2006;110(17):8535-8539.
18. Stankovich S, Dikin DA, Piner RD, Kohlhaas KA, Kleinhammes A, Jia Y, et al. Synthesis of graphene-based nanosheets via chemical reduction of exfoliated graphite oxide. Carbon.2007;45(7):1558-1565.
19. Herrera-Alonso M, Abdala AA, McAllister MJ, Aksay IA, Prud’homme RK. Intercalation and Stitching of Graphite Oxide with Diaminoalkanes. Langmuir.2007;23(21):10644-10649.
20. Becerril HA, Mao J, Liu Z, Stoltenberg RM, Bao Z, Chen Y. Evaluation of Solution Processed Reduced Graphene Oxide Films as Transparent Conductors. ACS Nano.
2008;2(3):463-470.
21. Jung I, Dikin DA, Piner RD, Ruoff RS. Tunable Electrical Conductivity of Individual Graphene Oxide Sheets Reduced at “Low” Temperatures. Nano Letters.2008;8(12):4283-4287.
22. Jin M, Jeong HK, Kim TH, So KP, Cui Y, Yu WJ, et al. Synthesis
and systematic characterization of functionalized graphene
sheets generated by thermal exfoliation at low temperature.
Journal of Physics D: Applied Physics.2010;43(27):275402.
23. Pei S, Cheng HM. The reduction of graphene oxide. Carbon.
2012;50(9):3210-3228.
24. Mural PKS, Sharma M, Madras G, Bose S. A critical review
on in situ reduction of graphene oxide during preparation
of conducting polymeric nanocomposites. RSC Advances.
2015;5(41):32078-32087.
25. Aladekomo JB, Bragg RH. Structural transformations induced in graphite by grinding: Analysis of 002 X-ray difraction line proiles. Carbon.1990;28(6):897-906.
26. Scherrer P. Bestimmung der Grösse und der inneren Struktur von Kolloidteilchen mittels Röntgenstrahlen. Nachrichten von der Gesellschaft der Wissenschaften zu Göttingen,
Mathematisch-Physikalische Klasse. 1918;1918(2):98-100.
27. Sahoo SK, Mallik A. Simple, fast and cost-effective electrochemical synthesis of few layer graphene nanosheets.
NANO. 2014;10(2):1550019.
28. Li ZQ, Lu CJ, Xia ZP, Zhou Y, Luo Z. X-ray difraction patterns of graphite and turbostratic carbon. Carbon. 2007;45(8):1686-1695.