Wake Traits
Christopher J. Winrow1., Deanna L. Williams2., Andrew Kasarskis3
, Joshua Millstein3, Aaron D.
Laposky2, He S. Yang2, Karrie Mrazek2, Lili Zhou2, Joseph R. Owens2, Daniel Radzicki2, Fabian Preuss2, Eric E. Schadt3, Kazuhiro Shimomura2, Martha H. Vitaterna2, Chunsheng Zhang4, Kenneth S. Koblan1, John J. Renger1, Fred W. Turek2*
1Department of Depression and Circadian Rhythms, Merck Research Laboratories, West Point, Pennsylvania, United States of America,2Center for Sleep and Circadian Biology, Northwestern University, Evanston, Illinois, United States of America,3Genetics Department, Rosetta Inpharmatics LLC, a wholly owned subsidiary of Merck & Co., Inc., Seattle, Washington, United States of America,4Informatics Custom Analysis Department, Rosetta Inpharmatics LLC, a wholly owned subsidiary of Merck & Co., Inc., Seattle, Washington, United States of America
Abstract
Despite decades of research in defining sleep-wake properties in mammals, little is known about the nature or identity of genes that regulate sleep, a fundamental behaviour that in humans occupies about one-third of the entire lifespan. While genome-wide association studies in humans and quantitative trait loci (QTL) analyses in mice have identified candidate genes for an increasing number of complex traits and genetic diseases, the resources and time-consuming process necessary for obtaining detailed quantitative data have made sleep seemingly intractable to similar large-scale genomic approaches. Here we describe analysis of 20 sleep-wake traits from 269 mice from a genetically segregating population that reveals 52 significant QTL representing a minimum of 20 genomic loci. While many (28) QTL affected a particular sleep-wake trait (e.g., amount of wake) across the full 24-hr day, other loci only affected a trait in the light or dark period while some loci had opposite effects on the trait during the light vs. dark. Analysis of a dataset for multiple sleep-wake traits led to previously undetected interactions (including the differential genetic control of number and duration of REM bouts), as well as possible shared genetic regulatory mechanisms for seemingly different unrelated sleep-wake traits (e.g., number of arousals and REM latency). Construction of a Bayesian network for sleep-wake traits and loci led to the identification of sub-networks of linkage not detectable in smaller data sets or limited single-trait analyses. For example, the network analyses revealed a novel chain of causal relationships between the chromosome 17@29cM QTL, total amount of wake, and duration of wake bouts in both light and dark periods that implies a mechanism whereby overall sleep need, mediated by this locus, in turn determines the length of each wake bout. Taken together, the present results reveal a complex genetic landscape underlying multiple sleep-wake traits and emphasize the need for a systems biology approach for elucidating the full extent of the genetic regulatory mechanisms of this complex and universal behavior.
Citation:Winrow CJ, Williams DL, Kasarskis A, Millstein J, Laposky AD, et al. (2009) Uncovering the Genetic Landscape for Multiple Sleep-Wake Traits. PLoS ONE 4(4): e5161. doi:10.1371/journal.pone.0005161
Editor:Aimee K. Zaas, Duke University, United States of America
ReceivedSeptember 15, 2008;AcceptedMarch 8, 2009;PublishedApril 10, 2009
Copyright:ß2009 Winrow et al. This is an open-access article distributed under the terms of the Creative Commons Attribution License, which permits unrestricted use, distribution, and reproduction in any medium, provided the original author and source are credited.
Funding:This work was supported by a research grant from Merck and Co. (FWT) and by the Army Research Office (ARO), award number DAAD19-02-1-0038 from the Defense Advance Research Projects Agency. Investigators from the sponsoring institution (Merck/Rosetta) were involved in data analysis (genotyping, QTL identification, Baeysian network construction and statistics) and interpretation of the results.
Competing Interests:The authors have declared that no competing interests exist. * E-mail: [email protected]
.These authors contributed equally to this work.
Introduction
The behavioral states of sleep and wake, as defined by electroencephalogram (EEG) and electromyogram (EMG) activity, are composed of multiple sub-component measures with sleep itself being divided into the primary states of Rapid Eye Movement (REM) and Non Rapid Eye Movement (NREM) sleep in mammals [1,2]. Although there is considerable evidence supporting a strong genetic basis for some sleep-wake traits and sleep disorders [3], as well as speculation on the polygenic nature of sleep due to the complexity of the behavior [4], little has been done to unravel the complex network of genetic and physiological interactions that must underlie this universal behavior in mammals. While sleep-wake recordings in recombinant mouse
different traits to assess whether sleep-wake traits that have been presumed to be related actually share common genetic influences. The breeding scheme to produce a segregating mouse population was set up to enable both the identification of QTL, as well as to allow for the mapping of a chemically-induced unknown mutation that resulted in a greater amount of wakefulness (referred to as theSleeplessmutation) on a C57BL/6J (B6) background. To increase genetic variants for QTL analysis, we selected a counter strain that had substantially different sleep-wake characteristics from B6; the BALB/cByJ (BALB) strain showed significant differences in sleep fragmentation (e.g. more stage shifts, shorter sleep/wake bout durations) but similar amounts of wake compared to wild-type B6 mice. The Sleepless
mutation segregates as a single autosomal dominant mutation, making the cross potentially useful in genetically mappingSleepless. Male B6 mice presumed heterozygous for Sleepless based on phenotype were mated to female BALB mice from the Jackson Laboratory to create F1 animals. F1 male mice showing a high wake phenotype (presumably carrying the mutation) were then crossed with wild-type female B6 mice to create 269 [B66(BALBxB6)F1]N2 (N2) male progeny. Thus, the N2 mice produced represented a genetically heterogeneous population with which we hoped to investigate: 1) mapping of the Sleepless
mutation, which we will not elaborate on here, 2) a genome wide analysis for linkage between multiple sleep-wake traits and
genomic regions and 3) the functional relationships among different sleep-wake traits.
Results and Discussion
Comparison of Sleep-wake Traits
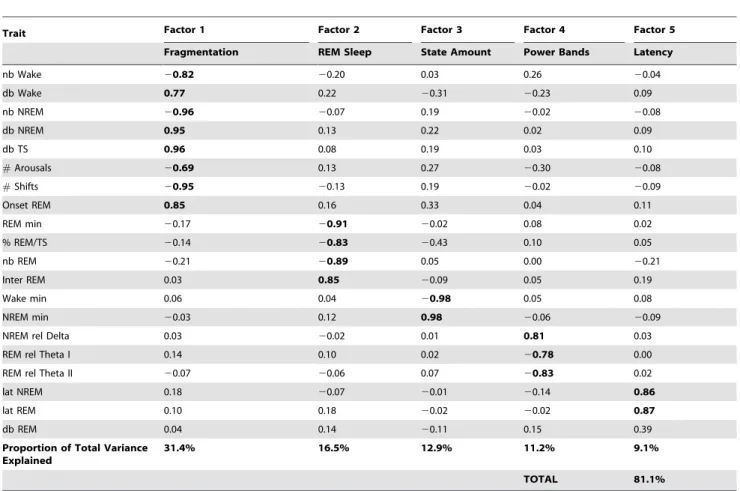
Full EEG and EMG recordings over 48 hrs were collected from each N2animal and sleep-wake parameters, defined by visually characterizing each 10 second epoch as wake, NREM or REM sleep, and performing EEG spectral analysis, allowed for the measurement of 72 parameters (See Supporting Information) defining sleep structure and continuity as well as EEG waveform activity. Before undertaking any of the analyses presented here, we selected from the 72 parameters we measure 20 traits that are most commonly used in the literature to describe sleep in rodent models. Applying factor analysis [10] to 1000 bootstrapped samples of the 20 sleep-wake traits over the 24-hr period allowed for an unbiased identification of structure within the multitude of variables (Table 1 and Supporting Information Table S2 for the bootstrapped 95% confidence intervals). These factors clustered into five trait dimensions that represent state amount, sleep fragmentation, REM sleep traits, latency to REM or NREM sleep and relative EEG spectral power. These five factors validate and confirm our a priori expectations that there are distinct and separable aspects of sleep. A similar approach has recently been
Table 1.Factor Analysis of Sleep-Wake Traits.
Trait Factor 1 Factor 2 Factor 3 Factor 4 Factor 5
Fragmentation REM Sleep State Amount Power Bands Latency
nb Wake 20.82 20.20 0.03 0.26 20.04
db Wake 0.77 0.22 20.31 20.23 0.09
nb NREM 20.96 20.07 0.19 20.02 20.08
db NREM 0.95 0.13 0.22 0.02 0.09
db TS 0.96 0.08 0.19 0.03 0.10
#Arousals 20.69 0.13 0.27 20.30 20.08
#Shifts 20.95 20.13 0.19 20.02 20.09
Onset REM 0.85 0.16 0.33 0.04 0.11
REM min 20.17 20.91 20.02 0.08 0.02
% REM/TS 20.14 20.83 20.43 0.10 0.05
nb REM 20.21 20.89 0.05 0.00 20.21
Inter REM 0.03 0.85 20.09 0.05 0.19
Wake min 0.06 0.04 20.98 0.05 0.08
NREM min 20.03 0.12 0.98 20.06 20.09
NREM rel Delta 0.03 20.02 0.01 0.81 0.03
REM rel Theta I 0.14 0.10 0.02 20.78 0.00
REM rel Theta II 20.07 20.06 0.07 20.83 0.02
lat NREM 0.18 20.07 20.01 20.14 0.86
lat REM 0.10 0.18 20.02 20.02 0.87
db REM 0.04 0.14 20.11 0.15 0.39
Proportion of Total Variance Explained
31.4% 16.5% 12.9% 11.2% 9.1%
TOTAL 81.1%
Factor loadings (Statistica, StatSoft, Inc.) of the 20 sleep-wake variables in the 24-hr period are shown with the factor-determining loading values bolded (generally greater than60.75). The 5 factors account for 81 percent of the total variance in the data. See Supporting Information for complete trait descriptions, and Supporting Information Table S2 for a 10006bootstrap-obtained estimate of the 95% confidence intervals of the factor loading values.
used on human data to identify three principal components of human sleep that involved 1) sleep duration, 2) NREM intensity and 3) sleep continuity [11]. Means and standard deviations of the 20 sleep traits in the N2 population are presented in Supporting Information Table S1.
Quantitative Trait Loci Analysis
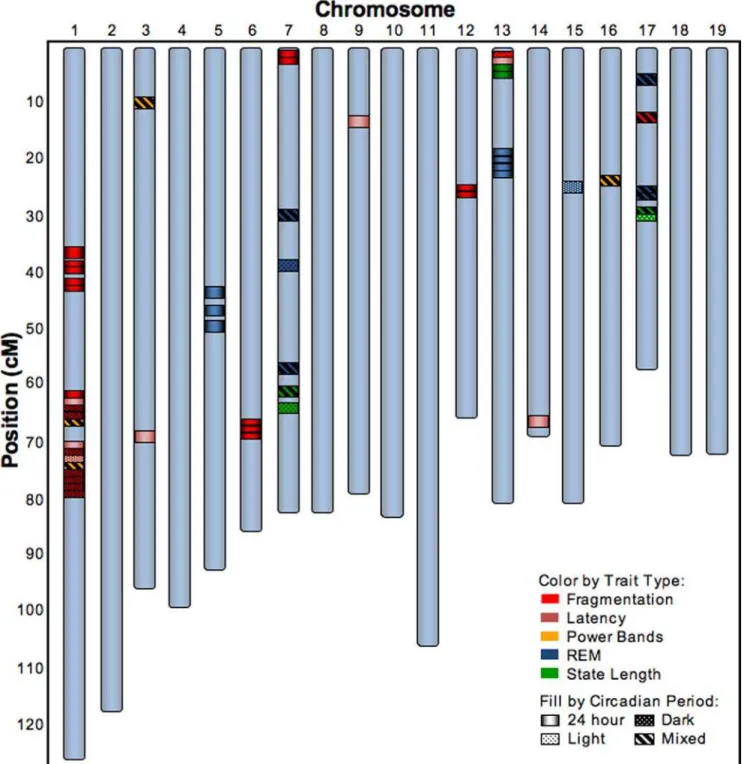
Linkage analysis was conducted with a set of 2,310 informative SNPs across the 19 autosomes from 269 N2 mice for which both complete and high quality genotype and sleep-wake phenotype data were obtained. The 48-hr sleep recording period was partitioned into two 24-hr periods and further into a light and dark phase yielding four recording time domains per animal during which each sleep trait was computed (see Supporting Information for further details on the statistical methods). Linkage analysis revealed a total of 52 significant QTL (comprising a minimum of 20 genomic loci) for the traits studied in this cross with LOD scores ranging from 2.5 to 7.6 (Fig. 1 and Table 2). Over half of these (28) reflected trait variation occurring across the full 24-hr day, indicating that much of the genetic control of sleep acts consistently across the light and dark periods. However, 12 additional QTL, termed ‘‘mixed-effect QTL’’, reflected trait variation across the full 24-hr period where the direction and/or magnitude of the effect of the locus on the trait is statistically different between the light and dark periods. This indicates that the genotype at a locus can have the opposite or a quantifiably different effect on the same trait during the light versus the dark phase. In some cases, this effect was quite dramatic, as was observed for the wake min QTL at Q17@29 (LOD 7.6) where the estimated effect of the BALB genotype at this locus was 8.1 min in the light but224.7 min in the dark (Supporting Information Table S3). Finally, some QTL were only detected in the dark (N = 9) or in the light (N = 3), indicating that the genotype at some loci only influenced sleep-wake traits during certain periods of the 24-hr day. We found that the QTL associated with any specific trait can be highly time- dependent, adding another dimension to the richness of the genetic landscape underlying sleep-wake traits. For example, while REM min over 24 hrs mapped to Q5@49 (LOD 4.2) and Q13@23 (LOD 6.3), REM min during the light mapped to Q7@40 (LOD 3.6), while a mixed effect on REM min mapped to Q17@29 (LOD 4.9). We also found that different trait groups show a bias as to whether they are affected by QTL in a similar manner across the 24-hr day, as opposed to QTL having different effects on the traits in the light versus the dark. For example, 19 of the 21 fragmentation QTL (Fig. 1, red symbols) were linked to the trait in the dark period or over the full 24 hrs, while all 4 of the EEG power band QTL fell in the mixed-effect category (Fig. 1, yellow symbols). These findings indicated that the genetic regulation of a single sleep-wake trait was highly dependent on circadian time or the environmental light-dark cycle.
Analysis of such a large genotype/phenotype data set allowed us to observe intricacies in the genetic landscape in the control of specific sleep-wake traits not previously detected. For example, while both db REM and nb REM together determined the total amount of REM sleep, these two REM traits were at least partially under differential genetic control (Fig. 1), since QTL for db REM mapped to Q5@49 (LOD 6.3) and Q13@23 (LOD 3.3), while QTL for nb REM mapped to Q7@32 (LOD 4.3) and Q17@29 (LOD 3.0). While it may be expected that QTL for mathemat-ically related sleep-wake traits (e.g. measures of fragmentation such as nb NREM and db Wake) might map to the same region, QTL for less directly related traits (e.g.# Arousals and NREM delta power, or wake min and REM latency) might not have been expected to map to the same loci as occurred in Q1@75 (LOD 2.5–4.5) and Q13@2 (LOD 2.5–5.1) (Table 2). These unexpected
genetic relationships raise the possibility that shared genetic regulatory mechanisms may underlie different sleep-wake traits that were not previously thought to be related.
It should be noted that two genomic regions, on chromosomes 7 and 13, were associated with high wake and the B6 genotype. As theSleeplessmutation has a high wake phenotype, these represent candidate regions for the mutation. In addition, the presence of theSleeplessmutation segregating in this N2population may have influenced the genetic effect of some of our identified QTL. Previous studies have shown that the presence of a mutation can reveal epistatic effects of other genes that may otherwise not be apparent [12]. Therefore some of the specific QTL presented here might be present because the locus representsSleeplessor because it is a region that interacts with Sleepless. However, analysis of epistatic interactions with these two regions failed to identify any significant interactions with the region on chromosome 13, and only one region of significant interaction with chromosome 7 (see Supporting Information Figure S2). Thus, it appears the presence ofSleeplesssegregating in the N2 population influenced the QTL results at most at two loci, if the Sleepless locus is not normally polymorphic between B6 and BALB.
Bayesian network analysis
In order to create a dynamic model that allows for the visualization of relationships among multiple sleep phenotypes and multiple sleep QTL in a context specific manner we used Bayesian analysis. Construction of a Bayesian network facilitated visualiza-tion of the strongest links between the sleep phenotypes and QTL and identification of sub-networks and patterns defined by those links that otherwise might not be seen [13,14]. While some links are obvious (e.g. a QTL causing decreased wake over 24 hrs can be expected to cause an increased amount of NREM over 24 hrs), the network revealed a number of less intuitive links. Using a stringent set of criteria by limiting the identification of nodes and edges (Supporting Information), Fig. 2 exposes a network of the strongest statistically defined interactions between different sleep-wake traits during the light, dark or full 24-hr period, as well as between these traits and the QTL identified in this cross. Trait by trait correlations (Supporting Information Table S4) and a less stringent Bayesian network (Supporting Information Fig. S1) are also provided. Incorporating this large amount of data into one cohesive network represents a novel model for understanding the complex behavior of sleep and the interactions of sleep-wake traits at the genetic and trait by trait levels.
Aside from power band and fragmentation factors, there was only one edge linking a light and dark node in Fig. 2, NREM min in the light with % REM/TS in the dark. This one clear edge led us to take a closer look at wake time in the light (or dark) phase with REM sleep time in the dark (or light phase). Such an analysis led to the surprising discovery that while there was no significant correlation between REM time within the light versus the dark
phases, there were significant correlations such that the amount of wake in the dark was connected with the amount of REM sleep in the light, while the amount of wake in the light was correlated with the amount of REM in the dark (Supporting Information Table S4). Such an unexpected relationship raises a number of new questions about the relationship of wake time to subsequent REM sleep and/or how REM sleep time effects subsequent wake time. Figure 1. 52 QTL for 20 sleep-wake traits.52 QTL shown by chromosome and cM positions that were identified for each of the sleep-wake traits listed in Table 1. The colored bands represent the position of the peak LOD score for each QTL and the fill of the bands denote the time period for the trait linkage as shown in the insert legend. Based on the factor analysis depicted in Table 1, the traits are grouped into 1 of 5 categories designated by the color of the bands as noted in the insert legend. The precise peak (in cM and Mb) and LOD score of the QTL, as well as the specific sleep-wake trait represented by each of the colored bands, are provided in Table 2. Further information on the size of the QTL are provided in Supporting Information Table S3.
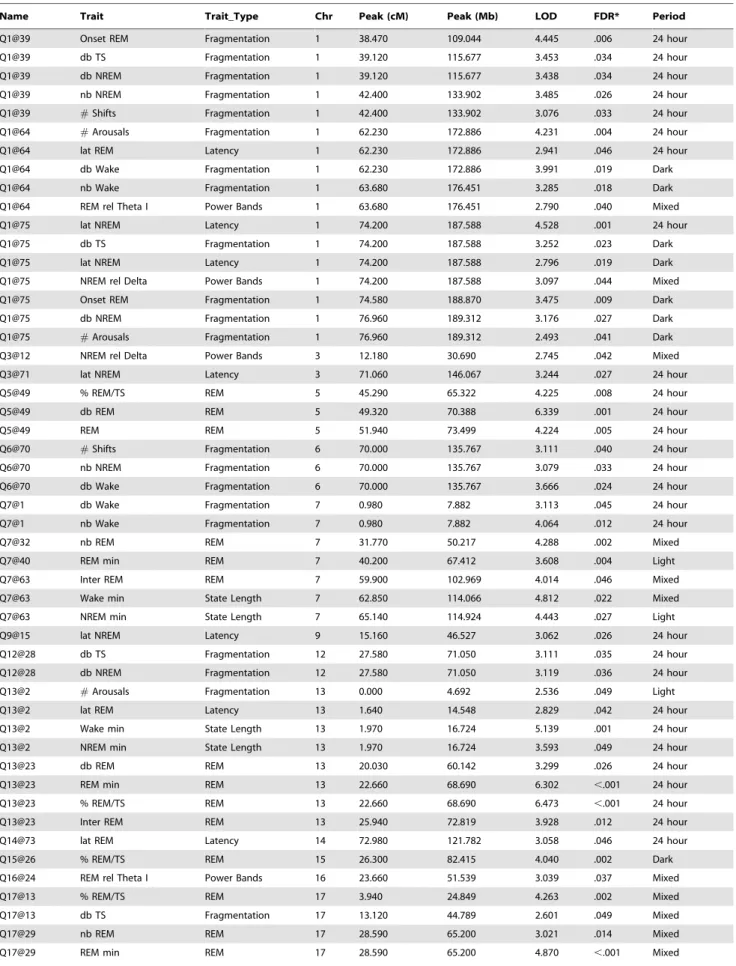
Table 2.Peak Location and LOD Score of Each QTL Depicted in Figure 1.
Name Trait Trait_Type Chr Peak (cM) Peak (Mb) LOD FDR* Period
Q1@39 Onset REM Fragmentation 1 38.470 109.044 4.445 .006 24 hour
Q1@39 db TS Fragmentation 1 39.120 115.677 3.453 .034 24 hour
Q1@39 db NREM Fragmentation 1 39.120 115.677 3.438 .034 24 hour
Q1@39 nb NREM Fragmentation 1 42.400 133.902 3.485 .026 24 hour
Q1@39 #Shifts Fragmentation 1 42.400 133.902 3.076 .033 24 hour
Q1@64 #Arousals Fragmentation 1 62.230 172.886 4.231 .004 24 hour
Q1@64 lat REM Latency 1 62.230 172.886 2.941 .046 24 hour
Q1@64 db Wake Fragmentation 1 62.230 172.886 3.991 .019 Dark
Q1@64 nb Wake Fragmentation 1 63.680 176.451 3.285 .018 Dark
Q1@64 REM rel Theta I Power Bands 1 63.680 176.451 2.790 .040 Mixed
Q1@75 lat NREM Latency 1 74.200 187.588 4.528 .001 24 hour
Q1@75 db TS Fragmentation 1 74.200 187.588 3.252 .023 Dark
Q1@75 lat NREM Latency 1 74.200 187.588 2.796 .019 Dark
Q1@75 NREM rel Delta Power Bands 1 74.200 187.588 3.097 .044 Mixed
Q1@75 Onset REM Fragmentation 1 74.580 188.870 3.475 .009 Dark
Q1@75 db NREM Fragmentation 1 76.960 189.312 3.176 .027 Dark
Q1@75 #Arousals Fragmentation 1 76.960 189.312 2.493 .041 Dark
Q3@12 NREM rel Delta Power Bands 3 12.180 30.690 2.745 .042 Mixed
Q3@71 lat NREM Latency 3 71.060 146.067 3.244 .027 24 hour
Q5@49 % REM/TS REM 5 45.290 65.322 4.225 .008 24 hour
Q5@49 db REM REM 5 49.320 70.388 6.339 .001 24 hour
Q5@49 REM REM 5 51.940 73.499 4.224 .005 24 hour
Q6@70 #Shifts Fragmentation 6 70.000 135.767 3.111 .040 24 hour
Q6@70 nb NREM Fragmentation 6 70.000 135.767 3.079 .033 24 hour
Q6@70 db Wake Fragmentation 6 70.000 135.767 3.666 .024 24 hour
Q7@1 db Wake Fragmentation 7 0.980 7.882 3.113 .045 24 hour
Q7@1 nb Wake Fragmentation 7 0.980 7.882 4.064 .012 24 hour
Q7@32 nb REM REM 7 31.770 50.217 4.288 .002 Mixed
Q7@40 REM min REM 7 40.200 67.412 3.608 .004 Light
Q7@63 Inter REM REM 7 59.900 102.969 4.014 .046 Mixed
Q7@63 Wake min State Length 7 62.850 114.066 4.812 .022 Mixed
Q7@63 NREM min State Length 7 65.140 114.924 4.443 .027 Light
Q9@15 lat NREM Latency 9 15.160 46.527 3.062 .026 24 hour
Q12@28 db TS Fragmentation 12 27.580 71.050 3.111 .035 24 hour
Q12@28 db NREM Fragmentation 12 27.580 71.050 3.119 .036 24 hour
Q13@2 #Arousals Fragmentation 13 0.000 4.692 2.536 .049 Light
Q13@2 lat REM Latency 13 1.640 14.548 2.829 .042 24 hour
Q13@2 Wake min State Length 13 1.970 16.724 5.139 .001 24 hour
Q13@2 NREM min State Length 13 1.970 16.724 3.593 .049 24 hour
Q13@23 db REM REM 13 20.030 60.142 3.299 .026 24 hour
Q13@23 REM min REM 13 22.660 68.690 6.302 ,.001 24 hour
Q13@23 % REM/TS REM 13 22.660 68.690 6.473 ,.001 24 hour
Q13@23 Inter REM REM 13 25.940 72.819 3.928 .012 24 hour
Q14@73 lat REM Latency 14 72.980 121.782 3.058 .046 24 hour
Q15@26 % REM/TS REM 15 26.300 82.415 4.040 .002 Dark
Q16@24 REM rel Theta I Power Bands 16 23.660 51.539 3.039 .037 Mixed
Q17@13 % REM/TS REM 17 3.940 24.849 4.263 .002 Mixed
Q17@13 db TS Fragmentation 17 13.120 44.789 2.601 .049 Mixed
Q17@29 nb REM REM 17 28.590 65.200 3.021 .014 Mixed
Name Trait Trait_Type Chr Peak (cM) Peak (Mb) LOD FDR* Period
Q17@29 Wake min State Length 17 30.230 65.622 7.562 ,.001 Mixed
Q17@29 NREM min State Length 17 30.230 65.622 5.954 .001 Dark
QTL were detected by R package QTL as were the peak LOD scores. The QTL peak was defined as the position within the QTL with the highest LOD score. Trait type was determined by factor analysis (Table 1). Chr = chromosome, LOD = logarithm of odds. FDR = False Discovery Rate (probability). See Supplementary Information for complete trait descriptions. See Supporting Information Table S3 for further information about each QTL.
*
To account for multiple testing using a non-parametric approach, FDR estimates were computed genome-wide within each sleep trait by permuting individual identifiers for the genotype data and repeating the analyses on 1000 replicate permuted data sets [25]. To eliminate the influence of markers in high linkage disequilibrium, chromosome-wide peak marker LOD scores were used for all FDR computations.
doi:10.1371/journal.pone.0005161.t002 Table 2.cont.
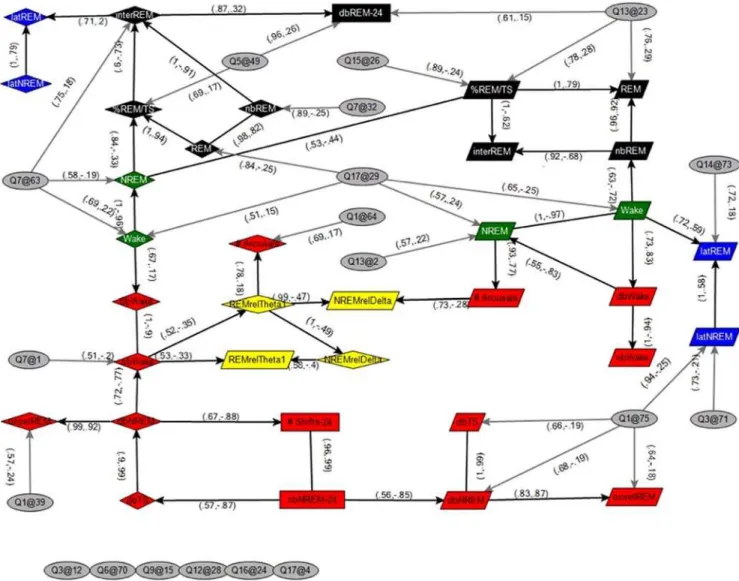
Figure 2. QTL and Sleep-wake Trait Network Analysis.Bayesian network of sleep traits and significant QTL. Sleep-wake traits with QTL that differed in effects between the light and dark periods were represented in the network as two distinct traits, measured in the light and dark periods, denoted by diamond shapes (and suffix ‘l’) and parallelograms (and suffix ‘d’), respectively. The remaining sleep traits were averaged over the light and dark periods, denoted by rectangles (and suffix ‘24’). QTL are represented by ellipses,,chromosome.@,centiMorgan.. Edge labels include the confidence, which is the proportion of 1500 Markov Chain Monte Carlo (MCMC) learned networks that included the edge, and the Pearson correlation between nodes, respectively. Node colors represent trait types described in text; green: wake, black: REM, red: fragmentation, yellow: power band and blue: latency to REM. Edges that were present in greater than 50 percent of the MCMC runs were included in the network. Details of Bayesian network construction can be found in Supporting Information.
Such relationships are particularly intriguing in view of the possible role of REM sleep on a variety of higher brain functions, including learning [17,18], memory [19], and mood [20,21], as well as the possible genetics underlying these relationships.
Materials and Methods
Animals and Housing
All experimental mice were housed and handled according to the Federal Animal Welfare guidelines and all studies were approved in advance by the Animal Care and Use Committee at Northwestern University. All animals were maintained continu-ously on a 14 hr light: 10 hr dark cycle (LD 14:10) from birth at a room temperature of 2362uC and were weaned at 4 weeks of age. Food and water were availablead libitum.
All animals used for genotype and phenotype (N = 269) analysis were N2 offspring from 26 male F1 mice that were themselves the progeny of female BALB/cByJ (BALB) from the Jackson Laboratory and 11 C57BL/6J (B6) male mice (G4–6 males) from a line of B6 mice maintained at Northwestern University. This line descended from a single first generation B6 male offspring of a male mouse treated with the chemical mutagen N-ethyl-N -nitrosourea. This line was maintained as a possible mutant line with an altered sleep-wake phenotype because it showed increased wake (820621 min) over 24 hours compared to wild-type B6 males (718649 min), and hence the line was calledSleepless. The high wake phenotype in this line segregates as a single locus autosomal dominant mutation, and has been maintained by backcrossing affected males to wild-type B6 females obtained from the Jackson Laboratory at each generation to eliminate other possible induced mutations segregating in the line. The 11 B6 males used in the first generation cross for this study were high wake males from the 4th–6th generation of Sleeplessanimals (and thus presumably,Sleeplessheterozygotes) which were then crossed to BALB females from Jackson Laboratories to produce 124 (BALB6B6*)F1 males. F1 males were screened and examined for sleep-wake phenotype, and 26 animals selected for high wake minutes as presumptiveSleeplessheterozygotes were backcrossed to wild-type B6 females from Jackson Laboratories to produce 269 [B66(BALB6B6*)F1]N2 males. Thus, in addition to a 50:50 chance of carrying the inducedSleeplessmutation, the 269 N2 mice each have a 50:50 probability of being either homozygous B6/B6 or heterozygous BALB/B6 at any genomic region. Therefore, in this cross of two inbred mouse strains, genetic polymorphisms can be used to map segregation of sleep-wake traits.
Sleep-wake recordings in adult mice
At 10 to 12 weeks of age, male mice were prepared for monitoring of EEG/EMG signals [22]. A minimum 10-day post-surgery recovery period was observed before sleep recording was initiated. Mice were acclimated to housing individually in cylindrical (25.5 cm diameter) sleep recording cages with free access to food and water for a minimum of five days during this time. EEG/EMG data were collected [22] for 48 continuous hours starting at light onset. With the use of a custom software package (SleepReport, Actimetrics, Evanston, IL), EEG and EMG recordings were divided into 10-second epochs and scored via visual inspection as either wake, NREM or REM. For a detailed account of sleep and EEG analysis see Supplemental Information.
Genotyping
All DNA samples were genotyped on the Affymetrix MegA-lleleTMgenotyping mouse 5 K SNP panel: (http://www.affyme-
trix.com/support/technical/datasheets/parallele_mouse5k_data-sheet.pdf). This panel consists of approximately 5,500 SNPs evenly distributed across the genome with approximately 2,310 of these SNPs being informative for the B6 and BALB inbred lines. DNA was prepared from mouse tail using the DNAeasy kit according to the manufacturer’s protocols (Qiagen). Tails were stored frozen until DNA preparation, and DNA was stored at220uC. DNA was quantified for quality control by fluorometry using PicoGreen (Invitrogen). It was shipped on dry ice and concentration adjusted per the manufacturer’s instructions prior to genotyping. Expected genotype probabilities were computed using the R package QTL R/qtl: QTL with Haldane’s map function [23]. Details on computing the expected genotype probabilities can be found in Supporting Information.
Network Analysis
A Bayesian network is a directed acyclic graph (DAG) which includes a collection of nodes and arcs connecting nodes [24]. The nodes represent random variables and the arcs represent condi-tional probabilistic dependency between nodes, where the distribu-tion of each node is dependent on its parent nodes but condidistribu-tionally independent of all other nodes. Thus, Bayesian networks are constructed to represent not only correlation but causality. That is, X is a parent of Y, or the presence of a directed path from node X to node Y implies X causes (controls) Y. Thus, the network structure allows one to distinguish between the simple correlation or clustering and the more interesting notion of directed or causal dependence. Details of the construction of the network presented here are found in the Supplemental Information.
Supporting Information
Text S1
Found at: doi:10.1371/journal.pone.0005161.s001 (0.05 MB DOC)
Figure S1 Expanded Bayesian Network
Found at: doi:10.1371/journal.pone.0005161.s002 (0.23 MB DOC)
Figure S2 Epistasis LOD Plot
Found at: doi:10.1371/journal.pone.0005161.s003 (0.04 MB DOC)
Table S1 Sleep-Wake Traits in Light and Dark Periods Found at: doi:10.1371/journal.pone.0005161.s004 (0.06 MB DOC)
Table S2 Bootstrap Obtained 95% Confidence Intervals of Factor Analysis
Found at: doi:10.1371/journal.pone.0005161.s005 (0.09 MB DOC)
Table S3 Expanded QTL Data
Found at: doi:10.1371/journal.pone.0005161.s006 (0.31 MB DOC)
Table S4 Correlation Tables
Found at: doi:10.1371/journal.pone.0005161.s007 (0.07 MB DOC)
Table S5 Bootstrap Results for Bayesian Network
Found at: doi:10.1371/journal.pone.0005161.s008 (0.03 MB DOC)
Acknowledgments
Author Contributions
Conceived and designed the experiments: CJW AK JM AL MHV JJR FWT. Performed the experiments: DLW KM JRO DPR. Analyzed the
data: CJW DLW AK JM AL HSY KM LZ JRO DPR FP KS MHV JJR FWT. Contributed reagents/materials/analysis tools: JM LZ EES KS MHV CZ. Wrote the paper: CJW DLW AK JM AL MHV FWT.
References
1. Carskadon MA, Dement WC (2005) Normal human sleep: an overview. In: Kryger MH, Roth T, Dement WC, eds (2005) Principles and Practice of Sleep Medicine. 4th ed. Philadelphia: Elsevier Saunders. pp 13–23.
2. McCarley RW (2007) Neurobiology of REM and NREM sleep. Sleep Med 8: 302–330.
3. O’Hara BF, Ding J, Bernat RL, Franken P (2007) Genomic and proteomic approaches towards an understanding of sleep. CNS Neurol Disord Drug Targets 6: 71–81.
4. Tafti M, Franken P (2002) Invited review: genetic dissection of sleep. J Appl Physiol 92: 1339–1347.
5. Franken P, Malafosse A, Tafti M (1998) Genetic variation in EEG activity during sleep in inbred mice. Am J Physiol 275: R1127–1137.
6. Franken P, Chollet D, Tafti M (2001) The homeostatic regulation of sleep need is under genetic control. J Neurosci 21: 2610–2621.
7. Toth LA, Williams RW (1999) A quantitative genetic analysis of slow-wave sleep and rapid-eye movement sleep in CXB recombinant inbred mice. Behav Genet 29: 329–337.
8. Tafti M, Petit B, Chollet D, Neidhart E, de Bilbao F, et al. (2003) Deficiency in short-chain fatty acid beta-oxidation affects theta oscillations during sleep. Nat Genet 34: 320–325.
9. Maret S, Franken P, Dauvilliers Y, Ghyselinck NB, Chambon P, et al. (2005) Retinoic acid signaling affects cortical synchrony during sleep. Science 310: 111–113.
10. Cureton EE, D’Agostino RB (1983) Factor analysis: an applied approach. HillsdaleNJ: Erlbaum.
11. Tucker AM, Dinges DF, Van Dongen HP (2007) Trait interindividual differences in the sleep physiology of healthy young adults. J Sleep Res 16: 170–180.
12. Kwong LN, Shedlovsky A, Biehl BS, Clipson L, Pasch CA, et al. (2007) Identification of Mom7, a novel modifier of Apc(Min/+) on mouse chromosome 18. Genetics 176: 1237–1244.
13. Zhu H, Shu H, Zhou J, Bao X, Luo L (2007) Bayesian algorithms for PET image reconstruction with mean curvature and Gauss curvature diffusion regulariza-tions. Comput Biol Med 37: 793–804.
14. Li Y (2006) Bayesian model based clustering analysis: application to a molecular dynamics trajectory of the HIV-1 integrase catalytic core. J Chem Inf Model 46: 1742–1750.
15. Huber R, Deboer T, Tobler I (1999) Prion protein: a role in sleep regulation? J Sleep Res 8 Suppl 1: 30–36.
16. Lee J, Kim D, Shin HS (2004) Lack of delta waves and sleep disturbances during non-rapid eye movement sleep in mice lacking alpha1G-subunit of T-type calcium channels. Proc Natl Acad Sci U S A 101: 18195–18199.
17. Stickgold R, Hobson JA, Fosse R, Fosse M (2001) Sleep, learning, and dreams: off-line memory reprocessing. Science 294: 1052–1057.
18. Smith CT, Nixon MR, Nader RS (2004) Posttraining increases in REM sleep intensity implicate REM sleep in memory processing and provide a biological marker of learning potential. Learn Mem 11: 714–719.
19. Graves L, Pack A, Abel T (2001) Sleep and memory: a molecular perspective. Trends Neurosci 24: 237–243.
20. Peterson MJ, Benca RM (2006) Sleep in mood disorders. Psychiatr Clin North Am 29: 1009–1032; abstract ix.
21. Benca RM (2005) Mood Disorders. In: Kryger MH, Roth T, Dement WC, eds (2005) Principles and Practice of Sleep Medicine. Philadelphia: Saunders. pp 1311–1326.
22. Laposky AD, Shelton J, Bass J, Dugovic C, Perrino N, Turek FW (2006) Altered sleep regulation in leptin-deficient mice. Am J Physiol Regul Integr Comp Physiol 29: R894–903.
23. Broman KW, Wu H, Sen S, Churchill GA (2003) R/qtl: QTL mapping in experimental crosses. Bioinformatics 19: 889–890.
24. Bottcher SG, Dethlefsen C (2003) deal: A package for learning Bayesian networks. Journal of Statistical Software 8: 1–40.