F
ACULDADE DEE
NGENHARIA DAU
NIVERSIDADE DOP
ORTOCustomized recommendation based on
the analysis of passengers’ mobility
profiles
Mike Pinto
Mestrado Integrado em Engenharia Informática e Computação Supervisor: Teresa Galvão Dias
c
Customized recommendation based on the analysis of
passengers’ mobility profiles
Mike Pinto
Mestrado Integrado em Engenharia Informática e Computação
Approved in oral examination by the committee:
Chair: Prof. Rosaldo José Fernandes RossettiExternal Examiner: Prof. João Paulo Pereira Supervisor: Prof. Teresa Galvão Dias
Abstract
The superior environmental and logistic impact of personal transportation means, instead of public transportation services, is undeniable. This is a matter of big concern, so there is a need to find new ways to attract users towards this kind of transportation.
Previous studies show that an effective method of promotion is giving users something to look forward to, in this case, a reward for their transportation choice. A promising rewarding process consists is establishing partnerships between transportation services and business services to reward users who opt for public transports with prize offers, i.e. vouchers.
With the purpose of rewarding users of public transportation services, this project consists on developing a recommender system. The system is capable of recommending business establish-ments and prize offers based on the user’s mobility and social profile, being the main objective of the project to build a reliable, recommendation ready system, that leaves room for evolution without a need for a full system design overhaul.
The Mobility Aware Recommender System (MARS) model, with a collaborative-filtering ap-proach, and previous projects, are used as starting point for this project. With the integration of social network services, we aim at creating more detailed and complex user profiles. This allows defining a base profile for each user, increasing the system’s efficiency right from the start, as it solves the cold start problem known to be the main problem for all collaborative-filtering systems. This solution shows a way to reward the three parties: transportation service entities have a new tool to attract new users, business services have a way of promoting their services to targeted users and passengers are rewarded by the system in a customized way.
Beyond the scope of this project are several other areas to explore. With social networks, the integration of achievement system with social sharing is one possibility together with the existence UI with a possible award/point system. Another extension to the system would be recommending other locations, for tourism, or events, like concerts or shows.
Resumo
O superior impacte ambiental e logístico de utilizar meios de transporte pessoais, em vez de transportes coletivos, é algo inegável. Desta forma é necessário procurar formas que dêem resposta a este problema tornando o serviço mais atrativo.
Projetos prévios demonstram que um método eficaz de promoção de algo é dar aos seus utilizadores algo por ansiar, uma recompensa pela sua preferência. Uma forma de recompensa promissora consiste em estabelecer parcerias entre as entidades de transporte e serviços comerci-ais públicos e com isto premiar os utilizadores que optam pelos transportes públicos com ofertas.
Na linha de recompensar os utilizadores de transportes com ofertas, este projecto baseia-se na implementação de um sistema de recomendação. O sistema é capaz de recomendar serviços comerciais de acordo com o perfil de preferências e mobilidade do utilizador. O objetivo do projeto é estabalecer um sistema funcional e flexível, preparado para evoluir sem necessidade de um completo redesenho do sistema.
O modelo de sistema de recomendação MARS (Mobility Aware Recommendation System) aliado a uma abordagem de collaborative-filtering, que usa a frequência de localizações de um utilizador para recomendações geoinformadas serve de base para o projeto. Com a integração de serviços de redes sociais, pretende-se desenvolver perfis de utilizadores e serviços comerciais mais complexos e específicos. Isto permite estabelecer um perfil de base, aumentando a eficiência do sistema logo à partida (sem cold start), um dos principais problemas de abordagens collaborative-filtering.
Com esta solução, temos um método de recompensar as três partes, as entidades de transportes aumentam o seu número de utilizadores, os serviços comerciais têm uma forma simples de dis-persão atendendo ao público alvo e por último os utilizadores dos transportes são recompensados pelo sistema, elaborado à sua medida.
Para além do âmbito deste projeto, ainda existem muitas áreas a explorar. Em redes sociais e implementação de uma UI, poderão alimentar um sistema de recompensa com pontos. Outra vertente é aumentar a recomendação para abranger destinos não comerciais, i.e. sugerir locais turísticos, cidades, viagens. Em último ponto, seria interessante conseguir expandir o sistema para integrar a recomendação de eventos. Todos este processos teriam recompensas associadas e incluir localmente recomendação de estabelecimentos comerciais.
Acknowledgments
This is most likely one of the hardest projects I’ve worked on. Not because of its difficulty, but mostly because of the mix of several personal challenges, poor discipline and lack of sense of responsibility, made this a very stressful and down spiraling experience. Yet, I’ve completed my work and have a lot of people to thank for that.
To Teresa Galvão and Marta Ferreira, I thank you for your patience and persistence with me, this was definitely a rare experience and your commitment alowed me to be here today, I’ve learned a lot in this time period and working with you has changed to some degree my opinion on the academic scene.
To my family, your support and comprehension has been essential, not understanding my working methods or my general working environment, you still did your best to motivate and lift me up on harder times. Only you know what you had to go through without really understanding why, yet you still persisted and here I am.
Last, but definitly not least, my friends. A life without friends is no life worth living, through the hard times you were the ones who allowed me to vent and cheered me up, when I felt lost you always put me back on track. Each with their on way, you fill my life with joy and I wouldn’t be the same without you.
All of you managed to turn a rather stressful experience for me in one of the most memorable moments of my life, and for that, no gratitude is enough.
“I support anyone’s right to be who they want to be. My question is: to what extent do I have to participate in your self-image?”
Contents
1 Introduction 1
1.1 Context . . . 1
1.2 Motivation and goals . . . 1
1.3 Dissertation’s structure . . . 2
2 Related Work 5 2.1 Smart Ticketing in Public Transportation . . . 5
2.1.1 Metropolitan Area of Porto . . . 6
2.2 Social Network Services . . . 6
2.2.1 Facebook . . . 6
2.2.2 Foursquare . . . 7
2.3 Recommender Systems . . . 7
2.3.1 Core Concepts . . . 7
2.3.2 Recommendation Approaches . . . 8
3 Mobility Data Analysis 11 3.1 Metropolitan Area of Porto Overview . . . 11
3.1.1 Andante . . . 11
3.2 Available Data Sets . . . 13
3.2.1 Validation Entries . . . 16
3.2.2 Stops . . . 18
3.2.3 Local Business Services as Points of Interest . . . 19
3.3 Data Analysis . . . 22
3.3.1 Socio-economical description . . . 22
3.3.2 Profiles . . . 22
3.3.3 Zones and Stops . . . 26
3.3.4 Mobility Profile . . . 38
3.4 Point of Interest Analysis . . . 40
3.4.1 POIs in Zone C1 and near ‘Trindade’ . . . 43
3.4.2 Points of Interest targeted to Mobility Profiles . . . 47
4 Analytic and Recommender System 49 4.1 System Pipeline and Technologies . . . 49
4.1.1 Recommendation Process . . . 49
4.1.2 Technologies . . . 50
4.2 Recommendation Analisys . . . 51
4.2.1 User Observations . . . 51
CONTENTS
5 Conclusions and Future Work 55
5.1 Future Work . . . 55
5.1.1 Mobility Data . . . 55
5.1.2 Social Networks . . . 56
5.1.3 Recommendation Engine . . . 56
A Point of Interest Analysis 57 A.1 Mapping Point of Interest Categories . . . 57
References 61
List of Figures
2.1 The long tail phenomenon [Lon]. . . 8
3.1 Division in travel zones of the MAP network. [Andb] . . . 13
3.2 UML data representation scheme. . . 14
3.3 Analysis workflow diagram. . . 15
3.4 Amount of FVs per month for the year of 2013. . . 18
3.5 Area scanned for POIs with the Google Places API. . . 21
3.6 Amount of FVs per week for the year of 2013. . . 24
3.7 Subscription card profiles for October, 2013. . . 25
3.8 Subscription card and validation values for each MAP zone for October, 2013. . . 29
3.9 All stops in the Metropolitan Area of Porto. . . 30
3.10 Subscription card and validation values for the top 10 stops from all zones for October, 2013. . . 32
3.11 Subscription zone C1 card and validation values per profile for October, 2013. . . 34
3.12 Visual mobility profile representation example of a card. . . 40
3.13 Heatmap of the POIs in our analysis section of the MAP. . . 41
3.14 Category distribution of the POIs in our analysis section of the MAP. . . 42
3.15 Heatmap of the POI distribution on zone C1. . . 43
3.16 Category distribution of the POIs in zone C1. . . 44
3.17 Heatmap of the POI distribution near ‘Trindade’. . . 45
3.18 POI distribution by geodistant range from 100 to 600 meters near ‘Trindade’. . . 46
3.19 Category distribution of the POIs near ‘Trindade’. . . 47
3.20 Example Mobility Profile matched number of POIs by category. . . 48
LIST OF FIGURES
List of Tables
2.1 Utility Matrix Example . . . 8
2.2 Content-based recommendation user and item profiling. . . 9
3.1 Andante occasional trip title pricing in euros. . . 12
3.2 Andante monthly subscription prices in euros. . . 12
3.3 Andante special tour trip title prices in euros. . . 13
3.4 Data schema for an entry on the 2013 AFC database - a validation. . . 16
3.5 Data schema for a travel card with all it’s aggregated validations. . . 16
3.6 Basic statistics for the whole 2013 AFC data set. . . 17
3.7 Amount of FVs per month for the year of 2013. . . 17
3.8 First source for stops’ data schema. . . 18
3.9 Second source for stops’ data schema. . . 19
3.10 Points coordinates that define the scan area. . . 20
3.11 Place object schema. . . 21
3.12 Social aid ranks A and B eligibility formulas and values. . . 22
3.13 Social aid monthly student subscriptions profile and rank discounts. . . 23
3.14 Social aid monthly subscriptions. . . 23
3.15 Regular monthly subscriptions. . . 23
3.16 Validation numbers for weeks 40 to 44 of the year 2013. . . 24
3.17 Group cards and validations comparison for October, 2013. . . 25
3.18 Subscription card profiles for October, 2013. . . 26
3.19 Overall card and validation values for each MAP zone for October, 2013. . . 27
3.20 Subscription card and validation values for each MAP zone for October, 2013. . . 28
3.21 Overall card and validation values for the top 10 stops from all zones for October, 2013. . . 31
3.22 Subscription card and validation values for the top 10 stops from all zones for October, 2013. . . 31
3.23 Group card and validation values comparison for zone C1 for October, 2013. . . 32
3.24 Subscription zone C1 card and validation values per profile for October, 2013. . . 33
3.25 Top 5 overall stops for the C1 zone for October, 2013. . . 34
3.26 Top 5 stops for subscription card values in the C1 zone for October, 2013. . . 35
3.27 Trindade subscription card profiles for October, 2013 . . . 36
3.28 Subsample of cards with 88 validations containing ‘Trindade’ for October, 2013. 38 3.29 Mobility profile representation example of a card. . . 39
3.30 High level categories segmenting POIs. . . 42
3.31 Category distribution of the POIs in zone C1. . . 44
3.32 POI per category near Trindade for a geodistance ranging from 100 to 600 meters. 46 3.33 Example Mobility Profile matched number of POIs by category. . . 48
LIST OF TABLES
4.1 Negative ratings in POIs per category for the example card. . . 52
4.2 Positive ratings in POIs per category for the example card. . . 52
4.3 Recommended POIs per category for the example card. . . 52
A.1 POI categorization map. . . 57
A.1 POI categorization map. . . 58
A.1 POI categorization map. . . 59
A.1 POI categorization map. . . 60
Abbreviations
API Application Programming Interface B2C Business to Consumer
CP Card Profile
CRM Customer Relationship Management FV Fare Validation
IoT Internet of Things
MAP Metropolitan Area of Porto POI Point of Interest
PTO Public Transport Operator SNS Social Network Service VPC Validations Per Card
Chapter 1
Introduction
In this chapter we present an overview of this dissertation. Starting with the work’s context, we describe what serves as foundation to this project, what it involves and what we intend to achieve. Lastly, we lay out this report’s structure.
1.1
Context
Today we have the front seat to the show that is the evolution of the Internet of things (IoT), which has rapidly interconnected several technologies and services in a huge infrastructural scheme. The public transportation services are no exception to this event and because of it a huge amount of data of its users everyday usage is generated . This growth of IoT is only natural and expected, the insights provided by the collected information allow service providers to customize their business to their user base and better it’s business-to-consumer (B2C) relationship.
Public Transport Operators (PTOs) are to keep up with this trend and look for ways to improve their customer relationship management (CRM). Without having to step away from their core business strategy, the opportunity is here, to grab their user base usage information and convert it into an extra service.
The importance of public transportation services in reducing our carbon footprint and improv-ing traffic in major cities with complex networks, only adds to the cause that we need to provide a more attractive service, which will bring more people to opt for a mass transit solution other than their personal vehicle.
Our spectrum stays within our country, Portugal, and our district of Porto, using the Metropoli-tan Area of Porto (MAP) as our public transport network for analysis.
1.2
Motivation and goals
Our work focuses on exploring the data on user activity on the MAP network to find ways to create new services and benefit users.
Introduction
With a provided data set of a year’s worth of user fares, stops and stations, combined with the majority of points-of-interest in the MAP, we look to analyze which are the most popular areas, what services are present, age range distribution and a few more variations of these statistics. This will hopefully provide some insight as to if there is any kind of correlation between a passenger’s age, the area visited and services existent in the area.
Combine all this information and we should have a starting point to implement a recommender system. Basing our starting information in the passenger’s mobility profile, a collection of all the fare validation geolocations within the year, we have a filter to which services are within reach to the passenger. If we bring social network services, like Facebook, into this mix, we get a potential source of the user’s preferences that set the basis of the passenger’s, now a user within the system, recommendation profile.
Expanding passenger’s mobility information with the services available to him at a given time, refined with a customized recommendation engine, provides each passenger a new experience regarding the usage of public transportation. What was once public and standard now becomes personal, a new door for the new or old returning passengers to adhere the service.
All of this work complements previous research and ideas that aim to make the service more desirable, such has the usage of mobile ticketing services, an IoT strong entry point, associated with in-app vouchering with or without an associated gamification system. It also uses an alterna-tive approach towards recommendation than a previous project, which could possibly be combined with it to form a hybrid recommendation method.
1.3
Dissertation’s structure
In this dissertation we start off by showing what constitutes the MAP transportation network, which PTOs service this area, the ticketing system and how is the information generated so as it’s source. We finish this chapter with overview of the data schema and how it relates with other data sets.
Next, we present our approach towards retrieving the information regarding business services in the area. The reason to use source A rather than B, what are the benefits and implications of each choice. Ending the chapter with the overview of the data set: number of services, types and schema.
Social network services are addressed next, with an overview of how they can benefit from whole infrastructure of public transportation to the recommendation engine. Then we narrow down the scope to the service analyzed, Facebook, and explain it’s choice disregarding others, what it provides to the project and what more could be explored with it while highlighting Facebook’s policies with permission requests. This chapter ends with a schema overview of the info provided. Exploratory data analysis follows with the in-depth correlation of all the data, with all the statistics already mentioned that we were able to address.
Introduction
The chapter that follows is about the recommendation system research. We go through the recommendation approaches and algorithms available, explain our choice for this project, how our data set is handled and what was the outcome.
Finally, we conclude this dissertation with a macro view of the work and what it can lead to, listing the next steps to take it further and build it into a full-fledged, sustainable recommendation system that can be used in real world activity.
Introduction
Chapter 2
Related Work
In this chapter we go over the knowledge basis of our work. We demonstrate the importance of Public Transportation, which are the concerns to its use and the possible ways to improve it, ending with the scope narrowing to our study example. On the following topic, we present social networks as services and show their relevance in these systems. Recommender systems follow, with an overview of the types of systems available, analyzing each system’s pros and cons.
2.1
Smart Ticketing in Public Transportation
Public Transportation is a service of high relevance to a sustainable, functional society. Yet, to-day it still doesn’t receive the necessary adhesion from the general public, which opt for a personal transport mean, having several consequences such as pollution and traffic congestion. [LCG15] shows that the amount of trips in the Metropolitan Area of Porto (MAP) has been decreasing. This leaves Public Transport Operators (PTO) with less and less resources to invest to improve the sec-tor, so new ways of attracting people need to be explored. Several studies have been made towards this matter and have settled in consumer oriented strategies [BS06].
[PTM11] studies how data mining transit smart cards can identify potential commercial part-ners, offering its users benefits/advantages for using public transportation, with minimal invest-ment (aside from the smart transit card system) as data should be automatically collected. Sim-ilarly, [FCD+] explores the same concept in the MAP network and makes solid observations on business establishment locations near bus stops and metro stations with restaurants, shops, com-panies, hotels and touristic places clustering near them. It’s also noted that a higher amount of a station’s/stop’s passenger affluence correlate to a higher service concentration in the area.
With a different strategy, [FNDC14] proposes the implementation of a mobile ticketing solu-tion, catching the fast evolution of technology and Internet of Things (IoT) and the ease of access to smart mobile devices from customers to improve customer access and relationship with the service. Following the trend and extending the work, [San14] implements a mobile client-server system that makes use of deals between PTOs and business entities to reward users via a voucher-ing strategy.
Related Work
Finally, [LCG15] relying on these concepts and studies, gives another step forward and builds a content-based recommendation system. Using traveler’s mobility profiles, he traces a passen-gers route and determines its most frequent locations. Combining that with user preferences with resulting business service ratings, recommendations are made.
Considering all the information shown, [FNDC14] holistic view seems achievable.
2.1.1 Metropolitan Area of Porto
Our work maintains the same illustrative example as previous work and it is the Metropolitan Area of Porto. Covering an area of 1.575 km2and serving about 1.75 million of inhabitants, the Metropolitan Area of Porto is composed by is composed by 126 buses lines (urban and regional), 6 metro lines, 1 cable line, and 3 train lines, according to [FCD+]. It makes use of an entry-only Automated Fare Collection ticketing system, materialized in a contact-less smart travel card, called Andante, to be used in this distance-based fare structure. More about the Andante system will be explained and explained further ahead in this document.
2.2
Social Network Services
Social network services (SNS) are very appealing when trying to get user information without direct input from the user himself. Being widely used, with a simple access trough an SNS’s Ap-plication Programming Interface (API), with the user’s permission, they can provide nice starting point information if we look to profile users.
Bringing SNS to our scope, we realize that not all SNS platforms are interesting, namely only Facebook and Foursquare at the time showed promise.
Facebook is a social media platform used with 1.23 thousand of million daily active users on average [FBS], being an all media share medium, while Foursquare’s target is the rating of business services, such as coffee shops, restaurants and many more. They both have a user relationship system, on which users can have friends and are recommended based on their profile.
2.2.1 Facebook
Facebook being the attractive source of information that it is, has been used widely for social studies and integration in all kinds of platforms as a quick registration method and data extraction. [ZK12] studies the Facebook-Trust model and how it influences relationships between com-panies and consumers. [Urb11] studies and explores Facebook as a marketing channel and his findings show that companies are eager to invest more in this marketing mean. [MF14] has an analysis of how social networks like Facebook make use of recommender systems to provide and tailor information to their users. [Rie13] built a general-purpose data extraction tool as a built-in Facebook app to provide ease-of-access towards Facebook’s API for general users abstracting the technical hassle. A important remark is made, not all the data available to a user is accessible through Facebook’s API, as the API is upgraded more data seems to be safeguarded from the API.
Related Work
2.2.2 Foursquare
Foursquare is location-based social network that allows users to discover new places and busi-ness establishments based on their history and preferences. A ‘check-in’ method is used with geolocation, which triggers and user interaction to rate the current place. Foursquare seems to be a good source for analysis with its model that enables users to act as a community and make interesting places and business services gain relevance and emerge from all the competition.
[LCW+11] studies and explores the reasons for Foursquare’s popularity, how it’s a socially driven platform and it’s privacy concerns. [BZWM15] surveys the state of location-based social networks to understand users’ preferences and behaviors. Similarly to [LCW+11], they make reference to Foursquare’s user engagement model consisting of awards points and badges for checking-in and inviting friends to the service.
2.3
Recommender Systems
Nowadays the rate at which information is consumed by people is extremely slower than the rate at which it is produced. This makes decision support systems become increasingly important for a person to reach their desired information [Ul 13, Qin13].
Recommender Systems are widely present in most e-commerce and content driven platforms. Amazon [LSY03], Netflix [GUH15], Spotify, Youtube are a few examples of widely used online platforms that use some form of recommender system to target information towards its users.
2.3.1 Core Concepts
Before we go into recommendation strategies, we have to understand a few concepts such as "long-tail" and utility matrix. These are two concepts that constitute the base logic for all recommendation systems, one justifying the need for them and the other showing how the system relates user-item information.
2.3.1.1 The Long Tail
The long tail phenomenon relates to the necessity of recommender system usage when pre-senting items in an online environment versus a physical location [LAU11], i.e. a bookstore.
In a physical location, the amount of items available is limited and recommendation can be fairly simple given it uses a small subset, predefined by a chosen evaluation method like a year’s sales report. While in an online platform that can hold virtually unlimited items, recommendation can be made much more at a micro level, closer to the user, represented in figure 2.1).
Related Work
Figure 2.1: The long tail phenomenon [Lon].
2.3.1.2 Utility Matrix
Recommender systems have two main component classes has data input, those are users and items. Users profiles contain information on preferences towards the items and this data is repre-sented in a matrix, specifically, an utility matrix. Looking at the table 2.1 we are prerepre-sented with ratings of users A, B and C of the items 1, 2 and 3 in a 1-5 scale. Notice that some positions have a ’ /0’ symbol, this means there’s no rating from the user for that item and it’s the recommender system’s task to try and predict that value [LAU11]. An item is recommended when the predicted value reaches a defined ’recommendation valid’ value, i.e. with a recommendation reference value of 3, if the score is inferior, it probably won’t be recommended.
Item 1 Item 2 Item 3
User A 4 1 3
User B /0 5 1
User C 2 /0 4
Table 2.1: Utility Matrix Example
2.3.2 Recommendation Approaches
Recommendation systems generally follow a rule of thumb, given a set of user profiles and items, apply a recommendation strategy to the sets and generate suggestions [MS10, Ul 13, Qin13]. A recommender system can broadly fit two main groups, content-based and collaborative filtering
Related Work
systems, yet there are other approaches that combine methods from both groups and enhance the system in a hybrid approach [LAU11]. A sum-up of each category would be as such [AT05]:
• Content-based recommendations: Past user choices influence present recommendations; • Collaborative recommendations: Recommendations are based on other users with a similar
profile;
• Hybrid recommendations: A combination of the previous two. 2.3.2.1 Content-based Filtering
Content-based filtering (CBF) is the most popular method on research and usage [BGLB16]. This method is used with a textual description of the items, using tags/keywords. With the right strategy, even though textual items are optimal (news articles, documents, etc) due to their nature, any item can be supported trough metadata analysis and/or manual tagging. A very common measure to keyword/tag retrieval from items is the term frequency/inverse document frequency (TF-IDF)method, a statistical method which retrieves the most relevant terms in a document by comparing a terms frequency against the spread in the document [AT05, BGLB16].
Cat AA Cat AB Cat AC ... Cat ZZ
User 1 1 0 ... 0
Item 0 1 1 .. 1
Table 2.2: Content-based recommendation user and item profiling.
In this approach users and items share properties, as in an item belongs to a set of categories and the user profile is constituted by a binary category preference, see table 2.2.
Content-based filtering has a few limitations [AT05, Ul 13]:
• Items need to have a textual reference so they can be classified by an autonomous system; • Items represented by the same set of features can’t be distinguished;
• Users need a well populated preference profile for recommendations; • New users have no ratings and need an integration method.
2.3.2.2 Context-based Filtering
Most common recommender systems don’t consider other factors besides users and items when recommending. Some contextual information, when available, helps recommendation effi-ciency [Ul 13].
[LCG15] incorporates this approach in their solution, culminating in a Mobility Aware Rec-ommendation System (MARS). In this work, they use user location frequency and air distance to trim recommendation results to items closer to the user.
Related Work
2.3.2.3 Hybrid Filtering
Hybrid approaches come into consideration for a system as a way to solve problems and lim-itations a single approach would have (i.e. cold-start), looking to combine collaborative with content-based filtering to target such problems [Ul 13].
Weighted Both collaborative and content-based methods compute a rating score, having a linear formula as deciding factor for an item’s score. System testing and weight adjustment are necessary [Ul 13].
Switching Same principle as the Weighted hybrid approach, but the content-based score is given priority with a given confidence index. If the confidence index is below requirement, a collabora-tive scoring is attempted. Complexity in establishing the confidence evaluation method is the core point, as it defines the switching criteria [Ul 13].
Feature Augmentation Collaborative information augments items information and enriches the content-based recommendation process, reducing the system’s sensitivity towards user ratings on an item [Ul 13, BGLB16].
Chapter 3
Mobility Data Analysis
In this work, we used the public transport network of the Metropolitan Area of Porto (MAP) as our study object.
3.1
Metropolitan Area of Porto Overview
In order to properly analyze the data presented by the Andante Automated Fare Collection system, we must understand how the system works at a macro level. With it being a fairly complex system, a context overview sets up the following data analysis.
3.1.1 Andante
In MAP, a smart travel card titled ’Andante’ serves as the transit validation medium which can hold several trip titles. The ticketing system consists in the division of the MAP network in areas. The Metropolitan Area of Porto is divided in several travel zones (see figure 3.1) and the ticket fare amount varies with amount of zones crossed. Generally, for each journey, a passenger purchases the respective trip title that allows the crossing of N zones, i.e. if we were to cross 3 zones, we would buy a ’Z3’ trip title and be able to travel up to any 3 zones distance from our starting zone, in any direction during the available trip time. This only applies to occasional titles, for subscriptions the travel zones are predefined at purchase making the title only valid for the specified zones. All these titles range from Z2 to Z12 [Andc]. The trip fares vary with the trip title, type, passenger and social help benefits, as presented by tables 3.1, 3.2 and 3.3 [Andd]. The letters on each subscription type refer to the social aid subsidy level, related to the passenger’s social-economical status.
The Andante comes in two forms, a paper card or a PVC card. The first costs significantly less (0.60e), smaller expiration date and can hold occasional trip titles and ‘24h Travel’ titles. The PVC version costs ten times more (6e) but has five times the validity duration, can hold all the previous type titles and monthly subscriptions and is more durable [Anda, Andd]. Special subscription cards, such as 4_18 and Sub23, are PVC cards that cost 3e.
Mobility Data Analysis
Title Ocasional Max duration 24h
Z2 1.20 1h 00m 4.15 Z3 1.55 1h 00m 5.35 Z4 1.95 1h 15m 6.75 Z5 2.35 1h 30m 8.10 Z6 2.75 1h 45m 9.50 Z7 3.15 2h 00m 10.85 Z8 3.55 2h 15m 12.25 Z9 3.95 2h 30m 13.65 Z10 4.35 2h 45m 14.85 Z11 4.75 3h 00m 16.05 Z12 5.15 3h 15m 17.25 Table 3.1: Andante occasional trip title pricing in euros.
Title Regular Social* / Sub23(F) 4_18(B) / 4_18(F) (25% Disc.) Social+ (A) (50% Disc.) 4_18 (A) Sub23 (A) (60% Disc.) Z2 30.30 22.75 15.15 12.10 Z3 37.00 27.75 18.50 14.80 Z4 47.10 35.35 23.55 18.85 Z5 57.60 43.20 28.80 23.05 Z6 66.90 50.20 33.45 26.75 Z7 76.15 57.10 38.10 30.45 Z8 85.40 64.05 42.70 34.15 Z9 94.65 71.00 47.35 37.85 Z10 103.90 77.95 51.95 41.55 Z11 113.15 84.85 56.60 45.25 Z12 122.40 91.80 61.20 48.95
* Júnior / Estudante / Sénior / RP / Social+ RP / Social+ F / Social+ D Table 3.2: Andante monthly subscription prices in euros.
Mobility Data Analysis
Title Cost Andate Tour 1 7.00 Andate Tour 2 15.00
Table 3.3: Andante special tour trip title prices in euros.
Figure 3.1: Division in travel zones of the MAP network. [Andb]
3.2
Available Data Sets
There are several transport operators, with the main being STCP, for buses, and Metro do Porto, for metro, and will be our main focus when handling fare validations (FVs), validations for simplicity, since our FV data consists of entries only from these two operators.
Our data comes from two databases provided by Transportes Intermodais do Porto. The first contains the AFC entry data of FVs for the whole year of 2013, accounting for more than 135 million entry records, while the second one has all the stops and metro stations’ locations.
Mobility Data Analysis
The UML scheme on figure 3.2 provides the necessary information to how all the data corre-lates and gives a better understanding of our working data structure. Throughout this section we present and described the original data formats and how we reached this data structure.
Figure 3.2: UML data representation scheme.
Mobility Data Analysis
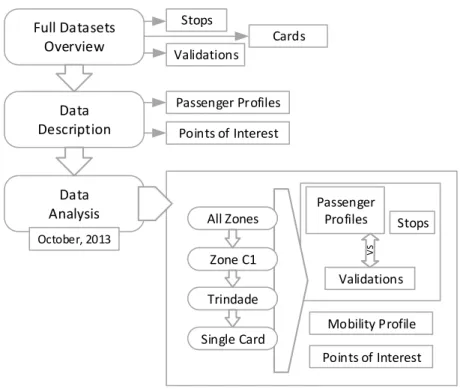
For a better readability and understanding of our analysis work that comes next, in figure 3.3 we present a workflow diagram of the analysis order.
Full Datasets Overview Data Description Validations Stops Points of Interest Passenger Profiles Data Analysis October, 2013 All Zones Zone C1 Trindade Single Card Cards Validations Passenger Profiles Stops Points of Interest Mobility Profile
Mobility Data Analysis
3.2.1 Validation Entries
This data set comprises exactly 133,979,203 records relative to the year of 2013. Each entry provides information, which its fields vary from bus to metro, take a look at the schema table 3.4.
Field Bus Metro Description
Card id Id of the travel card
Profile type User profile the card belongs to Profile id Id of the user profile
Group type Signature group the card belongs to Group id Id of the signature group
Line code Bus route the vehicle was following Stop code Stop’s identification code
Way Which way of route the vehicle is performing Vehicle id Id of the vehicle
Operator Operator of the vehicle
Trip starting time Time of the vehicle’s arrival at the stop Validation time Time of validation
Zone Zone in which the stop is located
Zones Zones the trip title allows to travel between Table 3.4: Data schema for an entry on the 2013 AFC database - a validation.
This information was later aggregated into card data, meaning every validation was grouped with the associated card id, forming the basis for a mobility profile. A representation of the schema for a resulting card id aggregation is represented on table 3.5
Field Description
Card id Id of the travel card
Validation count Amount of validation associated with this card Validation array Collection of all validations associated with this card
Table 3.5: Data schema for a travel card with all it’s aggregated validations.
We can already make some observations on the data with some simple statistics represented on table 3.6. Looking at these numbers, 44 validations across 12 months seems rather unsatisfying. If we actually put some thought to it and dig deeper, by applying a time constraint and checking how this cross references with tourism seasons there could be correlations, since occasional titles are the biggest part of the data set and more than 87% of the cards on the dataset have less than 45 FVs.
Mobility Data Analysis
Statistic Value %
Number of distinct cards in the set 3.017.357 100,0 Average validations per card 45 -Cards below average 2.632.006 87,23 Cards above average 385.351 12,77 Maximum amount of validations in a card 17.078 -Minimum amount of validations in a card 1 -Table 3.6: Basic statistics for the whole 2013 AFC data set.
From table 3.7 and figure 3.4, we retrieve the amount of validations per month. The months with most FVs are May and October with more than 13 million FVs, while August is the month with least amount of FVs at 8.4 million.
Month Number of Validations January 11.733.061 February 10.524.615 March 10.922.380 April 11.532.660 May 13.107.290 June 10.796.064 July 11.193.705 August 8.389.022 September 11.518.287 October 13.092.119 November 11.231.528 December 9.938.472 Total 133,979,203
Mobility Data Analysis 0 2000000 4000000 6000000 8000000 10000000 12000000 14000000 N u m b er of v alida tions Month Validations per month in 2013
Figure 3.4: Amount of FVs per month for the year of 2013.
3.2.2 Stops
This data set is actually split into two, but together they account for 3.959 total stops. The issue with them being split is inconsistent data between them, since the data isn’t standardized with the same fields. So we did just that, we tried to standardize the data, resulting in a 1059 common stops between sets.
Field Description
Stop Id Integer - stop identifier Stop Code String - stop identifier
External Stop Code String - stop identifier, external reference Stop Name String - full stop name
Short Stop Name String - short version of the stop’s name Provider Integer - operator associated with the stop Latitude Real - location: latitude coordinate Longitude Real - location: longitude coordinate Status Flag Boolean - activity status of the stop
Table 3.8: First source for stops’ data schema.
Mobility Data Analysis
Field Description
Stop Id Integer - stop identifier Stop Code String - stop identifier Stop Designation String - stop’s name
Operator String - operator associated with the stop UTM x Integer - UTM x coordinate
UTM y Integer - UTM y coordinate Zone String - zone this stops belongs to
Table 3.9: Second source for stops’ data schema.
We need this to have a reliable match when trying to identify to which stop a validation belongs to - a process that failed to match a lot of validations as we will see further ahead in this report. Tables 3.8 and 3.9 help understand the divergence between sources.
To match these sources we have to be careful, since we don’t have a reliable map between the two, since they are different we can’t assume the ’Stop Id’s are a match. The fields ’Provider’ and ’Operator’ seem to refer to the same thing, yet with no mapping we can’t make the assumption. Our best bet is to convert the Universal Transverse Mercator (UTM) coordinates of the second source to latitude and longitude coordinates and try for a match, with a small error margin tolerance defined of values being clamped with a 6 decimal place limit. This generated 1059 matches, so those were the ones used reliably when fetching passengers’ validations’ locations, with a standardized union schema between sources. Curiously, in this set of stops, STCP and Metro do Porto are the only operators.
The remaining ones, 1983 stops, are still useful when we analyze business service distribution. The final full set of stops is composed of precisely 3042 stops with the table 3.8 as the standard schema.
3.2.3 Local Business Services as Points of Interest
There were a few options available that could provide information about the existent business services in the Metropolitan Area of Porto.
At first we had an official database provided by Porto Digital, accounting for a total of 2.892 business services. Since our original plan to integrate content ratings in our recommender system, we brought Foursquare into the equation and using their API we complemented the information from the database. In this process we noticed that a lot of references where not actually businesses, but people, other were out of business. This made us look for an alternative source of information. So we opted for a more up-to-date alternative, the Google API, specifically, the Google Places API.
Mobility Data Analysis
3.2.3.1 Google API and Retrieval Strategy
An interesting feature for the Google Places API is how they label each establishment. An ob-vious label is the category but the other one is ’Point of Interest (POI)’ locations, which constitute places of most attraction and popularity given by their analytic studies, as found on their API doc-umentation.This is a big helping factor for us, as it filters all possible places to the interesting ones for our system. We will be referring to local business services as POIs from this point forward.
Google’s Places API has a method that scans an area given a center point and range, but it’s limited (in fact, all methods are) to 20 results at a time with an absolute maximum of 60 results with chained requests. Chained requests would take too much time and even so, we couldn’t just set the center point as the center of the MAP and retrieve the entirety of POIs since the maximum request result is 60 (always the same sixty for a given point), so we stood with 20 results for each scan.
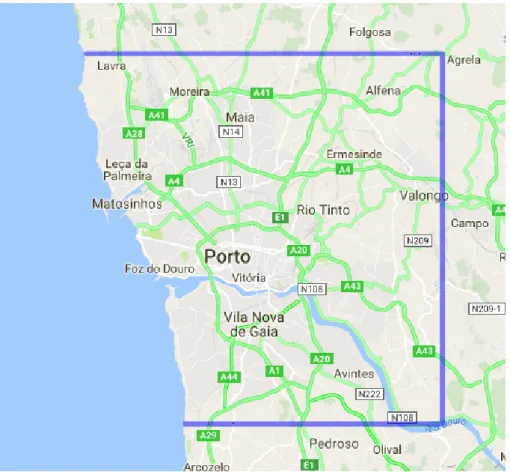
But how would we scan a vast area to get the most amount of POIs? Looking at figure 3.5, we’ve manually estimated an area (see table 3.10) with an approximate 400 km2, that while it doesn’t cover the whole MAP, it does cover the city zones and has a bigger concentration of POIs. Our next step was to split this area in to a matrix with each cell having a 75 meter side, resulting in 69.696 scan areas.
After this step, for each cell we’ve calculated it’s center point and, using this and a 75 meter range, performed a POI scan. Filtering any duplicated result at each cell scan, this resulted in 46.373 POIs retrieved. Compared to the other alternatives previously explored, this is a very satisfying result.
Point Latitude Longitude Top left 41.259867 -8.723711 Top right 41.259867 -8.486110 Bottom right 41.073896 -8.486110 Bottom left 41.073896 -8.723711 Center 41.166943 -8.604910
Table 3.10: Points coordinates that define the scan area.
Mobility Data Analysis
Figure 3.5: Area scanned for POIs with the Google Places API.
3.2.3.2 Place Object
Field Description
Vicinity A simplified address for the place Types An array of types for this place
Reference Token Token that can be used to query the Details service in future Name The place’s name
Place Id Textual identifier that uniquely identifies a place
Id Unique identifier denoting this place, for data consolidation
Icon URL to an image resource that can be used to represent this place’s type Geometry The place’s geometry-related information, including location and viewport
Table 3.11: Place object schema.
Google has a standardized information about each collected POI and the object structure is presented on table 3.11, as it is found on Google’s Place API documentation. Each POI in the scanned area can belong to one or more of the categories present in the bottom list which total as 97 categories.
Mobility Data Analysis
3.3
Data Analysis
As shown in table 3.2 the subscription costs vary with the passenger’s socio-economical status. Before we advance to a sample analysis of the full dataset, we present modest a description of each profile for better understanding our data.
3.3.1 Socio-economical description
In Portugal, the government provides several benefits at a financial level which vary, among other parameters, with the individual’s household annual income. The IAS, reads as ‘Indexante dos Apoios Sociais’, is a reference value that helps define all types of social support provided by the government, such as tax deduction calculation, social security contributions, social bene-fits eligibility, tax exemption eligibility in the National Health System, merit and social support scholarships [IAS]. For the reference year of 2013, the IAS held a value of 419,22e.
Each passenger may be eligible to discounts according to their social benefit eligibility rank-ing, which is given by a formula involving the IAS value and their household annual income. These benefits are targeted from children to young adult students, until the age of 23. Ranks A and B, formulas and eligibility values are presented in table 3.12. The last benefiting rank, rank F, targets students inserted in foster families and eligibility for this rank must abide to the formula 3.1.
Ranks Reference Household Income Household Income in 2013 A Equal or less than 0,5 * IAS * 14 Until 2.934,54e B More than 0,5 * IAS * 14 From 2.934,55 to 5.869,08e
and equal or less than 1 * IAS * 14
Table 3.12: Social aid ranks A and B eligibility formulas and values.
HouseholdAnnualIncome
14 ∗ (PassiveMemberAmount + 0, 25 ∗ DependantMemberAmount) ≤ 1, 2 ∗ IAS (3.1) 3.3.2 Profiles
In tables 3.13, 3.14 and 3.15 we demonstrate the existing passenger profiles, social aid ranks and how much benefit each one can provide. As demonstrated, ranked profiles are indicators for passengers with social aid benefits and profiles without rank receive no benefits aside from the regular age range discount.
Mobility Data Analysis
Profile Age range Rank Discount
4_12_escola.tp 4 to 12 years old
A 60%
B 25%
F 25%
13_18_escola.tp 13 to 18 years old
A 60%
B 25%
F 25%
sub 23_superior.pt 19 to 23 years old A 60%
F 25%
Table 3.13: Social aid monthly student subscriptions profile and rank discounts.
Profile Age range Rank Discount
Social + Adult - 25% A 50% D 25% Social + Senior R 25% Retired/Pensioner - 25%
Table 3.14: Social aid monthly subscriptions.
Profile Age range Discount Menor/13 Up to 13 years old 25%
Estudante - 25% Normal Adult N/A Normal M N/A Especial N/A Combinado STCP/CP N/A
Combinado STCP/Operador Privado N/A
3aidade Senior 25%
Table 3.15: Regular monthly subscriptions.
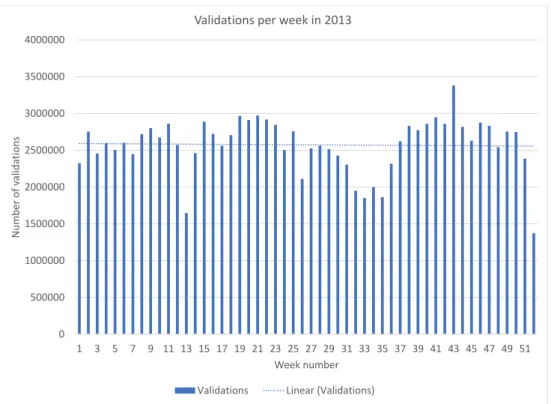
Given the size of this dataset, we reduced our study to a single month, the month of October of 2013, totaling close to 13.5 million validations in this time frame. The graphic 3.6 provides an overview of the validations distribution for each of the 52 weeks in 2013. The month of October is represented in the graphic 3.6 by the weeks 40 through 44 and their absolute validation numbers are displayed in table 3.16.
Mobility Data Analysis 0 500000 1000000 1500000 2000000 2500000 3000000 3500000 4000000 1 3 5 7 9 11 13 15 17 19 21 23 25 27 29 31 33 35 37 39 41 43 45 47 49 51 N u m b er of v alida tions Week number Validations per week in 2013
Validations Linear (Validations)
Figure 3.6: Amount of FVs per week for the year of 2013.
Week number Start date End Date Number of validations 40 30-Sep-13 06-Oct-13 2.860.012 41 07-Oct-13 13-Oct-13 2.948.038 42 14-Oct-13 20-Oct-13 2.860.004 43 21-Oct-13 27-Oct-13 3.380.789 44 28-Oct-13 03-Nov-13 2.818.365 Table 3.16: Validation numbers for weeks 40 to 44 of the year 2013.
Our dataset splits into two major categories, occasional and subscription titles, although cards designed for subscriptions are also capable of purchasing occasional trip titles of all types. From table 3.17 we observe that in October, a close to a fourth of this sample is composed of subscription cards while the remaining cards are used for occasional trip titles, but subscription cards provide the most validations. The ‘VPC ratio’ (formula 3.2) translates to validations per card ratio, it provides us a metric to evaluate the relevance of groups, profiles, stops, among others with each analysis throughout this work. As expected, table 3.17 shows that the VPC ratio is much higher for subscriptions cards than for occasional card.
∑xvalidations
∑xcards
∧ ∃x ∈ {Group, Pro f ile, Zone} (3.2)
Mobility Data Analysis Group Number of Cards Cards Dataset Ratio Number of Validations Validations Dataset Ratio VPC Ratio Assinatura 164.149 0.223 10.418.602 0,768 63.470 Ocasional 571.183 0.777 3.152.373 0,232 5.519 Total 735.332 1,0 13.570.975 1,0
Table 3.17: Group cards and validations comparison for October, 2013.
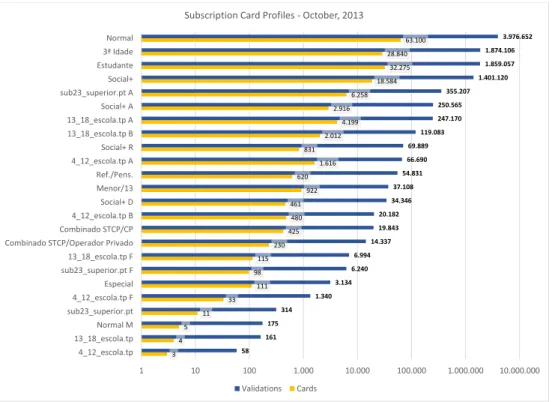
When dealing with occasional trip titles, the ‘Normal’ profile is the only one that makes sense and as seen on table 3.17 they account for 571.183 cards and 3.152.373 validations. With subscrip-tions we can look at all the different profiles and compare them. Looking at table 3.18 and graph 3.7, ‘Normal’ subscription cards make most of the sample followed by ‘Estudante’, ‘3aIdade’ and
‘Social+’ as the major profiles, accounting for 87% of all subscriptions cards in October of 2013. The same trend follows with the validation numbers with 87,4% of all validations belonging to these 4 major profiles. Graphic 3.7 is presented with a base 10 logarithmic scale for better visibil-ity, as will some other graphics beyond this point. Throughout the rest of this work we will focus mainly on subscription cards as their profiles is our analysis target.
3 4 5 11 33 111 98 115 230 425 480 461 922 620 1.616 831 2.012 4.199 2.916 6.258 18.584 32.275 28.840 63.100 58 161 175 314 1.340 3.134 6.240 6.994 14.337 19.843 20.182 34.346 37.108 54.831 66.690 69.889 119.083 247.170 250.565 355.207 1.401.120 1.859.057 1.874.106 3.976.652 1 10 100 1.000 10.000 100.000 1.000.000 10.000.000 4_12_escola.tp 13_18_escola.tp Normal M sub23_superior.pt 4_12_escola.tp F Especial sub23_superior.pt F 13_18_escola.tp F Combinado STCP/Operador Privado Combinado STCP/CP 4_12_escola.tp B Social+ D Menor/13 Ref./Pens. 4_12_escola.tp A Social+ R 13_18_escola.tp B 13_18_escola.tp A Social+ A sub23_superior.pt A Social+ Estudante 3ª Idade Normal
Subscription Card Profiles - October, 2013
Validations Cards
Mobility Data Analysis Profile Number of Cards Cards Dataset Ratio Number of Validations Validations Dataset Ratio VPC Ratio Normal 63.100 0,38441 3.976.652 0,381688 63,02143 3aIdade 28.840 0,17569 1.874.106 0,179881 64,98287 Estudante 32.275 0,19662 1.859.057 0,178436 57,60053 Social+ 18.584 0,11321 1.401.120 0,134483 75,39389 sub23_superior.pt A 6.258 0,03812 355.207 0,034094 56,76047 Social+ A 2.916 0,01776 250.565 0,024050 85,92764 13_18_escola.tp A 4.199 0,02558 247.170 0,023724 58,86402 13_18_escola.tp B 2.012 0,01226 119.083 0,011430 59,18638 Social+ R 831 0,00506 69.889 0,006708 84,10229 4_12_escola.tp A 1.616 0,00984 66.690 0,006401 41,26856 Ref./Pens. 620 0,00378 54.831 0,005263 88,43710 Menor/13 922 0,00562 37.108 0,003562 40,24729 Social+ D 461 0,00281 34.346 0,003297 74,50325 4_12_escola.tp B 480 0,00292 20.182 0,001937 42,04583 Combinado STCP/CP 425 0,00259 19.843 0,001905 46,68941 Combinado STCP/ Operador Privado 230 0,00140 14.337 0,001376 62,33478 13_18_escola.tp F 115 0,00070 6.994 0,000671 60,81739 sub23_superior.pt F 98 0,00060 6.240 0,000599 63,67347 Especial 111 0,00068 3.134 0,000301 28,23423 4_12_escola.tp F 33 0,00020 1.340 0,000129 40,60606 sub23_superior.pt 11 0,00007 314 0,000030 28,54545 Normal M 5 0,00003 175 0,000017 35,00000 13_18_escola.tp 4 0,00002 161 0,000015 40,25000 4_12_escola.tp 3 0,00002 58 0,000006 19,33333 TOTAL 164.149 1,0 10.418.602 1,0
-Table 3.18: Subscription card profiles for October, 2013.
3.3.3 Zones and Stops
In total there are 52 zones in the Metropolitan Area of Porto, but in this sample only 20 zones where accounted for which are listed with their stats on table 3.19 and a visualization of the zones is in figure 3.1. A deeper analysis follows for one zone and it’s relevant stops.
Sorted by the number of validations, table 3.19 shows the C1 zone as being the one holding the tri-factor, higher number of cards, validations and highest validation per card ratio, accounting for 74% of all cards and 48% of all validations. A relevant point to make when looking at this specific data is that the sum of cards does not equal to the sum of all cards of the dataset, as it would
Mobility Data Analysis
overpass that value, because a card may have validations on different zones being accounted more than once, but only once for each zone. As such each dataset ratio, either for cards or validations, was calculated with table’s 3.17 total values as these are overall numbers, subscription tables reference the subscription totals.
Zone Number of Cards Cards Dataset Ratio Number of Validations Validations Dataset Ratio VPC Ratio C1 542.764 0,73812 6.513.385 0,47995 12,00040 C2 179.435 0,24402 1.467.218 0,10811 8,17688 C6 175.314 0,23841 1.422.031 0,10478 8,11134 S8 136.494 0,18562 1.221.097 0,08998 8,94616 C5 75.606 0,10282 694.043 0,05114 9,17973 C9 73.166 0,09950 677.085 0,04989 9,25409 C3 73.766 0,10032 480.848 0,03543 6,51856 C8 40.499 0,05508 318.169 0,02344 7,85622 N10 64.149 0,08724 158.581 0,01169 2,47207 N3 27.355 0,03720 120.195 0,00886 4,39390 S2 8.145 0,01108 85.600 0,00631 10,50952 N11 14.903 0,02027 81.390 0,00600 5,46132 C11 6.630 0,00902 56.733 0,00418 8,55701 S9 9.793 0,01332 56.052 0,00413 5,72368 C10 8.816 0,01199 50.966 0,00376 5,78108 N16 6.428 0,00874 48.195 0,00355 7,49767 C4 5.740 0,00781 40.320 0,00297 7,02439 N2 8.499 0,01156 38.365 0,00283 4,51406 S1 5.323 0,00724 27.444 0,00202 5,15574 C16 989 0,00134 3.750 0,00028 3,79171 Table 3.19: Overall card and validation values for each MAP zone for October, 2013.
Scoping this zone overview to only subscription cards, table 3.20 and graphic 3.8 shows again the C1 zone as being the most dominant zone, accounting for approximately 82% of all subscrip-tion cards and 48% of all validasubscrip-tions and its VPC ratio is more than the double of the second ranked zone (C2 zone) with a 37,3 VPC ratio.
Mobility Data Analysis Zone Number of Cards Cards Dataset Ratio Number of Validations Validations Dataset Ratio VPC Ratio C1 134.102 0,8170 5.008.001 0,48068 37,345 C2 62.173 0,3788 1.157.347 0,11108 18,615 C6 61.676 0,3757 1.115.769 0,10709 18,091 S8 37.034 0,2256 929.800 0,08924 25,107 C9 24.239 0,1477 536.138 0,05146 22,119 C5 23.405 0,1426 529.327 0,05081 22,616 C3 18.649 0,1136 350.504 0,03364 18,795 C8 16.047 0,0978 253.310 0,02431 15,786 N10 5.562 0,0339 74.561 0,00716 13,405 N3 3.981 0,0243 74.075 0,00711 18,607 S2 3.610 0,0220 70.904 0,00681 19,641 N11 4.268 0,0260 57.213 0,00549 13,405 C11 2.731 0,0166 47.307 0,00454 17,322 S9 3.773 0,0230 44.509 0,00427 11,797 C10 4.926 0,0300 43.286 0,00415 8,787 N16 2.663 0,0162 37.839 0,00363 14,209 C4 2.727 0,0166 32.915 0,00316 12,070 N2 1.710 0,0104 23.767 0,00228 13,899 S1 2.830 0,0172 22.340 0,00214 7,894 C16 693 0,0042 3.159 0,00030 4,558
Table 3.20: Subscription card and validation values for each MAP zone for October, 2013.
Mobility Data Analysis 693 2.830 1.710 2.727 2.663 4.926 3.773 2.731 4.268 3.610 3.981 5.562 16.047 18.649 23.405 24.239 37.034 61.676 62.173 134.102 3.159 22.340 23.767 32.915 37.839 43.286 44.509 47.307 57.213 70.904 74.075 74.561 253.310 350.504 529.327 536.138 929.800 1.115.769 1.157.347 5.008.001 1 4 16 64 256 1.024 4.096 16.384 65.536 262.144 1.048.576 4.194.304 C16 S1 N2 C4 N16 C10 S9 C11 N11 S2 N3 N10 C8 C3 C5 C9 S8 C6 C2 C1
All Zones Subscription Card Analysis - October, 2013
validacoes cartoes
Figure 3.8: Subscription card and validation values for each MAP zone for October, 2013.
Regarding stops, we’re looking at more than 2.5K accounted stops and as such we only present data for the top ten stops. A visualization of stop distribution can be observed in figure 3.9. Table 3.21 also shows that zone C1 has the highest amount of cards and validations for this time frame, with the top five stops belonging to this zone. The stop ‘Trindade’ with 231.104 cards and 1.163.976 validations is the most popular stop, having aproximately 2.4 times the amount of cards and 3.4 times the amount of validations of the second ranked stop ‘Casa da Música’. Even though ‘Trindade’ is the most popular stop, it only accounts for aproximately 8,6% of the whole validation dataset, yet it manages to reach 31,4% of all cards.
Mobility Data Analysis
Figure 3.9: All stops in the Metropolitan Area of Porto.
Mobility Data Analysis
Stop Zone Number of Cards Cards Dataset Ratio Number of Validations Validations Dataset Ratio VPC Ratio Trindade C1 231.104 0,3143 1.163.976 0,08577 3,561 Casa da Música C1 97.615 0,1327 347.647 0,02562 3,512 Campanhã C1 76.425 0,1039 268.416 0,01978 2,961 São Bento C1 85.831 0,1167 254.165 0,01873 2,695 Bolhão C1 84.990 0,1156 229.074 0,01688 3,995 Senhora da Hora C2 51.330 0,0698 205.071 0,01511 3,701 João de Deus S8 48.531 0,0660 179.635 0,01324 5,243 Santo Ovídio S8 33.077 0,0450 173.424 0,01278 4,248 24 de Agosto C1 38.666 0,0526 164.264 0,01210 3,815 IPO C6 40.089 0,0545 152.947 0,01127 3,930 Table 3.21: Overall card and validation values for the top 10 stops from all zones for October, 2013.
With subscriptions in table 3.22 and graphic 3.10, the same top five remain and ‘Trindade’ still leads, but with less numbers albeit it still being a significant amount. The most important factor to retrieve from this is the increase of the VPC ratio, going from the overall 3,5 ratio to the subscription scoped 11,5 ratio.
Stop Zone Number of Cards Cards Dataset Ratio Number of Validations Validations Dataset Ratio VPC Ratio Trindade C1 68.466 0,41710 787.462 0,07558 11,50150 Casa da Música C1 39.149 0,23850 247.864 0,02379 6,33130 Campanhã C1 24.784 0,15098 183.224 0,01759 7,39283 São Bento C1 29.513 0,17979 163.547 0,01570 5,54152 Bolhão C1 34.057 0,20748 153.036 0,01469 4,49353 Senhora da Hora C2 17.609 0,10727 134.729 0,01293 7,65114 Santo Ovídio S8 12.695 0,07734 128.632 0,01235 10,13249 24 de Agosto C1 19.277 0,11744 128.272 0,01231 6,65415 João de Deus S8 16.646 0,10141 121.989 0,01171 7,32843 Marquês C1 17.864 0,10883 111.243 0,01068 6,22722 Table 3.22: Subscription card and validation values for the top 10 stops from all zones for October, 2013.
Mobility Data Analysis 17.864 16.646 19.277 12.695 17.609 34.057 29.513 24.784 39.149 68.466 111.243 121.989 128.272 128.632 134.729 153.036 163.547 183.224 247.864 787.462 0 100.000 200.000 300.000 400.000 500.000 600.000 700.000 800.000 900.000 Marquês João de Deus 24 de Agosto Santo Ovídio Senhora da Hora Bolhão São Bento Campanhã Casa da Música Trindade
Top 10 Subscription Card Stop Analysis - October, 2013
Validations Cards
Figure 3.10: Subscription card and validation values for the top 10 stops from all zones for Octo-ber, 2013.
3.3.3.1 In-depth C1 Zone Analysis
In this topic we focus our analysis solely on the most relevant zone as seen before, that is zone C1. Looking at table 3.23, the same trend as the overall data is observed, there are less subscription cards, with them constituting only close to a quarter of the zone’s dataset, but with validation numbers the contrary is observed and more than 75% of them are from subscription cards resulting in a high VPC ratio of 37,3.
Group Number of Cards Cards C1 Dataset Ratio Number of Validations Validations C1 Dataset Ratio VPC Ratio Assinatura 134.102 0,247 5.008.001 0,769 37,345 Ocasional 408.663 0,753 1.505.384 0,231 3,684 TOTAL 542.765 1,0 6.513.385 1,0
-Table 3.23: Group card and validation values comparison for zone C1 for October, 2013.
The top 5 profiles for subscription cards remain the same in the C1 zone as the overall analysis, observed on table 3.24 and graphic 3.11 (with a base 2 logarithmic scale for better visibility). The dataset ratio on this table relates only to the C1 zone and not the entire dataset and as such we
Mobility Data Analysis
observe such high percentage values. Although the ‘Normal’ profile leads with the biggest number of validations and accounting for almost 40% of the zone’s dataset, the ‘Social+’ profile in the top 5 shows the highest VPC ratio with a value of 43,7. Yet, the profile with the highest VPC ratio is ‘Social+ A’ with a value of 50,3, a profile variant of ‘Social+’ with more benefits, shown in table 3.14. Profile Number of Cards Cards C1 Dataset Ratio Number of Validations Validations C1 Dataset Ratio VPC Ratio Normal 51.818 0,386407 1.971.783 0,393727 38,052 Estudante 25.349 0,189028 895.749 0,178864 35,337 3aIdade 26.028 0,194091 879.762 0,175671 33,801 Social+ 14.818 0,110498 647.211 0,129235 43,677 sub23_superior.pt A 5.619 0,041901 176.854 0,035314 31,474 Social+ A 2.558 0,019075 128.704 0,025700 50,314 13_18_escola.tp A 2.586 0,019284 111.138 0,022192 42,977 13_18_escola.tp B 1.195 0,008911 51.665 0,010316 43,234 Social+ R 765 0,005705 37.276 0,007443 48,727 4_12_escola.tp A 827 0,006167 23.792 0,004751 28,769 Ref./Pens. 523 0,003900 16.260 0,003247 31,090 Social+ D 391 0,002916 16.215 0,003238 41,471 Menor/13 535 0,003990 14.847 0,002965 27,751 Combinado STCP/CP 382 0,002849 12.332 0,002462 32,283 Combinado STCP/ Operador Privado 221 0,001648 9.762 0,001949 44,172 4_12_escola.tp B 226 0,001685 6.783 0,001354 30,013 13_18_escola.tp F 70 0,000522 2.722 0,000544 38,886 sub23_superior.pt F 80 0,000597 2.683 0,000536 33,538 Especial 98 0,000731 1.692 0,000338 17,265 4_12_escola.tp F 17 0,000127 480 0,000096 28,235 sub23_superior.pt 11 0,000082 167 0,000033 15,182 13_18_escola.tp 3 0,000022 73 0,000015 24,333 Normal M 2 0,000015 44 0,000009 22,000 4_12_escola.tp 2 0,000015 7 0,000001 3,500 TOTAL 134.124 1,0 5.008.001 1,0
Mobility Data Analysis 2 2 3 11 17 98 80 70 226 221 382 535 391 523 827 765 1.195 2.586 2.558 5.619 14.818 26.028 25.349 51.818 7 44 73 167 480 1.692 2.683 2.722 6.783 9.762 12.332 14.847 16.215 16.260 23.792 37.276 51.665 111.138 128.704 176.854 647.211 879.762 895.749 1.971.783 1 4 16 64 256 1.024 4.096 16.384 65.536 262.144 1.048.576 4_12_escola.tp Normal M 13_18_escola.tp sub23_superior.pt 4_12_escola.tp F Especial sub23_superior.pt F 13_18_escola.tp F 4_12_escola.tp B Combinado STCP/Operador Privado Combinado STCP/CP Menor/13 Social+ D Ref./Pens. 4_12_escola.tp A Social+ R 13_18_escola.tp B 13_18_escola.tp A Social+ A sub23_superior.pt A Social+ 3ª Idade Estudante Normal
Zone C1 Subscription Profile Analysis for October, 2013
Validations Cards
Figure 3.11: Subscription zone C1 card and validation values per profile for October, 2013.
‘Trindade’ shows again to be the most dominant in table 3.25, gathering a bit more than half the C1 zone subscription cards and doubles the amount of subscription validations of the second ranked stop ‘Casa da Música’ in table 3.26. With the highest VPC ratio of 11,5, each subscription card averaged 11 validations in ‘Trindade’ for the month of October, 2013.
Stop Number of Cards Cards C1 Dataset Ratio Number of Validations Validations C1 Dataset Ratio VPC Ratio Trindade 231.104 0,42579 1.163.976 0,1787052 5,03659 Casa da Música 97.615 0,17985 347.647 0,0533742 3,56141 Campanhã 76.425 0,14081 268.416 0,0412099 3,51215 São Bento 85.831 0,15814 254.165 0,0390220 2,96123 Bolhão 84.990 0,15659 229.074 0,0351697 2,69531
Table 3.25: Top 5 overall stops for the C1 zone for October, 2013.
Mobility Data Analysis Stop Number of Cards Cards C1 Dataset Ratio Number of Validations Validations C1 Dataset Ratio VPC Ratio Trindade 68.466 0,51055 787.462 0,15724 11,502 Casa da Música 39.149 0,29193 247.864 0,04949 6,331 Campanhã 24.784 0,18481 183.224 0,03659 7,393 São Bento 29.513 0,22008 163.547 0,03266 5,542 Bolhão 34.057 0,25396 153.036 0,03056 4,494 Table 3.26: Top 5 stops for subscription card values in the C1 zone for October, 2013.
Mobility Data Analysis
3.3.3.2 Stop ‘Trindade’ Profile Analysis
Next we chose a stop to analyse, specifically the profiles data observed for that stop in this time frame, and ‘Trindade’, being the most popular stop, was a straightforward choice. In table 3.27 the top profile is ‘Normal’ with close to 39% of all subscription cards from ‘Trindade’s dataset and 42% of its validations. However, the ‘Estudante’ profile constitutes a quarter of this stop’s dataset and has a similar VPC ratio of the ‘Normal’ profile.
Profile Number of Cards Cards Trindade Dataset Ratio Number of Validations Validations Trindade Dataset Ratio VPC Ratio Normal 26.642 0,38913 331.060 0,42041 12,426 Estudante 17.509 0,25573 214.731 0,27269 12,264 Social+ 8.005 0,11692 90.072 0,11438 11,252 3aIdade 6.899 0,10077 52.487 0,06665 7,608 sub23_superior.pt A 4.066 0,05939 41.844 0,05314 10,291 13_18_escola.tp A 1.615 0,02359 19.391 0,02462 12,007 Social+ A 1.447 0,02113 15.000 0,01905 10,366 13_18_escola.tp B 736 0,01075 9.699 0,01232 13,178 Social+ R 350 0,00511 2.762 0,00351 7,891 4_12_escola.tp A 299 0,00437 2.317 0,00294 7,749 Social+ D 242 0,00353 2.229 0,00283 9,211 Menor/13 187 0,00273 1.476 0,00187 7,893 Combinado STCP/ Operador Privado 90 0,00131 1.041 0,00132 11,567 4_12_escola.tp B 84 0,00123 957 0,00122 11,393 Combinado STCP/CP 81 0,00118 381 0,00048 4,704 sub23_superior.pt F 62 0,00091 998 0,00127 16,097 Ref./Pens. 54 0,00079 394 0,00050 7,296 13_18_escola.tp F 45 0,00066 352 0,00045 7,822 Especial 39 0,00057 199 0,00025 5,103 sub23_superior.pt 9 0,00013 52 0,00007 5,778 4_12_escola.tp F 4 0,00006 10 0,00001 2,500 13_18_escola.tp 1 0,00001 10 0,00001 10,000 TOTAL 68.466 1,0 787.462 1,0
-Table 3.27: Trindade subscription card profiles for October, 2013
The top 5 profiles remain the same given the validation sort approach as we targeted the most popular zones and stops throughout our method. So, for this specific situation, these five profiles
Mobility Data Analysis
should be and seem to be enough for a specific profile analisys which comes next, as we reduce our sample to a definite number of card profiles and pick the most appealing ones for recommendation. 3.3.3.3 Subsampling ‘Trindade’
The next step of our work is to sample the cards that contain validations in ‘Trindade’, as this as been our analysis target and are looking to recommend around that stop’s area. We aim to find realistic cards that can represent a real day to day usage.
The average of the whole set for the entire 2013 year is aproximately 45 validations per card (see table 3.6) in a year! Heavily influenced by occasional cards this number is far from represent-ing the average subscription passenger. Gorepresent-ing back to the month of October, there are subscription cards that have more than 200 validations in a month (some even reach 1800). These are most likely special cards used by transport operators. For our average usage scenario, we are looking for an user who will on average make 2 trips per day and validate his card on average 4 times (with a vehicle exchange in its travel path), having 22 work days per month and 4 validations a day we should be looking for subscription cards with 88 validations.
With the exact number of 88 validations, we have 432 subscription cards containing ‘Trindade’ validations. Table 3.28 shows us the list of profiles present in this sample and we can observe as the top 5 profiles are the same observed in all samples throughout our work.
At this stage, we look to analyse each profile individually, meaning we look into a cards valida-tions for frequency of validavalida-tions on each stop. Stops are geolocated, so gathering the information of validation frequency we can not only trace possible travel paths for each card but also recognize the most relevant locations for each card. The data outcome of this process is what we call a card’s mobility profile.
Mobility Data Analysis
Profile Number of Cards Number of Validations
Normal 150 13.200 Estudante 120 10.560 Social+ 51 4.488 3aIdade 44 3.872 sub23_superior.pt A 31 2.728 13_18_escola.tp A 12 1.056 Social+ A 9 792 13_18_escola.tp B 8 704 Menor/13 3 264 Combinado STCP/ Operador Privado 1 88 Social+ R 1 88 4_12_escola.tp A 1 88 Social+ D 1 88 TOTAL 432 38.016
Table 3.28: Subsample of cards with 88 validations containing ‘Trindade’ for October, 2013.
3.3.4 Mobility Profile
The mobility profile observable on a specific card is the ratio between the number of valida-tions in each stop versus total number of validavalida-tions of that card, paired with stops’ geolocavalida-tions, we constitute the most frequent locations of the card.
Table 3.29 represents the mobility profile of a card. This alone only already shows us which are the most common crossing points in this card’s daily commute, being ‘Trindade’ the main crosspoint with a quarter of all its validations. Being ‘Trindade’ a central metro station which connects most lines, it’s not unexpected for it to have such a high frequency, and in this specific mobility profile, it is likely to be less of a relevant stop, as in, the passenger most likely doesn’t wander in the area surround the station and it’s simply a point in his travel path. Figure 3.12 visualizes the mobility profile on a map, where the width of each circle point varies accordingly to the location frequency.
Given the frequency similarities, we can speculate that the route from ‘Urb. Vila D’Este’ to ‘S. João de Brito’ (or vice-versa) is a common one. With the analysis of validation times, we might even speculate about the area of residence of this passenger, but no such data was analysed on this work.
![Figure 2.1: The long tail phenomenon [Lon].](https://thumb-eu.123doks.com/thumbv2/123dok_br/15500261.1044969/28.892.170.678.143.512/figure-the-long-tail-phenomenon-lon.webp)