Global IQP Index
Ranking Innovation, Quality and Productivity
(IQP) performance at global level
Trabalho Final na modalidade de Projeto apresentado à Universidade Católica Portuguesa
para obtenção do grau de mestre em Gestão
por
Helder Luís Cachinho Laranjeira
sob orientação deProfessora Drª Maria Conceição Portela e de Professor Dr. Rui Sousa
Católica Porto Business School, Universidade Católica Portuguesa Outubro 2016
Acknowledgements
To dear Professors Maria Conceição Portela and Rui Sousa, who patiently and wisely guided me through this endeavour, for their time and efforts, dedication and understanding.
To my beloved wife Maria in infinite recognition, whose selfless devotion and dedication permitted this long journey, allowing me to dare discover a better self.
To my beloved children, Joana, Catarina and Luis, who have inspired me to complete this journey.
And to my beloved parents, who have taught me to walk and stand in life, always unconditionally present.
Resumo
Pretende-se com este trabalho definir e desenvolver um novo modelo de avaliação de desempenho de inovação, qualidade e produtividade ao nível macro-económico (países), que permita a observação do desempenho e desenvolvimento relativos dos diferentes países, com destaque para Portugal.
O modelo proposto parte da observação e análise de modelos existentes e orientações oficiais em metodologias de medição de inovação, qualidade e produtividade. As principais referências são o Innovation Union Scoreboard, o Global Innovation Index, o Global Competitiveness Report, o OECD Oslo Manual on Guidelines for Collecting and Interpreting Innovation Data o Barómetro de Inovação COTEC e o OECD Manual on Measuring Productivity.
Pretende-se que o modelo forneça informação visual clara dos indicadores relevantes, permitindo análise, interpretação contextual e obter conclusões. Pretende-se igualmente que represente uma ferramenta útil de tomada de decisão política, encorajando esforços a nível de desenvolvimento interno e estimulando a competitividade entre pares, enquanto contributo para a consciencialização da importância na medição de desempenho e estabelecer bases para desenvolvimento futuro.
Palavras-chave: Gestão de desempenho, Avaliação de desempenho; Produtividade; Qualidade; Inovação; Barómetros.
Abstract
The aim of this work is to conceptualize and develop a new scoreboard of innovation, quality and productivity performance at macro-economic (country) level, permitting observation of relative performance and development positioning for different countries, highlighting Portugal.
The proposed Scoreboard is based on an analysis of existing scoreboards and institutional guidance and methodologies on measuring Innovation, Quality and Productivity. It’s references are the Innovation Union Scoreboard, the Global Innovation Index, the Global Competitiveness Report, the OECD Oslo Manual on Guidelines for Collecting and Interpreting Innovation Data, the COTEC Innovation Digest, and the OECD Manual on Measuring Productivity.
This Scoreboard is intended to provide clear and graphical information of relevant indicators, permitting analysis, contextual interpretation and benchmarking and conclusions. It is also meant to be a useful political decision-making tool, encouraging efforts on internal improvements and stimulating peer performance competition whilst increasing awareness to the importance of performance measurement, whilst setting the basis for future development. Keywords: Performance management; Performance measurement;
Table of Contents
Acknowledgements ... iii
Resumo ... v
Abstract ... vii
Table of Contents ... ix
Table of Figures ... xii
Tables ... xiii Introduction ... 15 Chapter 1 ... 19 1. Conceptual Background ... 19 1.1 Performance Measurement ... 19 1.2 Innovation ... 21 1.3 Quality ... 21 1.4 Productivity ... 21 1.5 Existing tools ... 22 1.5.1 Measuring Innovation ... 23
1.5.1.1 Global Innovation Index ... 24
1.5.1.2 Innovation Union Scoreboard ... 28
1.5.1.3 Global Competitivity Report ... 31
1.5.1.4 COTEC Innovation Digest ... 36
1.5.2 Measuring Quality ... 37
1.5.3 Measuring Productivity ... 38
Chapter 2 ... 40
2. Defining a new model: Global Innovation Quality and Productivity Index ... 40
2.1 Overview ... 40
2.2 Conceptual measurement framework ... 41
2.2.1 Data Sources ... 44
2.2.2 Data Scope ... 45
2.2.3 Methodology ... 46
Chapter 3 ... 49
3. Model application: IQP Index 2014 ... 49
3.1 Overview ... 49
3.3 Performer Classification and analysis ... 56 3.4 Drivers of Performance ... 60 Chapter 4 ... 65 4. Conclusions ... 65 Bibliography ... 68 Appendix ... 70
Table of Figures
Figure 1 – Balanced Scorecard ... 20
Figure 2 – The Innovation Measurement Framework ... 23
Figure 3 – The IQP 3-Dimensional Model ... 41
Figure 4 – The IQP Index & Growth Framework ... 42
Figure 5 – The IQP 2014 Index & Growth ... 50
Figure 6 – The IQP 2014 Growth rank ... 51
Figure 7 – The IQP 2014 Innovation Index & Growth rank ... 53
Figure 8 – The IQP 2014 Quality Index & Growth rank ... 54
Figure 9 – The IQP 2014 Productivity Index & Growth rank ... 56
Figure 10 – The IQP 2014 – time evolution ... 57
Figure 11 – The IQP 2014 – 3 Dimensional Performance ... 58
Figure 12 – The IQP 2014 – Output Indicators ... 59
Figure 13 – The IQP 2014 – Input Indicators ... 60
Figure 14 – The IQP 2014 – Sectorial Performance ... 61
Tables
Table 1 – Productivity measure types ... 39
Table 2 – IQP – Data Sources ... 44
Table 3 – IQP - Countries ... 45
Table 4 – IQP - Performers ... 57
Table 5 – IQP Index 2004 - rank ... 71
Table 6 – IQP Index 2009 - rank ... 72
Table 7 – IQP Index 2014 - rank ... 73
Table 8 – IQP Index: Innovation – Scientific Publications ... 74
Table 9 – IQP Index: Innovation – Patent Applications ... 75
Table 10 – IQP Index: Innovation – Industrial Design Applications ... 76
Table 11 – IQP Index: Innovation - New Business Registrations ... 77
Table 12 – IQP Index: Innovation – High-Technology Exports ... 78
Table 13 – IQP Index: Innovation – ICT Goods Exports ... 79
Table 14 – IQP Index: Quality – ISO 9001 Certifications ... 80
Table 15 – IQP Index: Quality – ISO 13485 Certifications ... 81
Table 16 – IQP Index: Quality – ISO 14001 Certifications ... 82
Table 17 – IQP Index: Quality – ISO 16949 Certifications ... 83
Table 18 – IQP Index: Quality – ISO 22000 Certifications ... 84
Table 19 – IQP Index: Quality – ISO 27001 Certifications ... 85
Table 20 – IQP Index: Productivity – GDP per Capita ... 86
Table 21 – IQP Index: Productivity – GDP per Labourer ... 87
Table 22 – IQP Index: Productivity – GDP per actual worked hours ... 88
Table 23 – Input indicators: Infrastructure Investment ... 89
Table 24 – Input indicators: Gross R&D Expenditure ... 90
Table 25 – Input indicators: Logistics Performance Index (rank) ... 91
Table 26 – Input indicators: Tertiary Education Attainment ... 92
Table 27 – Input indicators: ICT Access and Usage ... 93
Introduction
As society develops deeper into global automation, communication and standardization, economic activities are graced with new capacities, forms and origins for sourcing, evaluating, supplying and exchanging goods and knowledge. This evolution is only made possible through innovation and technological advances. These advances represent the leveraging factor of productivity, allowing for an unprecedented increase of capacity feeding the demand macro-economic trends. On the boundaries of such development, quality, in its multiple dimensions, takes central role by defining the governing principles of conformance to the specified objectives.
Feeding this development, information flow processing takes a central role, providing an abundance of data resources and tools for every possible activity, expanding continuously possibilities and bringing a new challenge: how to usefully harness such amount of acquired information power?
Surveys, scoreboards, monitoring systems, quality management and real-time information abound. Top-tens, shortlists and ranks exist for nearly any information of social and economic relevance: economic development levels of countries, unemployment rates, quality of living for cities, best companies to work, university employability, salary surveys, waiting times, transport punctuality and service quality levels, to name but a few. All are mere examples
of a myriad of digested and presented compilation of indicators and data. Rankings are the competitive and most visible tool for transversal analysis on a given subject group, hierarchically organizing peer performance as per intended indicator. This relative positioning of peers has helped (in)forming public opinion and supporting policy makers or any decision-maker, for whom strategic performance evaluations represent a strong decision support factor for continuity and predictability. Benchmarking has become a very useful tool for qualitative and quantitative analysis on performance, allowing quick observation of relative positioning of a specific agent in relation to its peers. Companies have also recognized this external driver as strategically important in providing a fundamental management support tool (Neely, 1999, p. 211).
Innovation, Quality and Productivity are key performance fields on the development of any economic activity, and are, as such, the subject of analysis in this research. To better understand the state of the art in these key performance fields, this research identifies, collects and evaluates existing literature and measuring models, analyzing the respective methodologies, inputs and outputs, seeking to understand and identify main advantages and shortcomings. The resulting conclusions and identified opportunities serve the supporting basis for the development and proposal of a new model.
Sets of criteria were used for establishing the relevance of existing scoreboards and sources of information. These criteria were:
a) to be relevant and institutionally recognized;
b) to be based on robust, high quality and openly available data sources; c) to have a wide scope of relevant countries
Each model and source of information is evaluated and analyzed, extracting relevant methodologies and indicator guidelines, to establish the path to the development of the proposed tool. This analysis sets the justification for the development of a conceptual framework that is the governing basis of the proposed scoreboard. The framework is then applied to real data, aggregated, organized and computed into a set of visual outputs, dashboards and benchmarks, establishing what defines the proposed model.
Chapter 1
Conceptual Background
This chapter introduces to the subject, presenting current definitions, reviewing current frameworks and analyses the recognized sources of information.
1.1 Performance measurement: definition
Neely (1995) defines performance measurement as “the process of quantifying action, where measurement is the process of quantification and action leads to performance” (Neely, 1995, p. 80). The author analyses performance measurement systems at individual performance measure level, arguing that performance measures need to be positioned in a strategic context, as they influence what people do. It is observed that quality, time, cost and flexibility represent the key dimensions for performance measurement. With regards to quality, the author notes the shift in the literature from specification conformity to customer satisfaction, noting a shift from process performance towards output performance.
At micro-economic level, Kaplan and Norton (1992) developed the performance measurement tool “Balanced Scorecard” (BSC), focused on strategy and vision of the business instead of extensive controlling measurement, usually ineffective and vulnerable to bias. The proposed framework (see figure 1) values business innovation and productivity and is
based on a four dimensional strategy: Financial, Customer, Internal Business and Innovation and Learning perspectives. For each dimension a defined set of goals is matched by a defined set of measures/indicators that are directly correlated to the goal. By setting these “strategic goals” in a clear, concise
manner, supported by measurable indicators, the framework is easily defined and controlled at managerial level, and easily implemented at operational level.
Antonsen (2010) analyzed the BSC methodology applied as a strategic management tool for top-down processes in a financial organization and its effect on line managers and employees. Although recognizing positive financial contribution from the application of BSC, the researcher identifies an adverse impact on employee commitment in the organization, which is widely recognized as beneficial for the organization. BSC application is found to strengthen organization formality, increasing top-down formal management control whilst reducing critical employee feedback. The author argues that BSC application is considered as “inappropriate for measuring complex work tasks” (Antonsen, 2010 p. 49) as considered in the case-study presented. Findings support the need for employee involvement on work process specification and measurement for such complex environments. The BSC methodology is also found to be vulnerable to input errors, resulting in distorted results, which in turn have a further negative effect on employee confidence on organization’s performance control measures.
Financial Perspective Goals Measures
Innovation and Learning Perspective Goals Measures
Internal Business Perspective Goals Measures
Customer Perspective Goals Measures
1.2 Innovation
Innovation is best defined as “the implementation of a new or significantly improved product (good or service), or process, a new marketing method, or a new organizational method in business practices, workplace organization or external relations” (OECD/EUROSTAT, 2005, p. 46). Innovation is also recognized as “the dominant factor in national economic growth” (OECD/EUROSTAT/EU, 1997, p. 15) and the main economic driver of economic growth in the EU” (European Union, 2013, p. 3).
Four main types of innovation are identified by the OECD-EUROSTAT (2005, p. 16). These are: product/service, process, marketing and organizational innovation.
1.3 Quality
Neely (1995) defines quality as having “been traditionally defined in terms of conformance to specification” (Neely, 1995, p.85) and argues that is now shifting from a notion of “conformance to specification”, and thus towards customer satisfaction. The author also identifies quality’s multiple dimensions: (1) performance; (2) features; (3) reliability; (4) conformance; (5) technical durability; (6) serviceability; (7) aesthetics; (8) perceived quality; (9) humanity; (10) value. (Neely, 1995, p. 84).
1.4 Productivity
Productivity is “commonly defined as a ratio of volume measure of output to a volume measure of input use” (OECD, 2001, p.11). This definition represents the general consensual conception and is adopted by general literature. OECD also recognises difficulties on the correct application and measurement of
productivity, depending on the indicators used, with advantages and limitations. If productivity can be easily defined, its measurement represents challenges as diverse as its applications. It is, therefore, important to clearly define the objective of the measurement in order to correctly conceptualise its applicability. OECD identifies the main objectives of productivity as being Technology, Efficiency, Real cost savings, Benchmarking production processes, and Living Standards (OECD, 2001, p.11-12).
Grassano (2014) argues that a paradigmatic change was introduced by the Information and Communication Technology (ICT) revolution, with special productivity effects on services. Services typically involve customers in the production process and ICT has contributed dramatically to opening activities to co-production. This has resulted in timesavings for both producers and consumers, with consequential reduction in labour costs and increase in productivity.
1.5 Existing tools
Following the purpose of this research it is important to identify, analyze and review existing measurement tools, looking in detail at the conceptual frameworks and input/output indicators. The identified frameworks are presented and detailed down to indicator level and the methodologies reviewed. Due to the extension of some of the existing frameworks it has been chosen to only expand the data that is considered relevant to the proposed model, opting to present without great detail indicators that are not regarded as relevant for the proposed model.
1.5.1 Measuring Innovation
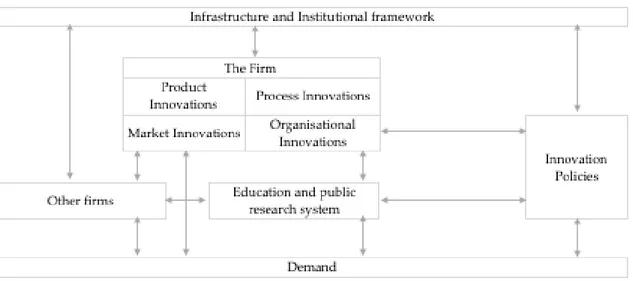
The OSLO Manual (OECD-EUROSTAT 2005), co-developed by the OECD and the EUROSTAT defines a set of guidelines for collection and interpretation of Innovation, based on the following characteristics: (a) Innovation in the firm; (b) Linkages with other firms and public research institutions; (c) The institutional framework in which firms operate; and (d) the role of demand. The framework is presented in the following figure ( figure 2).
The essential innovation factors identified at the firm level, are the following: (a) Research and Development; and (b) Innovative activity that indirectly promotes innovation development or adoption. In terms of context, the Manual defines the following factors: (a) basic educational system of population; (b) Higher education system; (c) Technical training system; (d) Science and Research base; (e) shared codified knowledge; (f) innovation policies; (g) legislative and macroeconomic settings; (h) infrastructure (transport and telecommunication); (i) Financial ‘ease of access’; (j) Market accessibility; and (k) Industry Structure and competitive environment.
1.5.1.1 Global Innovation Index (GII)
The Global Innovation Index is an annual publication, developed co-jointly by the Cornell University, INSEAD, and the World Intellectual Property Organization (WIPO) and uses 79 indicators and ranking of 141 world economies. To rank the countries, an overall score is computed as the simple average of the input and output sub-index scores. Each sub-index is a simple average of the corresponding pillar scores (five for input and two for output). The five input pillars focus on contextual environment, considered as enabler pillars, “conductive to innovation within an economy” (Cornel/Insead/WIPO 2015. p. 77). These pillars focus on Institutional environment (at Political, regulatory and business level), Human capital and research environment (in terms of expenditure and attainment levels), Infrastructure environment (in terms of ICT, general infrastructure and environmental development) and level of sophistication at Market level (in terms of Credit, investment and competitive environment) and at Business level (in terms of knowledge workers, innovation linkages and knowledge absorption capacity). The two output pillars focus on the results from innovative activities, specifically on Knowledge and Technology outputs (in terms of creation, impact and absorption) and Creative outputs (intangibles, creative goods and services and online creativity).
The index represents a composite value calculated as the weighted average of its subordinated pillars which themselves represent a weighted average of its subordinated sub-pillars, down to each individual indicator. It also presents an Innovation Efficiency Ratio, obtained from the division of the output sub-index score over the input sub-index score. This allows for a secondary ranking/observation in terms of innovation potential. Indicators are normalized using either GDP or population numerators. To allow comparability between economies independently of stage, GDP at purchasing power parity is used. With regards to missing values, a minimum threshold of data availability is set
per country, discarding countries with poor data availability. Following that selection, any missing data are not considered in score calculations. Outliers are identified and not considered for in the score formula to prevent distortions.
All indicators are normalized (following the minimum - maximum method) into a 0-100 range as per the following formulas:
The Global Innovation Index 2015 framework is structured as follows (Cornel/Insead/WIPO 2015. p. 307
Innovation Efficiency Ratio
• Innovation Input
• Institutions
• Political Environment
• Political Stability, index (perception of the likelihood for governmental disruption, World Bank – World Governance Indicators)
• Government effectiveness, index (perception of degree of Independence of public services, World Bank – World Governance Indicators)
• Regulatory Environment
• Regulatory Quality, index (perception of government ability to permit and promote private-sector development, World Bank – World Governance Indicators)
• Rule of Law, index (perception of agents confidence in and abide by the rules of society, World Bank – World Governance Indicators)
• Cost of redundancy dismissal, in salary weeks (World Bank, Ease of Doing Business)
• Business Environment
• Ease of starting a business, distance to frontier(World Bank, Ease of Doing Business)
• Ease of resolving insolvency, distance to frontier(World Bank, Ease of Doing Business)
• Ease of paying taxes, distance to frontier(World Bank, Ease of Doing Business)
• Human Capital and Research
• Education
• Expenditure on education, % GDP
• Gov. expenditure p. pupil, secondary, % GDP p. cap. • School life expectancy, years
• Assessment in reading, mathematics and science, PISA average scales (OECD)
• Pupil-teacher ratio, at secondary level of education • Tertiary Education
• % of population enrolled in tertiary education of all population at tertiary attainment age
• Graduates in science and engineering, % of total tertiary • Tertiary inbound mobility, ratio % (students from abroad) • Research & Development
• Researchers, (Full Time Equivalent)/million pop. • Gross expenditure on R&D, %GDP
• QS university ranking, average score top 3 (QS World University Ranking)
• Infrastructure
• Information and Communication Technologies
• ICT access, composite index (International Telecommunication Union)
• ICT use, composite index (International Telecommunication Union)
• Government’s online service, index, survey (UNPAN) • online e-participation, index, survey (UNPAN) • General Infrastructure
• Electricity output, kWh/cap.
• logistics performance, index (World Bank and Turku School of Economics)
• Gross capital formation, %GDP • Ecological Sustainability
• GDP/unit of energy use, 2005 PPP$/kg oil eq.
• Environmental performance index (rank, Yale University and Columbia University)
• ISO 14001 environmental certificates/bn. PPP$ GDP
• Market Sophistication
• Credit
• Ease of getting credit, distance to frontier (World Bank, Ease of Doing Business)
• Domestic credit to private sector, % GDP
• Microfinance institutions: gross loans portfolio, % GDP • Investment
• Ease of protecting investors (distance to frontier) (World Bank, Ease of Doing Business)
• Market capitalisation of listed companies, % GDP • Stocks traded, total value %GDP
• Venture capital per investment location, deals/tr. PPP$ GDP • Trade & Competition
• Tariff rate, applied, weighted mean, all products, %
• Intensity of local competition, survey (World Economic Forum)
• Business Sophistication
• Knowledge Workers
• knowledge-intensive employment, % workforce
• firms offering formal training, % firms, survey (International Finance Corporation and World Bank)
• GERD performed by business enterprise, % GDP • GERD financed by business enterprise, % GERD
• Females employed with advanced degrees, % total employed
• Innovation Linkages
• University/Industry research collaboration, survey (World Economic Forum)
• State of cluster development, survey (World Economic Forum)
• GERD financed by abroad, % GERD • JV-strategic alliance deals/tr. PPP$ GDP
• Patent families filed in 3+ offices/bn. PPP$ GDP • Knowledge Absorption
• Royalty and license fees payments, % total trade • High-tech net imports, % total trade
• Comm., computer and info. services imp., % total trade • FDI net inflows, % GDP
• Innovation Output
• Knowledge and Technology Outputs
• Knowledge Creation
• Domestic resident patent app./bn. PPP$ GDP • PCT resident patent app./bn. PPP$ GDP • Domestic res. utility model app./bn. PPP$ GDP • Scientific and technical articles/bn. PPP$ GDP
• Citable documents H index (Economy’s number of published articles that have been cited, SCImago)
• Knowledge Impact
• Growth rate of GDP PPP$/worker, %
• New business density, registrations/th. pop. 15-64 • Total Computer software spending, % GDP • ISO 9001 quality certificates issued /bn PPP$ GDP
• High and medium-high-tech manufactures, % total manufacture output
• Knowledge Diffusion
• Royalty and license fees receipts, % total trade • High-tech net exports, % total trade
• Comm., computer and info.services exports, % total trade • FDI, net outflows %GDP
• Creative Outputs
• Intangible Assets
• Domestic resident trademark app./bn PPP$ GDP • Madrid trademark app. issued/bn PPP$ GDP
• ICTs and business model creation, survey (World Economic Forum)
• ICTs and organisational model creation, survey (World Economic Forum)
• Creative Goods and Services
• Cultural and creative services exports, % total trade • National feature films/mn. pop. 15-69
• Global entertainment and media output/th. pop. 15-69 • Printing and publishing output manufactures, % of
manufactures output
• Creative goods exports, % total trade • Online Creativity
• Generic top-level domains (TLDs)/th. pop. 15-69 • Country-code TLDs/th. pop. 15-69
• Wikipedia edits/ mn. pop. 15-69 • Video uploads on Youtube/pop. 15-69
Focusing on the output indicators it is observed that overall, the most relevant measurable innovation outputs are related with Intellectual property and publications, and trade flows and productive outputs of traditionally innovative sectors. For the purpose of this thesis and the construction and development of a proposed model, we’ll be focusing on output measures of performance, as they will be relevant for the development of the proposed model.
1.5.1.2 Innovation Union Scoreboard 2015 (IUS)
The Innovation Union Scoreboard is published annually by the European Union and focuses on measuring innovation performance of the EU member states and Iceland, Norway, Switzerland, the Former Yugoslav Republic of Macedonia, Serbia and Turkey. The IUS framework establishes three main classes of innovation indicators: (1) enablers, (2) firm activities and (3) outputs.
The enablers pillar focuses on Human resources (in terms of education attainment levels), on the research systems (in terms of publications and doctorate student composition), and on Finance and support (in terms of public R&D expenditure and venture capital access). With regards to firm activities, this pillar focuses on firm investments (in R&D and innovation expenditure), linkages and entrepreneurship (in terms of SME’s innovation, collaboration and public-private co-publications), and intellectual property activities (looking at applications for patents, trademarks and design). The outputs pillar is focused on innovators (in terms of innovative SME’s and employment in fast growers of innovative sectors) and the economic effects (on knowledge-intensive activity employment, and trade, and Intellectual Property revenue).
The index represents a composite value calculated as the un-weighted average of its subordinated scores to each individual indicator. An outlier identification is first made to country scores higher than 2 times the standard deviation. The outliers are disregarded in terms of score calculation, being replaced by the non-outlier maximum or minimum. Indicators are normalized using either GDP or population numerators. With regards to missing values, the next and previous available year data are used. If no data are available, the indicator is not used to contribute to the calculation of the Index.
The index score is calculated for each year as an un-weighted average of re-scaled scores (corrected for outliers and data skewing), for all indicators at the same weight. Each country score follows the following formula:
The Innovation Union Scoreboard 2015 framework is structured as follows (European Union, 2015. p. 9):
• Summary Innovation Index (SII) • Enablers
• Human Resources
• % Population aged 25-64 having completed tertiary education • % Youth aged 20-24 having attained at least upper secondary level
education
• Open, excellent research systems
• International Scientific co-publications per million population • Scientific publications among the top 10% most cited publications
worldwide as % of total scientific publications of the country • Non-EU doctorate Students as percentage of all doctorate students
• Finance and Support
• R&D Expenditure in the public sector % GDP • Venture capital investments % GDP
• Firm Activities
• Firm Investments
• R&D expenditure in the business sector % GDP • Non-R&D innovation expenditure % turnover, survey
• Linkages & Entrepreneurship
• SME’s innovating in-house as % SMEs
• Innovative SME’s collaborating with others as % SMEs, survey • Public-private co-publications per million population
• Intellectual assets
• PCT patent applications per billion GDP (PPS€)
• PCT patent applications in societal challenges (environment-related technologies; health) per billion GDP (PPS€)
• Community trademarks per billion GDP (PPS€) • Community designs per billion GDP (PPS€) • Outputs
• Innovators
• SMEs with product or process innovations as %SMEs, survey • SMEs with marketing or organisational innovations as %SMEs,
survey
• Employment fast-growing firms of innovative sectors
• Economic effects
• Employment in knowledge-intensive activities as % total employment
• Medium & high-tech product exports as % total product exports • Knowledge-intensive services exports as % total service exports • Sales of new to market and new to firm innovations as % turnover,
survey
• Licence and patent revenues from abroad as % GDP
By focusing on the output indicators it is observed that overall, the most relevant measurable innovation outputs are related with SME’s innovative
activities, intellectual property revenue, and trade flows and productive outputs of traditionally innovative sectors.
1.5.1.3. Global Competitiveness Report (GCR)
The Global Competitiveness Report is published annually by the World Economic Forum and assesses the country performance in terms of competitiveness by evaluating the key factors that determine economic growth and prosperity. It measures 140 economies and is composed by 114 indicators, organized in three sub-indices which follow the considered three main stages of economic development: basic requirements (key for factor-driven economies and comprising institutions, infrastructure, macroeconomic environment and health and primary education), efficiency enhancers (key for efficiency-driven economies and comprising higher education and training, goods market efficiency, labour market efficiency, financial market development, technological readiness, and market size), and innovation and sophistication factors (key for innovation-driven economies, comprising business sophistication, and innovation). Depending on the stage of development of the subject economy, the sub-index is given different weight in the calculation of the overall index.
Relying heavily on survey data, the GCR has necessarily a different methodology than the other models. It is not the objective of this research to explore survey indicator usage in the construction of the proposed model, and for this reason, the methodology will not be explored in detail. The rank is obtained by calculating every indicator measurement into a 1 to 7 scale, by applying the following formulas:
The indicators are then aggregated according to each pillar and an arithmetic mean is calculated. Each aggregation level is weighted to calculate the next level score, as per defined weight, up to the top level, into a final aggregated overall country score. The countries are finally ranked according to the respective overall individual scores.
The Global Competitiveness Report 2015 framework is structured as follows (World Economic Forum, 2015. p. 39 - 40):
• Global Competitiveness Report
• Basic Requirements, (variable weight: 20 - 60%)
• Institutions, (weight 25%) (WEFORUM Executive Opinion Survey)
• Public Institutions, (75%)
• Property rights, (20%)
• (Protection of) Property rights (Survey)
• Intellectual Property protection rights (Survey)
• Ethics and Corruption, (20%)
• (Illegal) Diversion of public funds (Survey) • Public trust in politicians (Survey)
• Irregular payments and bribes (Survey) • Undue influence, 20%
• Judicial independence (Survey)
• Favouritism in decisions of government officials (Survey) • Public-sector performance, 20%
• Wastefulness of government (Survey) • Burden of government (Survey)
• Efficiency of legal framework in settling disputes (Survey) • Efficiency of legal framework in challenging regulations
(Survey)
• Transparency of government policymaking (Survey)
• Security, 20%
• Business costs of terrorism (Survey)
• Business costs of crime and violence (Survey) • Organised crime (Survey)
• Reliability of police services (Survey)
• Private Institutions, 25%
• Corporate ethics, 50%
• Ethical behaviour of firms (Survey) • Accountability, 50%
• Strength of auditing and reporting standards (Survey) • Efficacy of corporate boards (Survey)
• Strength of investor protection (Survey) • Infrastructure, (weight: 25%)
• Transport infrastructure, (50%)
• Quality of overall infrastructure (Survey) • Quality of roads (Survey)
• Quality of railroad infrastructure (Survey) • Quality of port infrastructure (Survey)
• Quality of air transport infrastructure (Survey)
• Available airline seat kilometres (International Air Transport Association)
• Electricity and telephony infrastructure, 50%
• Quality of electricity supply (Survey)
• Mobile telephone subscriptions (International Telecommunication Union)
• Fixed telephone lines (International Telecommunication Union)
• Macroeconomic environment, 25%
• Government budget balance as % of GDP
• Gross national savings as % of GDP
• Inflation (annual % change in Consumer Price Index)
• Government debt as % of GDP
• Country credit rating (Institutional Investor’s “Country Credit Ratings”)
• Health and primary education, 25%
• Health, 50%
• Business impact of malaria (Survey)
• Malaria incidence (Nr of cases per 100 000 population) • Business impact of tuberculosis (Survey)
• Tuberculosis incidence (Nr of cases per 100 000 population) • Business impact of HIV/AIDS (Survey)
• HIV prevalence (as % of 15 – 49 yr old population) • Infant mortality (0-12 months, per 1000 live births) • Life expectancy (years, World Bank)
• Primary education, 50%
• Quality of primary education (Survey)
• Net Primary education enrolment rate (UNESCO)
• Efficiency Enhancers, 35 - 50%
• Higher education and training, 17%
• Quantity of education, 33%
• Secondary education enrolment rate (gross) • Tertiary education enrolment rate (gross)
• Quality of education, 33%
• Quality of management schools (Survey) • Internet access in schools (Survey)
• On-the-job training, 33%
• Local availability of specialised research and training services (Survey)
• Extent of staff training (Survey) • Goods market efficiency, 17%
• Competition, 67%
• Domestic competition, variable %
• Intensity of local competition (Survey) • Extent of market dominance (Survey)
• Effectiveness of anti-monopoly policy (Survey) • Effect of taxation on incentives to invest (Survey)
• Total tax rate (profit tax as % of profits, labour tax as % of profits and other taxes as % of profits)
• Number of procedures required to start a business (World Bank Ease of Doing Business)
• Time required to start a business (Ease of doing Business, World Bank)
• Agricultural policy costs (Survey) • Foreign competition, variable %
• Prevalence of trade barriers (Survey)
• Trade tariffs (trade-weighted average tariff rate) • Prevalence of foreign ownership (Survey) • Business impact of rules on FDI (Survey) • Burden of customs procedures (Survey) • Imports as a percentage of GDP
• Quality of demand conditions, 33%
• Degree of customer orientation (Survey) • Buyer sophistication (Survey)
• Labour market efficiency, 17%
• Flexibility, 50%
• Cooperation in labour-employer relations (Survey) • Flexibility of wage determination (Survey)
• Hiring and firing practices (Survey)
• Redundancy costs (World Bank, Doing Business, WEFORUM)
• Effect of taxation on incentives to work (Survey)
• Efficient use of talent, 50%
• Pay and productivity (Survey)
• Reliance on professional management (Survey) • Country capacity to retain talent (Survey) • Country capacity to attract talent (Survey)
• Female participation in labour force (Ratio of woman to men in the labour force)
• Financial market development, 17%
• Efficiency, 50%
• Availability of financial services (Survey) • Affordability of financial services (Survey) • Financing through local equity market (Survey) • Ease of access to loans (Survey)
• Venture capital availability (Survey)
• Trustworthiness and confidence, 50%
• Soundness of banks (Survey)
• Regulation of securities exchanges (Survey)
• Legal rights index (degree of legal protection of borrowers and lenders rights, World Bank, Doing Business)
• Technological readiness, 17%
• Technological adoption, 50%
• Availability of latest technologies (Survey) • Firm-level technology absorption (Survey) • FDI and technology transfer (Survey)
• ICT use, 50%
• % of Internet users
• Broadband Internet subscriptions (per 100 population) • Internet bandwidth (kb/s per internet user, International
Telecommunication Union)
• Mobile broadband subscriptions (active, per 100 population)
• Market size, 17%
• Domestic market size, 75%
• Domestic market size index (Sum of GDP plus value of imports minus value of exports, normalised, WEFORUM)
• Foreign market size, 25%
• Foreign market size index (value of exports, normalised) • GDP (Purchasing Power Parity)
• Exports as % of GDP
• Innovation and sophistication factors, 5 - 30% • Business sophistication, 50%
• Local supplier quantity (Survey) • Local supplier quality (Survey) • State of cluster development (Survey) • Nature of competitive advantage (Survey) • Value chain breadth (Survey)
• Control of international distribution (Survey) • Production process sophistication (Survey)
• Willingness to delegate authority (Survey) • R&D Innovation, 50%
• Capacity for innovation (Survey)
• Quality of scientific research institutions (Survey) • Company spending on R&D (Survey)
• University-industry collaboration in R&D (Survey)
• Government procurement of advanced technology products (Survey)
• Availability of scientists and engineers (Survey)
• PCT patent applications (number of applications under the PCT, per million population)
Though broadly focused on contextual inputs, the GCR is clear to recognize Intellectual property activity as direct Innovation output indicator. This model relies heavily on survey data, obtained through its proprietary Executive Opinion Survey, carried out in 144 economies and covering the opinions of over 14000 business leaders.
1.5.1.4. COTEC Innovation Digest (COTEC ID)
The COTEC Innovation Digest is an annual publication launched in 2010, developed by COTEC Portugal - Business Association for Innovation and Everis, making use of 67 indicators organized in 10 pillars divided by 4 dimensions. The information regarding available data and the model is limited. We tried to seek further clarification from the coordinator of this project, but regretfully we had no reply, which hinders a thorough analysis of the only reference national innovation-measuring tool. The author will present the available information within the stated limitations.
The model uses 67 indicators and ranks 52 world economies. No information was found on the methodology used to calculate individual country scoring. The four dimensions focus on conditions (in terms of institutional environment and ICT level and usage), Resources (in terms of human capital, finance access and investment), Processes (in terms of Networking and entrepreneurship,
knowledge application, Technology incorporation), and results (in terms of economic impacts and innovation impacts).
The COTEC Innovation Digest 2015 framework is structured as follows (COTEC Portugal - Everis, 2015. p. 12):
• Innovation index • Conditions
• ICT infrastructure and usage
• Institutional environment • Resources • Human Capital • Finance access • Investment • Processes
• Networking and entrepreneurship
• Knowledge application
• Technological adoption
• Results
• Innovation effects
• Economic effects
Given the limitations on the available information, it is not possible to understand and identify the used indicators, and consequently better illustrate the model’s conceptual framework. However, it suggests that most relevant measurable innovation outputs are related with the pillars processes and results.
1.5.2. Measuring Quality
With regards to measuring quality, research reveals a wide gap between macro and micro-economic level. If it’s possible to identify tools for measuring quality of service, quality standards for products, or quality performance monitors for specific sectors or economic activities (education, health-care, etc.), at macro-economic level, no relevant measurement frameworks are identified, denoting a large gap and creating an opportunity to explore.
As an example, for micro-economic, sectorial level, Martínez (2010) reviews relevant models for measuring perceived service quality. Respective shortcomings are identified and a cross analysis towards identifying overlaps is produced. The author argues the need for “more creative service quality models” and suggests three alternative quantitative models, created from a formative, reflective and combined perspective, aimed at minimising the identified limitations of existing models. These alternative models are presented as overcoming problems with the empirical application of conceptual models, integrating causes and consequences of perceived quality. Also regarding service quality, the SERVQUAL model (Parasuraman et al., 1988) proposes five essential dimensions for measuring service quality: Reliability, Assurance, Tangibles, Empathy and Responsiveness.
No scoreboard or rank has been identified that evaluates and measures quality at country level, thus further justifying the need and opportunity represented by the present research.
1.5.3. Measuring Productivity
Productivity performance is traditionally well documented and of generalized knowledge at country level. It is also commonly used as the primary reference statistical data of a country’s overall performance with direct political implications and societal expected condition improvements.
Relevant for this research is the guidance the provided Manual on Measuring Productivity (OECD 2001), presenting “the theoretical foundations to productivity measurement” for measuring aggregate and industry-level productivity growth and the Compendium of Productivity Indicators (OECD 2015) presenting a “broad overview of recent and longer term trends in productivity levels and growth in OECD countries”, analysing in detail the role of productivity as “the main driver of economic growth and convergence”.
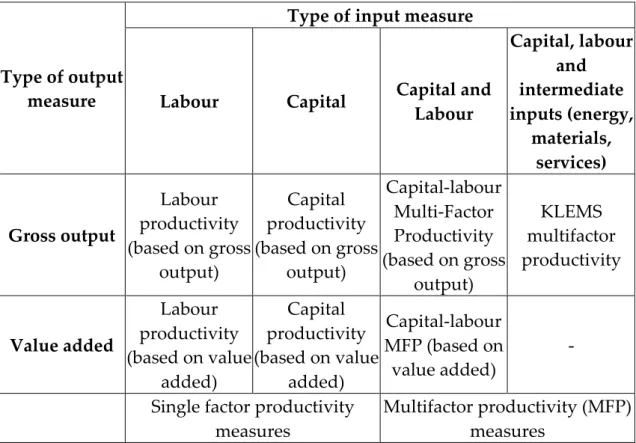
The main types of input measure defined by OECD are Labour Productivity, Capital Productivity and Capital, Labour and Intermediate inputs (KLEMS – Capital, Labour, Energy, Materials and Services). All these types of outputs are recommended to be measured at two different measurement levels: Gross output and Value added (table 1).
Type of output measure
Type of input measure
Labour Capital Capital and Labour
Capital, labour and intermediate inputs (energy, materials, services) Gross output Labour productivity (based on gross output) Capital productivity (based on gross output) Capital-labour Multi-Factor Productivity (based on gross output) KLEMS multifactor productivity Value added Labour productivity (based on value added) Capital productivity (based on value added) Capital-labour MFP (based on value added) - Single factor productivity
measures Multifactor productivity (MFP) measures
For the purposes of the proposed model, we’ll be focusing on Labour productivity, for convenience, as data is widely available as opposed to the other types of input measures. No scoreboard or rank has been identified dedicated to productivity performance at country level, thus further justifying the need and opportunity represented by the present research.
Chapter 2
Defining a new model: Global Innovation,
Quality and Productivity Index (IQP)
This chapter presents the proposed measurement tool, presenting the underlying framework and methodology.
2.1 Overview
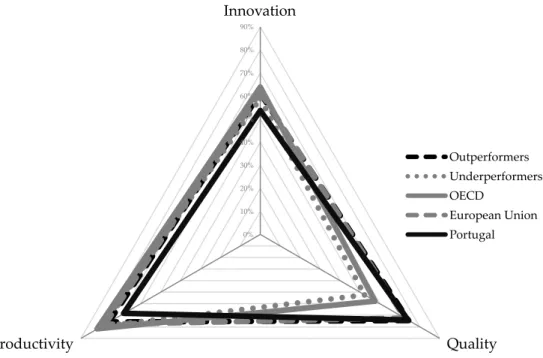
The objective of the Global Innovation, Quality and Productivity Index (IQP) that we developed in this thesis, is to conceive a performance measurement tool that permits evaluating and monitoring the performance of selected world leading economies in terms of the impact of three recognized fundamental dimensions for economic activity: Innovation, Quality and Productivity (figure 3). By aggregating and co-relating the performance between these three fundamental dimensions, the IQP model aims at presenting a richer and wider overview of an economies’ fundamental performance by presenting all in a single contextualized tool. The tool is designed for and encourages further exploration in terms of indicators used and scope and level of application.
The model allows comparison between economies and the relative performances in terms of the different dimensions. Portugal will be highlighted and we will be analyzing its relative performance in comparison to its peer countries, fellow members of European Union and Eurozone. Further to this,
we will also seek to breakdown analysis into contextual groups, to seek a better understanding of context effects in performance.
2.2. Conceptual measurement framework
The model is applied to 43 economies, representing about 80% of the world’s GDP (in current US$). Different measures are calculated: The Global IQP Index, the IQP Sub-indices and the IQP Growth, building in a total of 11 output indicators. For the purpose of this thesis, we’ll only be focusing on the impact of performance, and thus the model will be calculated based on output indicators. The Global IQP Index is the simple average calculation of all Sub-index scores, measuring the overall contextual performance of any given economy within the selected peers. The index is focused on output measurement, by looking at the impacts introduced by Innovation, Quality and Productivity performance.
The Innovation output sub-index measures the nation’s contextual performance score in terms of innovation output effects in the economy and society. The Quality output sub-index measures the nation’s contextual performance score in terms of output effects in the economic activities. The Productivity output sub-index measures the nation’s contextual performance score in terms of output effects in economy and in society.
nations’ individual progress performance for the given dimension.
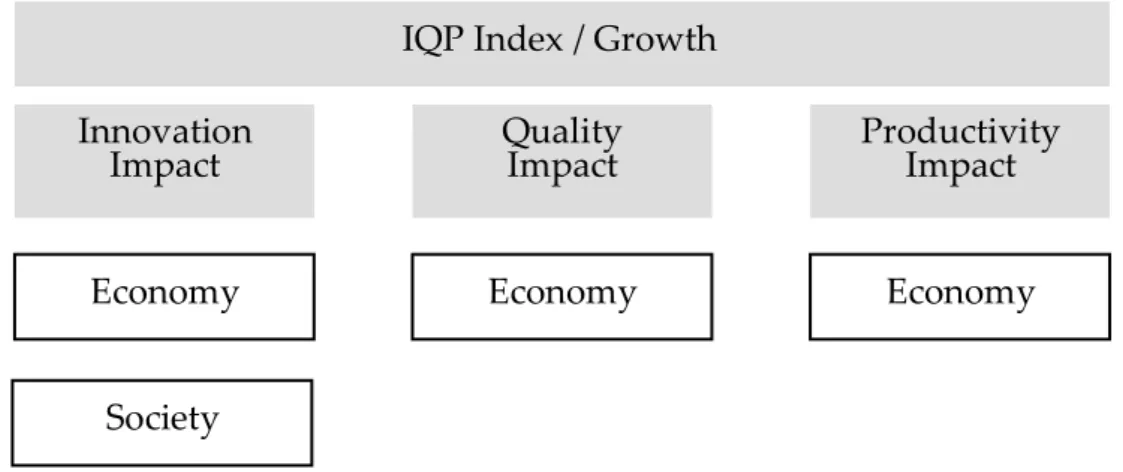
IQP Sub-indexes measure the nation’s score in terms of Innovation, Quality and Productivity performance, based on a lower breakdown of output pillars for each dimension (figure 4).
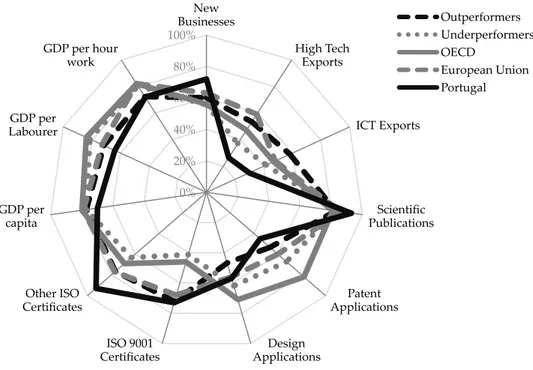
Innovation Impact sub-index observes two main pillars of innovation output: Economic and Social. These have been identified by research (from the reviewed existent models) as the most relevant aspects of Innovation output. The indicators used are based on the methodology used by existing measuring tools, having been adjusted to this model. New businesses are considered a clear indication of active business environments (appendix, table 11), capturing and leveraging innovation. High-technology (appendix, table 12) and ICT exports (appendix, table 13) are also a quantifiable output of highly innovative activities, considered directly related to the level of innovation performance of the economy.
Scientific publications are the immediate academic product of innovative environments and a strong indicator of innovative culture (appendix, table 8). Patents (Appendix, table 9) and Industrial Design (Appendix, table 10) applications are also associated with active and innovative business environments, thus its relevance and choice to use.
Figure 4: The IQP Index/Growth Framework
IQP Index / Growth Innovation
Impact Economy
Quality
Impact Productivity Impact
Society
The Quality Impact sub-index only focuses on economic output. Following the research carried out which revealed existing limitations in terms of quality measurement at macro-level, the author decided to use the only available and applicable known data that could inform of a country’s performance in this matter, the International Standard Organization’s (ISO) Certificates. Following the definition of conformance to specification, the ISO provides the best, globally used and recognized institution, thus providing a reliable source of data at macro-economic level. It was chosen to use the number of ISO9001 (Quality Management Systems) certifications for being the most recognizable and widely adopted standard for quality management and thus considered to contain a direct relation to a given economy’s commitment to quality (Appendix, table 14). ISO9001 is considered the reference standard in terms of quality and for this reason is considered individually. However, additional data on ISO certifications is available and it has been decided to include as a composite indicator for the aggregated number of remaining certifications (not ISO9001 – Appendix, tables 15 to 19), to allow for score robustness. It is a recognized limitation of the current model and additional indicators are encouraged for use in future developments of the IQPi. The common economic denominator used for quality establishes an economic co-relation to the indicator.
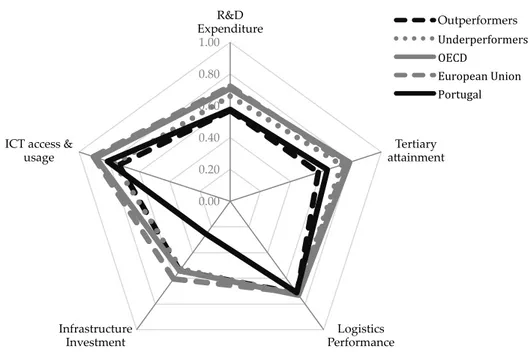
The Productivity sub-index observes only Economic impact of productivity, recognized as most relevant for the purposes of this model. To enrich the analysis and better illustrate the wider impact of productivity, the numerator varies to measure different aspects of productivity ratios that accommodate social aspects: population (Appendix, Table 20), labour force (appendix, table 21) and actual work hours (appendix, table 22). As a result, our Global IQP index disaggregates in the following indicators and sub-indicators
44
• Innovation Impact (33%)
• Economy (50%)
• New businesses per billion $ PPP GDP (33%)
• High technology exports per billion $ PPP GDP (33%) • ICT goods exports per billion $ PPP GDP (33%)
• Society (50%)
• Scientific publications per billion $ PPP GDP (33%) • Patent applications (total) per billion $ PPP GDP (33%)
• Design Utility applications (total) per billion $ PPP GDP (33%) • Quality Impact (33%)
• Economy
• ISO9001 certificates per billion $ PPP GDP (50%) • Other ISO certificates per billion $ PPP GDP (50%) • Productivity Impact (33%)
• Economy
• GDP, PPP current US$ per Capita (33%) • GDP, PPP current US$ per Labour force (33%)
• GDP, PPP current US$ per actual Work hours Labour force (33%)
2.2.1 Data Sources
The model makes use of internationally recognized sources of information, namely the World Intellectual Property Organization (WIPO), International Labour Organization (ILO) and the International Standards Organization (ISO). For global data, the data is combined as necessary from the United Nations (UNSTAT), Organization for Economic Cooperation and Development (OECD), World Bank (WB) and European Statistics (Eurostat). Table 2 presents the detailed information on the sources of data for each indicator.
IQP – Data Sources
Indicator Numerator Denominator Year
1.1.1 World Bank World Bank 2004, 2009, 2014
1.1.2 UNCOMTRADE UNCOMTRADE 2004, 2009, 2014
1.1.3 UNCTAD UNCTAD 2004, 2009, 2014
1.2.1 SCIMAGO World Bank 2004, 2009, 2014
1.2.2 WIPO World Bank 2004, 2009, 2014
1.2.3 WIPO World Bank 2004, 2009, 2014
2.2 ISO World Bank 2004, 2009, 2014
3.1 World Bank UNSTAT 2004, 2009, 2014
3.2 World Bank ILO 2004, 2009, 2014
3.3 World Bank ILO 2004, 2009, 2014
2.2.2 Data Scope
The range of countries considered was dictated by data availability and practicality, and for this reason, a selection of 43 countries was made as base set, representing circa 80% of the worlds’ economy. This was considered to be sufficiently representative for the purpose of this research, though application to a wider range of countries is expected and supported. It was observed by researchers that the availability of statistical data reduces significantly for non-OECD members. For this reason it was decided to limit the country scope to OECD member countries and European members. Due to the global relevance of China and generally good data availability it has also been included. The following table 3 lists all the selected countries.
IQP – Countries
OECD European Union Euro Zone
Austria O EU € Belgium O EU € Cyprus EU € Estonia O EU € Finland O EU € France O EU € Germany O EU € Greece O EU € Ireland O EU € Italy O EU € Lithuania EU € Luxembourg O EU € Malta EU € Netherlands O EU € Portugal O EU €
Slovenia O EU € Spain O EU € Bulgaria EU Croatia EU Czech Republic O EU Denmark O EU Hungary O EU Poland O EU Romania EU Sweden O EU United Kingdom O EU Australia O Canada O Chile O Iceland O Israel O Japan O Republic of Korea O Mexico O New Zealand O Norway O Switzerland O Turkey O Russia O China
The index will be applied to a 10-year time frame, allowing trend observation and overall evolution. The chosen reference years are 2004, 2009 and 2014. 2014 was chosen as the last year due to convenience related to data availability, as most data have not yet been published for 2015. The 5-year gap between measurements is considered for this model as sufficient timeframe to illustrate performance evolution at macro-level.
2.2.3. Methodology
The IQP-index represents an overall composite indicator, obtained from the mean value of scores of the subsequent score.
For each indicator, outlier identification is carried out. The outlier identification process consists of testing the value against its distance to the mean value of the sample. If the distance to the mean is greater than 2 standard deviations, then the measure is considered an outlier. Outlier identification is important to prevent data distortions to average performers and also to identify outstanding results.
For data that is found to have very volatile values, showing low performance for most countries and very high levels for a few others, a square root transformation is applied for normalization.
The next step is to determine the maximum measurement within the sample. For maximum definition, the outliers are not considered, and thus the maximum will attain a relative score of 1. This will give an outlier a >1 score, however it will prevent every other performers to be inadequately positioned.
To compute each indicator score, the following formula is applied:
To obtain the sub-indicator overall score, the un-weighted average score is calculated of all the indicator scores composing the sub-indicator.
Any missing value does not contribute to the calculation of the average score, and thus it is not accounted for. This is a recognized limitation of the model and has been controlled through careful data selection, only happening in Design Applications for Belgium, Luxembourg and Netherlands, and New Business registrations for United States and China, where no data were available. Being only one indicator out of 6, it was considered acceptable for the purpose of this work.
The IQP Growth ratio measures the average annual growth rate of the IQP Index, permitting observation of the country’s individual performance progress, denoting the impact of its efforts.
Benchmarking is obtained by simple ranking of the obtained sub-index scores.
Lastly, to seek a better understanding of what factors influence performance we’ll be segmenting the economies in terms of global index and growth score performance, classifying them in two classes:
Outperformers: High Performance & High Growth Underperformers: Low Performance & Low Growth
Highs are scores above mean values, whilst lows are scores bellow mean values.
Chapter 3
Model application: IQP Index 2014
This chapter presents the proposed measurement tool applied to real world data.
3.1 Overview
The IQP Index ranks the individual performance of the selected economies. The performance represents a composite indicator calculated from 11 individual indicators that support the three main dimensions: Innovation, Quality and Productivity. The IQP Growth ratio complements the Index by evaluating individual performance growth, allowing a second level of observation by identifying which economies reveal a higher degree of evolution and attributing a quality dimension to the performance. The model will be applied to three time periods: 2004, 2009 and 2014. For 2014 Index score calculation, only data from 2014 is used. For the IQP 2014 growth ratio, it is important to understand in relation to the overall score, what level of improvement has the economy demonstrated for the last 10 years, so ratio is obtained by calculation of all scores of 2014 in relation to 2004.
The following figure (5) presents the IQP Index score results of all economies, with the IQP growth ratio juxtaposed. Full Index scores for all years can be observed on appendix (tables 5, 6 and 7).
The index ranking is clearly led by Switzerland, which is consistent with scores obtained on the previously reviewed measuring tools (see chapter one). Italy, Israel, Korea and Czech Republic follow, all scored above 0,75. Russia presents the weaker score, followed by Mexico, Chile, Turkey, Cyprus and Poland, all scoring bellow 0,60. The Eurozone and European Union are
-0.20 0.00 0.20 0.40 0.60 0.80 1.00 1.20 Russia Mexico Chile Turkey Cyprus Poland Lithuania Greece Latvia Iceland Croatia Portugal New Zealand Spain Canada Bulgaria Denmark Finland France Japan United States Romania OECD China Belgium Luxembourg Hungary Slovenia United Kingdom Ireland Netherlands Germany Austria Sweden Norway European Union Estonia Slovakia Eurozone Malta Australia Czech Republic Korea Israel Italy Swierland
IQP Index IQP Growth ratio
positively positioned above mean value. Portugal falls slightly bellow average in terms of Index, with a higher than average Growth performance, revealing recent improvements and suggesting positive outlook on performance growth.
It is also of note that the top 10 weaker index performers present a mean Growth rate that is 100% greater than the mean Growth rate of the top 10 index performers, indicating greater progress potential for the weaker index performers and a slower growth for the top index performers, suggesting a plateauing performance.
-0.15 -0.10 -0.05 0.00 0.05 0.10 0.15 0.20 0.25 0.30 0.35 0.40
Hungary United Kingdom New Zealand Japan Slovenia Ireland Cyprus Sweden Israel United States Spain Finland Swierland OECD Canada Austria Belgium Australia European Union Czech Republic Korea Malta France Mexico Eurozone Germany Norway Denmark Netherlands Estonia Iceland Poland Luxembourg Turkey Portugal Croatia Greece Italy Slovakia China Russia Bulgaria Chile Latvia Romania Lithuania
In terms of IPQ Growth ratio (figure 6), Lithuania presents the higher score, representing a 36% rate, far from the average 10% rate for the sample, suggesting a strong outlook on future improvement. European Union, Eurozone and OECD present weaker Growth scores, suggesting some maturity in terms of performance evolution. Seven economies present negative scores for Growth: Cyprus, Ireland, Slovenia, Japan, New Zealand, United Kingdom and Hungary, with Hungary presenting the weakest score of -0,10 which reveal their internal performance is being outperformed by their peers.
(Please see annexed tables for full calculation tables and results)
3.2 Dimensional Performance
In terms of Innovation (Figure 6), Korea (0,94) and China (0,89) are clear leaders with distant scores over 10 points from the next performer, Israel (0,72) However, only China presents a positive growth rate, contrary to the average growth of -0,08. OECD is performing above average level while EU and the Eurozone are aligned with the mean value for performance. From the top 10 overall index performers, Switzerland, Israel, Korea and Czech Republic are among the most 10 innovative economies. Portugal takes 10th position in the 10 weaker economies in terms of innovation outputs, with a score below average. Its null growth rate does not suggest any trend, revealing some resistance to the tendency, or internal improvement being annulled by global factors. Luxembourg is the country that presents the smaller innovation score, believed to relate with data problems.
From all countries, Latvia presents the stronger positive growth rate (0,19) and Malta the stronger negative growth rate (-0,29). Significantly negative strong Growth ratio score is also identified for Hungary (-0,23), Finland (-0,23), Ireland (-0,22) and Japan (-0,19). The average Growth ratio negative score of -0,8 reveals a macro trend of decrease in Innovation output by the represented
economies. This trend suggests a possible alteration in the effectiveness of innovation inputs at macro-economic level Individual Innovation indicator scores for all years can be observed on appendix (tables 8, 9, 10, 11, 12 and 13).
-0.40 -0.20 0.00 0.20 0.40 0.60 0.80 1.00 1.20 Luxembourg Greece Russia Turkey Spain Italy Chile Cyprus Romania Portugal Poland Lithuania Norway Bulgaria Croatia Finland Iceland Denmark Austria Mexico Canada France Slovenia Eurozone European Union Netherlands Germany United States Latvia Ireland Australia United Kingdom OECD Sweden Hungary Slovakia Japan Belgium Swierland New Zealand Czech Republic Estonia Malta Israel China Korea
Quality (figure 8) is lead by Italy (an outlier), with an outstanding score of 1,041 and a very strong growth ratio score, suggesting evolution continuity.
Secondly positioned, Romania, with 0,91 presents an even stronger ratio score, suggesting strong growth outlook. Italy is also, on par with Czech
-0.40 -0.20 0.00 0.20 0.40 0.60 0.80 1.00 1.20 1.40 1.60 1.80 Russia
United States Mexico Luxembourg New Zealand Chile Canada Norway Turkey Iceland Cyprus Denmark Belgium Ireland Japan Korea Poland OECD France Austria Netherlands Finland Lithuania Germany Sweden United Kingdom Australia Latvia Greece China Spain European Union Eurozone Portugal Swierland Estonia Slovenia Malta Hungary Croatia Israel Slovakia Bulgaria Czech Republic Romania Italy
Quality Growth