ASSOCIAÇÃO DE POLITÉCNICOS DO NORTE (APNOR)
INSTITUTO POLITÉCNICO DE BRAGANÇA
DOING BUSINESS AND COMPETITIVENESS ENVIRONMENT TO
EVALUATE COUNTRIES FOR OPERATIONS IN THE INFORMATION
AND COMMUNICATION TECHNOLOGIES
Vahan Vahanyan
Final Dissertation submitted to
Instituto Politécnico de Bragança
to obtain the Master Degree in Management, Specialisation in Business Management
ASSOCIAÇÃO DE POLITÉCNICOS DO NORTE (APNOR)
INSTITUTO POLITÉCNICO DE BRAGANÇA
DOING BUSINESS AND COMPETITIVENESS ENVIRONMENT TO
EVALUATE COUNTRIES FOR OPERATIONS IN THE INFORMATION
AND COMMUNICATION TECHNOLOGIES
Vahan Vahanyan
Supervisors:
Alcina Maria de Almeida Rodrigues Nunes
Arevshatyan Gevorg
Abstract
Information and Communication Technologies (ICT) are a fundamental part of a good business environment. In the past year Doing Business recorded 50 reforms establishing or improving online tools for regulatory processes (World Bank, 2016). Authors like Jerbashian and Kochanova (2016), for example, use Doing Business indicators to discover and examine how country-level regulations of business impact industry-level investments in ICT. Having as the main objective to understand how the business environment and competitiveness of an economy allows the introduction of companies in the ICT sector, it is proposed to develop a scientific work which implements business environmental scanning that allows strategic planning of activities based on analysis and comparison of broad indicators of opportunities and efficiency for various countries Environmental scanning is a process that systematically surveys and interprets relevant data to identify external opportunities and threats. An organization gathers information about the external world, its competitors and itself. The company should then respond to the information gathered by changing its strategies and plans when the need arises. For implementing an environmental scanning three well-known and worldwide databases are used: the Doing Business project, the Global Competitiveness Index and the ICT Development Index were used. Methodology allows to evaluate countries and compare them with each other in terms of investment attractiveness in the ICT sector. Results present a list of 40 countries that rank best among others regarding their business climate, competitiveness and operations of economic agents in the ICT sector as well as its sub-sectors: R&D, Production, and Services.
Resumo
s Tecnologias de Informação e Comunicação (TIC) são uma parte fundamental de um bom ambiente empresarial. Por exemplo, só no ano passado, o relatório do Doing Business registrou 50 reformas, que estabeleciam ou melhoravam as ferramentas online utilizadas en processos regulatórios (Banco Mundial, 2016). Autores como Jerbashian e Kochanova (2016), por exemplo, utilizam os indicadores do
Doing Business para descobrir e analisar a forma como as regulamentações empresariais numa economia afetam os investimentos no setor das TIC. Tendo como objetivo principal compreender como o enquadramento empresarial e a competitividade de uma economia permitem a introdução de empresas no setor das TIC, propõe-se desenvolver um trabalho científico que implemente um processo de scanning empresarial que permita realizar um planeamento estratégico das atividades com base na análise e comparação de indicadores amplos de oportunidades e risco para os diversos países. O processo de scanning empresarial analisa, sistematicamente, e interpreta os dados relevantes para identificar oportunidades e ameaças externas. Neste processo uma empresa/organização reúne informações sobre o mundo externo, os seus potenciais concorrentes e sobre si própria . A empresa/organização deve responder às informações recolhidas alterando as suas estratégias e planos quando necessário. Para a implementação deste procedimento de análise foram utilizadas três bases de dados bem conhecidas internacionalmente: o projeto Doing Business, o Global Competitiveness Index e o ICT Development Index. A metodologia permite avaliar países e compará-los uns com os outros em termos de atratividade de investimento no setor das TIC. Os resultados permitem apresentar uma lista de 40 países que se classificam melhor em relação ao ambiente de negócios, competitividade e operações de agentes económicos no setor das TIC, bem como nos seus subsectores: I&D, Produção e Serviços.
Համառոտագիր
Ինֆորմացիոն և տեղեկատվական տեխնոլոգիաները կազմում են բիզնես կարգավորումների
բաղկացուցիչ մաս: Միայն վերջին տարում Դուինգ Բիզնեսը հրապարակել է կանոնակարգման
գործընթացների հաստատման կամ բարելավման օնլայն գործիքների մասին 50 բարեփոխումներ
(Համաշխարհային բանկի խումբ, 2016): Օրինակ Հեղինակներ Ջրբաշյանը և Քոչանովան (2016),
օգտագործումեն ԴուինգԲիզնեսիցուցանիշները բացահայտելու ևուսումասիրելու, թեինչպեսեն
տարբերերկրներումբիզնեսիկարգավորումներըազդեցությունունենումՏՀՏներդրումներիվրա:
Սույն աշխատանքի հիմնական նպատակն է հասկանալ, թե տնտեսության բիզնեսը և
մրցունակությունըթույլէտալիսնմանՏՀՏիներմուծումը, առաջարկումենք զարգացնելգիտական
աշխատություն, որը կիրականցանի բիզնեսի տեսանկյունից շրջակա միջավայրի
ուսումնասիրությունռազմավարական կառավարման մեթոդներովևհամեմատել երկրները ավելի
լայնհնարավորություններիցուցանիշներովևռիսկերով: Շրջակամիջավայրիուսումնասիրությունը
գործնթաց է, որը պարբերաբար հետազոտում և ամփոփում է համապատասխան տվյալները,
որպեսզի հայտնաբերվեն արտաքին հնարավորությունները և վտանգները (Դանիելս, Ռադեբու և
Սուլլիվան,2015). Կազմակերպությունը հավաքագրում է տեղեկություն արտաքին աշխարհի,
մրցակիցների ևինքն իր մասին: Այնուհետև ընկերությունը պետք է համարժեքորեն պատրաստի
տեղեկությւոնը, որը հավաքագրվելէ ստրատեգիաներիևծրագրերիփոփոխման արդյունքում, երբ
առաջանումէփոփոխություններիանհրաժեշտությունը (Լապին, 2014):
Շրջակա միջավայրի ուսումնասիրության համար օգտագործվում է 3 հայտնի տվյալների բազա.
«Դուինգ բիզնես» նախագիծ, «Գլոբալ մրցունակության» ինդեքս և «ՏՀՏ զարգացման» ինդեքս:
Մեթոդաբանությունըթույլէտալիսգնահատելերկրներինևհամեմատելմիմյանցհետներդրումային
գրավչության առումով: Արդյունքները ներկայացնում են ցանկ՝ բաղկացած 40 երկրներից, որոնք
ունենլավագույնվարկանիշներըըստիրենցգործարարմիջավայրի, մրցունակությանևՏՀՏոլորտում
տնտեսվարող սուբյեկտների գործառնությամբ, ինչպես նաև ենթաոլորտներում՝
Acknowledgements
I would like to express with pleasure my gratitude, thanks and great appreciation.
Firstly, to my thesis supervisor Alcina Maria de Almeida Rodrigues Nunes, to whom I grateful for sincere guidance, suggestions with kindness and strength given to me to complete my thesis.
To my supervisor from Armenia Gevorg Arevshatyan.
To all my professors at Instituto Politécnico de Bragança: Paula Odete Fernandes, José Carlos Lopes, Ana Paula Carvalho do Monte, Maria Eunice Santos, Ana Sofia Cardim Barata.
My professors in Armenia, especially to Arto Tadevosyan and Arusyak Abrahamyan.
To my friends, who dependably have confidence in me, give me strength and do not disturb me. Especial thanks to IPB and its staff for a good organization of our work and life.
Especial thanks to Bragança: small, clean and tidy city that I loved.
Especial thanks to Portugal. It is a beautiful country with hospitable and friendly people. Finally, I express my hearty gratitude to my family whose love and advice are always with me.
This work would not have been possible without The Education, Audiovisual and Culture Executive Agency (EACEA) with its program “Erasmus Plus – International Credit Mobility”
Abbreviations and/or Acronyms
ADDING - Adding volume, Decreasing costs, Differentiating benefits, Improving industry attractiveness, Normalizing risk, Generating and deploying knowledge.
DTF - Distance to Frontier GDP - Gross Domestic Product GCI - Global Competitiveness Index
ICT - Information and Communication Technologies IDI – ICT Development Index
ITU - International Telecommunication Union FDI-Foreign Direct Investment
PFI - Policy Framework for Investment
PESTEL - Political environment, Economic environment, Sociocultural environment, Technological environment, Ecological environment, Legal environment
PCT - Patent Cooperation Treaty
Table of Contents
List of Figures ... viii
List of Tables ... ix
Introduction ... 1
1. Business environment for investments: how to choose an international location ... 3
1.1. Institutional framework for business investment ... 3
1.2. Countries’ business risk assessment ... 4
1.2.1. The particular case of doing business in ICT ... 5
1.3. The international projects for assess countries’ business environment ... 7
1.3.1. Doing business ... 8
1.3.2. Global Competitiveness Index ... 9
1.3.3. International Telecommunication Union ... 10
1.4. Environmental scanning process ... 11
2. Research methodology ... 13
2.1. Objective of the study ... 13
2.2. Description of data collection ... 13
2.2.1 Data collection for country comparison in ICT sector ... 14
2.3. Scanning analysis ... 17
3. Presentation and analysis of results ... 19
3.1. Country’s selection for the scanning analysis ... 19
List of Figures
List of Tables
Introduction
In the 21st century it is more than evident that companies have to use Information and Communication Technologies (ICT) to survive in the highly competitive business markets. As globalisation is increasing in the world economy, time and space are changing the values of companies. So increasing the role of ICT in further business investments – which allows a higher development of the countries’ economies - depends on the level of investment in ICT infrastructures, the level of innovation put in practice, and also the level of research and development carried out by firms.
The countries present high differences in their levels of development and the business environment they present to potential investors. So, investors (managers already working or new business owners) in order to make an investment decision have to decide between “easy money with high risks” and lower competitiveness in developing countries and make investments in developed countries with higher competitiveness but lower risk. At the same time, potential new investors, venture companies and other interested parties tend to invest in ICT activities. But, to choose where to invest, it is necessary to take into account certain factors. There are more than 200 different countries in the world, which make it hard to choose which is the more attractive country for a particular business investment. In this work the particular business investment will consider the ICT business activity area.
Having as the main objective to understand how the business environment and competitiveness of an economy allows the introduction of companies in the ICT sector, it is proposed to develop a scientific work which implements business environmental scanning that allows strategic planning of activities based on analysis and comparison of broad indicators of opportunities and efficiency for various countries. Environmental scanning is a process that systematically surveys and interprets relevant data to identify external opportunities and threats (Daniels, Radebaugh, & Sullivan, 2015). An organization gathers information about the external world, its competitors and itself. The company should then respond to the information gathered by changing its strategies and plans when the need arises (Lapin, 2004). Indeed, the main objective of this study is to evaluate countries using a ranking system and to create a list of the top 40 most attractive countries in terms of investments in the ICT sector.
and others interested in the business climate of each economy. At the same time, the Global Competitiveness Index (GCI) measures “the set of institutions, factors and policies that set the sustainable current and medium-term levels of economic prosperity” in other words, those factors that facilitate or drive productivity (Gaportal, 2016). The index is composed of 12 pillars of competitiveness - organized into efficiency enhancers, innovation and sophistication factors - and attempts to take into account countries' different stages of economic development. Finally, the ICT Development Index is an Index specifically prepared to analyse the ICT sector in each economy.
1. Business environment for investments: how to choose an
international location
1.1. Institutional framework for business investment
In order to implement business investments in other countries both small and medium size companies as well as multinational companies must have reliable information about environment of the potential location countries. Some of the significant sources of information regarding the institutional framework for business investment of the abovementioned companies are the following projects: The Doing Business project with its indicators and the Global Competitiveness Index. If the companies operate in
the Information Communication Technology (ICT) sector another source of information are the
International Telecommunication Union's reports.
Every country has to have a Policy Framework for Investment (PFI) that could mobilise private investment that supports steady economic growth and sustainable development, contributing to the economic and social well-being of the population. Such framework should include all forms of investment and types of firms (OECD, 2015). According to the Organization for Economic Cooperation and Development (OECD), a good investment climate is one which provides opportunities for all investors (both public and private, large and small and foreign and domestic) and follows coherent public policies. Such policy coherence applies to each component of the investment climate, whether encouraging foreign investment, promoting linkages and technology spill overs raising the quality of the workforce or improving infrastructure or any other area (OECD, 2015).
term ‘PESTEL’ comes from the names of the six main environmental spheres of the company and its competitive arenas: political environment, economic environment, socio-cultural environment, technological environment, ecological environment, legal environment( Grünig & Morschett, 2011).The selection of target markets is an important and at the same time difficult task: (i) It is important because the success or failure of going international for new markets strongly depends on it. The best strategy for building up new markets and the best market entry project plans are useless if the wrong markets are targeted; (ii) The task is difficult, because many industry markets in many countries often come into consideration, and because the selection is based on numerous and partially qualitative criteria. The PESTEL analysis is a grid which can be used to structure the country analysis. Important individual aspects can be analysed with macroeconomic indicators, approaches for assessing political risks and methods for evaluating cultural distances (Grünig & Morschett, 2011).
The precise economic, social, technological, legal and institutional framework for any given investment depends highly on the facts and circumstances related with that particular investment (Al Khattab, Aldehayyat & Stein, 2010).For example, regulatory and institutional risks may vary depending on whether a transaction is an acquisition by merger, an acquisition of assets, a greenfield1investmentor an
acquisition of a majority/minority of shares. Fagan (2010), using the particular example of the United States economy, describes other factors that may impact the legal risk and strategy for market entry which include: (i) the location of the investment; (ii) the sector or industry of the investment; (iii) the size of the investment; (iv) the specific facts of a particular transaction and (v) the characteristics of the transaction parties.
The Risk management protects and adds value to an organisation and its stakeholders through supporting the organisation’s objectives by: (i) providing a framework that enables future activity to take place in a consistent and controlled manner; (ii) improving decision making, planning and prioritisation by understanding the business activity, volatility and project opportunity/threat; (iii)contributing to more efficient use/allocation of capital and resources within the organisation; (iv) reducing volatility in the business’ non-essential areas; (v) protecting and enhancing assets and company image; (vi) developing and supporting people and the organisation’s knowledge base; and (vii) optimising operational efficiency (IRM, 2002).
costs(Al Khattab, et al, 2010, p. 54). For international investors country risk assessment is an essential factor in the investment process. Country risk is the potential volatility and default in financial assets due to political and/or financial events in the given country. So, understanding the relations between international stock markets and how these linkages vary through time is of great importance for country risk diversification (Marshall, Maulana & Tang, 2009). Al Khattab, et al (2010, p. 55) by examining sources of information that are used for a country’s (business) risk assessment, divide it into two main objectives: (1) to analyse current managerial practices in multinational corporations with regard to the sources of information used for country risk assessment and (2) to explore the correlations between the sources of information used and corporation-specific characteristics of the organisations surveyed. Markides and Williamson (1994) had previously warned that diversification into new markets could bring with it the risk that an organisation loses focus and weakens its core competencies and, in consequence, the organisations’ overall profitability. Only through strategic diversification, by which the company ensures that there is a strong strategic fit and leverage of its core competencies, that an extension of the activities may improve profitability. According with the authors, strategic diversification should imply a synergy with the new business that reinforces the core competencies of the company, i.e., knowledge and expertise.
1.2.1. The particular case of doing business in ICT
As ICT have become one of the main driving forces of globalization, they have been also increasingly perceived as a major factor determining the comparative advantage of nations and the competitiveness of their economies due to its potential to generate socio-economic transformations (Baskaran & Muchie, 2007). The authors argue that ICT provide a key opportunity for particularly developing countries to address problems in the field of education, health, rural development, poverty alleviation and employment.
(SME) from the perspective of ICT competencies and web presentations and found that some companies had developed significantly more ICT competencies than others and these competencies help them to be more successful and competitive.
The information and communications technology sector had been a pioneer and a powerful promoter in addressing the needs and interests of low-income communities in developing countries and for small and medium size firms, as mentioned before. But it was not always so. In the last decade of the twenty century and the first decade of the XXI century there was a self-conscious appreciation for the ICT sector’s role in expanding economic opportunities (Kramer, Jenkins & Katz, 2007).
A number of factors distinguish the ICT sector in its potential to expand economic opportunity. First, its products and services enable individuals, firms, governments and other players to expand their economic opportunities as well as create such opportunities for others. Second, ICT companies know well that this dynamic is not automatic, but rather depends on a wide range of other factors and players. This interdependence has led them to take network or ecosystem strategies which often create large numbers of business opportunities for other smaller firms. Third, finally, underlying these ecosystem strategies are a fundamental collaborative capability and culture. Many firms have already begun to experiment ways of deliberately leveraging these attributes to expand economic opportunity. Others are beginning to think about the process.
capabilities – using them in other contexts, with other types of collaborators – and to expand economic opportunity more widely in developing countries.
Acknowledging that ICT has become the foundation of every sector of every economy and the incredible diversity in the nature and size of firms in the ICT industry the present research study will focus on such firms – whether national, regional, or multinational.
1.3. The international projects for assess countries’ business environment
Ghemawat (2007) vehemently argued that the world is not flat and showed how doing business in a foreign country is “confined” by cultural, administrative, geographic and economic conditions specific to the country. These differences may create opportunities but also increase the cost and risk of doing business in a foreign country by challenging the underlying business model. If the prevailing conditions discriminate against foreign firms they can constitute a real “liability of foreignness” which puts the firm at a competitive disadvantage vis-à-vis local firms (Zaheer, 1995).
So, in order to attract international investment every country wants to be assessed as a business attractive country. The attractiveness of a foreign country should fit the consistency of the foreign operations with the chosen strategic positioning and underlying activity system. From there, strategists should actively explore if a foreign expansion generates other advantages like the ones generated by differences in skills across countries or from buying services in several countries from the same supplier. As a result, the firm may gain from a more effective supply system and improved bargaining power. The spreading of activities across countries and its concentration in the best regions may generate benefits that clearly allow the firm to optimize the efficiency of its activities. This may happen, for instance, by concentrating activities in particular countries and exploiting economies of scale and scope, including the sharing of critical assets related to technology or marketing.
A useful tool to consider the various strategic benefits from internationalization in line with Porter’s approach (Porter, 1996) is the “ADDING Value Scorecard,” proposed by Ghemawat (2007). The acronym “ADDING“ stands for the extra value created through: adding volume, decreasing costs, differentiating benefits, improving industry attractiveness, normalizing risk, generating and deploying knowledge. Depending on the firm’s strategy and trade-offs made, some elements will receive more weight. A country is attractive if it offers macro- or industry-specific conditions that are driving factors for the generation of these benefits (Porter, 1996). But there are other tools that can be useful (and are being used every day by firms that which to operate internationally) to assess a country’s business environment. Such tools will be present in the following subsections.
1.3.1. Doing business
T To measure the environment in which businesses operate in countries across the world is the World Bank’s Doing Business project, which was launched in 2002. At its core, this project gathers quantitative data to compare regulations faced by small and medium-size enterprises across economies and over time. The central piece of the project is the annual Doing Business report that was first published in 2003 with five sets of indicators for 133 economies. Currently includes 11 sets of indicators for 190 economies. The report includes a table that ranks each country in the world according to its scores across the indicators (Besley, 2015).
The economic activity requires sensible rules that encourage firm start-up and growth and avoid creating distortions in the marketplace. Doing Business focuses on the rules and regulations that can help the private sector. The project measures the presence of rules that establish and clarify property rights, minimize the cost of resolving disputes, increase the predictability of economic interactions and provide contractual partners with core protections against abuse The Doing Business data highlight the important role of the government and government policies in the day-to-day life of domestic small and medium-size firms. The objective is to encourage regulations that are designed to be efficient, accessible to all who use them and simple in their implementation. Where regulation is burdensome, it diverts the energies of entrepreneurs away from developing their businesses. But when regulation is efficient, transparent and implemented in a simple way, it becomes easier for businesses to innovate and expand. Indeed, Doing Business values good rules as a key to social inclusion.
To collect data, the project uses about 10,000 questionnaires with 11 topics that are answered in all engaged countries (Besley, 2015). Those topics are: (1) starting a business for measuring the procedures, time, cost, and minimum capital required to start a new business, (2) dealing with construction permits for measuring the procedures, time and cost required to build a warehouse, (3) getting electricity to measure the procedures, time, and cost required for a business to obtain a permanent electricity connection for a newly constructed warehouse, (4) registering property to measure the procedures, time and cost required to register commercial real estate, (5) getting credit to assess the strength of the legal rights, (6) protecting investors which measures the extent of disclosure and director liability and the ease of shareholder lawsuits, (7) paying taxes that measures the number of taxes paid, hours per year spent preparing tax returns and the total tax payable as a share of gross profit, (8) trading across borders that measures the number of documents, cost, and time required to export and import goods, (9) enforcing contracts that measures the procedures, time, and cost required to enforce a debt contract, (10) resolving insolvency to measure time, cost and percentage recovery rate involved with bankruptcy proceedings and, (11) employing workers which measure the ease with which workers can be hired or made redundant and the rigidity of working hours. For each of the 11 dimensions in the data, an aggregate score is created by taking a simple unweighted average of the ranks of the underlying indicators, which leads to a cross-country ranking within each of the 11 topics. To obtain an overall Doing Business aggregate ranking, the report calculates a percentile for each country for ten of the topics (the employing workers’ category is excluded). These percentiles are aggregated to obtain the Ease of Doing Business ranking. This last one is the headline ranking that receives so much attention in media coverage (Besley, 2015).
1.3.2. Global Competitiveness Index
The World Economic Forum has been studying the competitiveness of nations for nearly three decades. Since 1979, an annual Global Competitiveness Report has examined the factors enabling national economies to achieve sustained economic growth and long-term prosperity (Sala-i-Martinet al.,2007).
According with the previous mentioned authors, over the years the reports have served as benchmarking
tools for business leaders and policymakers to identify obstacles to improved competitiveness, with the goal of stimulating discussion on strategies to overcome them.
income for their citizens. The productivity level also determines the rates of return obtained by investments in an economy. The concept of competitiveness thus involves static and dynamic components: although the productivity of a country clearly determines its ability to sustain a high level of income, it is also one of the central determinants of the returns to investment, which is one of the central factors explaining an economy’s growth potential (Sala-i-Martin et al., 2007). The index that attempts to
measure global competitiveness includes twelve (12) pillars and every pillar has its sub-pillars. In total,
the index includes 114 indicators grouped in three sub-indexes: (i) basic requirements, (ii) efficiency enhancers, and (iii) innovation and sophistication factors (Sala-i-Martin et al., 2016).
1.3.3. International Telecommunication Union
The rapid dissemination of information and communication technologies in all segments of society has created many opportunities to engage citizens in an increasingly digitally connected world. At the same time, the fast adoption of ICTs by citizens, organizations and governments poses new challenges for policymakers aiming to foster the ICT skills development required for success in today’s digital economy while also ensuring digital inclusion across the population (ITU News, 2016).
process at the international level of data collection, compilation and dissemination. Moreover, ITU has been offering capacity-building and technical support to Member States in the process of collecting and compiling ICT-related statistics (ITU News, 2016).
1.4. Environmental scanning process
Environmental scanning is the exploration phase of the strategic planning process. It is the systematic process of collecting and analysing information for the purposes of planning, forecasting, or choosing a preferred future. The environment of an organisation consists of the conditions, circumstances and influences which affect the organisation’s ability to achieve its objectives. Broadly, an organisational environment consists of two elements – the internal and the external. There are three phases in strategic management, (i) environmental assessment, (ii) strategy development, and (iii) strategy implementation (RMIT, 2003).
Strategic environmental scanning aims at anticipating (long-term) environmental shifts and analysing their potential impact. Indeed, environmental scannings main function is to gather, interpret, and use pertinent information about events, trends, and relationships in an organization's environment that would assist management in planning the future course of action (Aguilar, 1967). There are two methods for implementing an environmental scanning: the reactive mode in which information is acquired to solve a problem, and the proactive mode in which the environment is scanned for upcoming changes that represent opportunities and threats (Fahey & King, 1977). More recently, according to Wheelen and Hunger (2006), environmental scanning refers to the monitoring, evaluation and disseminating of information (from the external and internal environments) to key people within a business corporation. This information is needed for decision-making
Bourgeois (1980) views an institution’s or organization’s engagement in an environmental scanning process, especially one that looks at the trends affecting the organization, as an essential component in developing a strategic plan. Bourgeois (1980, p. 31) identifies “environmental scanning as part of the secondary level of strategy making that results in risk assessment and “perception of uncertainty”. Further, Bourgeois (1980) sees the environmental scanning process as a way to select and identify which “competitive weapons” give an organization its “distinctive competence”.
The environmental scanning helps to identify business opportunities and allows to analyse important information needed to assess countries, point important aspects related with different countries that are collected from different datasets and helps to compare them for further evaluation. This framework helps to analyse business context in different economies and for different sectors of activity like the case of the ICT sphere. Environmental scanning is one of the simple and quickest solutions to help in the process of decision-making for choosing a country where to develop future operations. This method is just, however, a first step in a more complex decision making business strategy.
Environmental scanning helps to analyse information needed to assess countries’ business environment and presenting and comparing important aspects from different datasets. In the case of this research work it also helps to compare such different aspects for further evaluation at the ICT sphere. Environmental scanning allows to find best solutions in a decision-making process with the objective of choosing a country for implementing a business.
The scanning analysis can be carried out through the elaboration of grids and matrixes where the information collected will be included and compared. The elaboration of an informational grid allows to include in the analysis factors that the managers may consider important for their rea of activity, having in consideration the particular characteristics of a country.
In the classical so called “market-penetration grid” managers create three categories of variables. In the first category they may include what they consider to be acceptable (or unacceptable) variables for implementing a business. Immediately, after filling the grid, they can select which are the unacceptable countries and remove them from their lists of potential alternatives. In the second category of variables, the managers may use variables that show if a country presents good opportunities for business, such as: (i) direct costs, (ii) market size, (iii) tax rate, (iv) minimal investment size, among others. In the third category of variables they may use data related with the country’s risk assess. For including this data, the managers could create a set of values and weight the variables, as they asses the risk weight of such a country. At the end, summing up all the results for each variable’s category the managers will be able to rank first the countries that offer more opportunities (highest rank) and the ones that are riskier for the business (the ones in the lower ranking places). So, they will be able to compare among countries to choose the most business attractive country or countries (Daniels, et al, 2015). For a clearer understanding of the grid, the results can be plotted in a matrix.
2. Research Methodology
2.1. Objective of the study
Since the objective is to understand how the business environment and competitiveness of an economy allows the introduction of companies in the ICT sector, it is proposed to develop a scientific work which implements business environmental scanning that allows strategic planning of activities based on analysis and comparison of broad indicators of opportunities and efficiency for various countries. Environmental scanning is a process that systematically surveys and interprets relevant data to identify external opportunities and threats. An organization gathers information about the external world, its competitors and itself. The company should then respond to the information gathered by changing its strategies and plans when the need arises (Lapin, 2004).
2.2. Description of Data Collection
2.2.1 Data collection for country comparison in ICT sector
Where that the objective is to implement an environmental scanning process, the idea is to create a grid with the most important indicators for a manager in ICT companies to decide the best location for his/her company. The method also gives the business managers, policy makers and researchers the possibility of saving time and money because it can be used without greatest knowledge. After environmental scanning, the managers and researchers can continue doing more global environmental analysis. The environmental scanning method here applied gathers information based on three databases: (i) The Doing Business Indicators, (ii) The Global Competitiveness Index and (iii) The International Telecommunication Union's reports. The official websites of these databases are, respectively: (i) www.doingbusiness.org, (ii) www.weforum.org and (iii) www.itu.int the data collected refers to the year 2016.
Starting by the Doing Business Project, it is possible to observe from the data visible on the website, that the best country to a company to do business is New Zealand. In second, third, and fourth places are Denmark, Singapore, and South Korea. The worst economies to implement a business are Libya, Eritrea and Somalia. Countries like Portugal and Armenia are located in the 24thand 48thpositions, respectively.
Concerning the Doing Business indicators, there are nonspecial indicators related directly with ICT companies. However, in this analysis it was decided to use five of the Doing Business indicators, which may be more important for ICT business than other. The selection of these indicators has been also driven by the work of several authors. For example, these indicators were used for research in ICT by Jerbashian and Kochanova (2016). These indicators are: (i) starting business, (ii) registering property, (iii) getting credit, (iv) protecting investors, and (v) paying taxes. Besides the previous indicators the following were also included: (i) Dealing with construction permits, (ii) Getting electricity, (iii) Enforcing contracts, (iv) Resolving insolvency.
top 10 countries are the same, but from the eleventh place to 30th place, six small countries appear: city-countries like Luxembourg at 11thplace, Monaco at 19thplace, Malta at 24thplaces and Andorra,
Macao, China and Bahrain from 27th till 29th places. Since these countries are very small, organizing
their networks is very easy.
For the next step of the analysis, the ICT sector of activity was divided in three other sectors: (i) Research and Development (R&D), (ii) Production, and (ii) Services (or more commonly referred as Sales). To simplify, R&D includes companies that are occupied with R&D activities as well as programming companies, that create software products. Production includes all types of production related with ICT activities. Services include all types of products (equipment, programs, and services) sold by ICT companies.
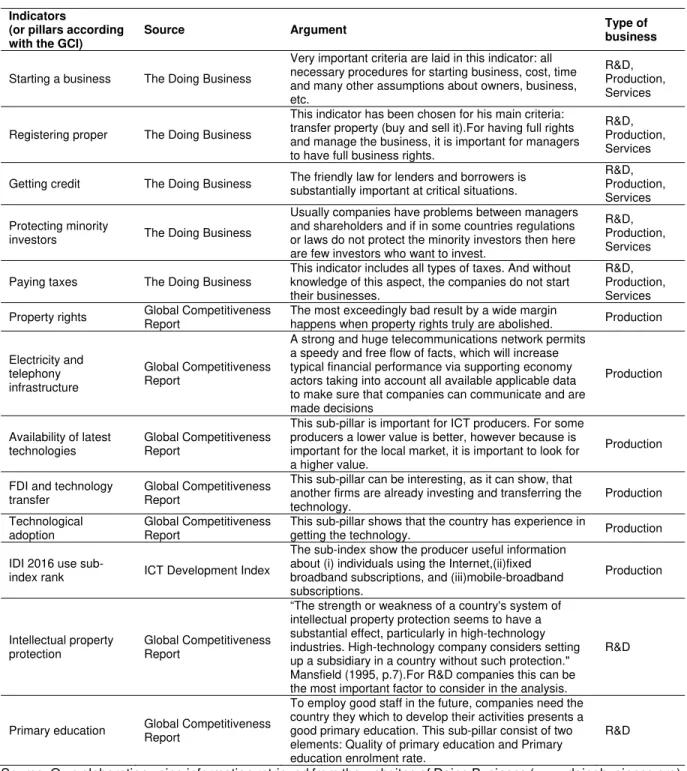
Table 1. Identification of the indicators selected for the process of international environmental scanning in the ICT sector and respective explanation
Indicators
(or pillars according with the GCI)
Source Argument Type of
business
Starting a business The Doing Business
Very important criteria are laid in this indicator: all necessary procedures for starting business, cost, time and many other assumptions about owners, business, etc.
R&D, Production, Services
Registering proper The Doing Business
This indicator has been chosen for his main criteria: transfer property (buy and sell it).For having full rights and manage the business, it is important for managers to have full business rights.
R&D, Production, Services
Getting credit The Doing Business The friendly law for lenders and borrowers is substantially important at critical situations.
R&D, Production, Services
Protecting minority
investors The Doing Business
Usually companies have problems between managers and shareholders and if in some countries regulations or laws do not protect the minority investors then here are few investors who want to invest.
R&D, Production, Services
Paying taxes The Doing Business
This indicator includes all types of taxes. And without knowledge of this aspect, the companies do not start their businesses.
R&D, Production, Services
Property rights Global Competitiveness Report
The most exceedingly bad result by a wide margin
happens when property rights truly are abolished. Production
Electricity and telephony infrastructure
Global Competitiveness Report
A strong and huge telecommunications network permits a speedy and free flow of facts, which will increase typical financial performance via supporting economy actors taking into account all available applicable data to make sure that companies can communicate and are made decisions
Production
Availability of latest technologies
Global Competitiveness Report
This sub-pillar is important for ICT producers. For some producers a lower value is better, however because is important for the local market, it is important to look for a higher value.
Production
FDI and technology transfer
Global Competitiveness Report
This sub-pillar can be interesting, as it can show, that another firms are already investing and transferring the technology. Production Technological adoption Global Competitiveness Report
This sub-pillar shows that the country has experience in
getting the technology. Production
IDI 2016 use
sub-index rank ICT Development Index
The sub-index show the producer useful information about (i) individuals using the Internet,(ii)fixed broadband subscriptions, and (iii)mobile-broadband subscriptions. Production Intellectual property protection Global Competitiveness Report
“The strength or weakness of a country's system of intellectual property protection seems to have a substantial effect, particularly in high-technology industries. High-technology company considers setting up a subsidiary in a country without such protection." Mansfield (1995, p.7).For R&D companies this can be the most important factor to consider in the analysis.
R&D
Primary education Global Competitiveness Report
To employ good staff in the future, companies need the country they which to develop their activities presents a good primary education. This sub-pillar consist of two elements: Quality of primary education and Primary education enrolment rate.
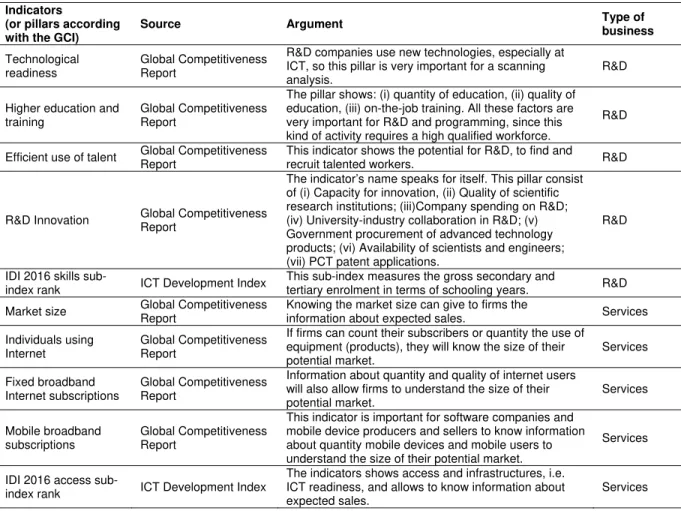
Table 1. Identification of the indicators selected for the process of international environmental
scanning in the ICT sector and respective explanation (continuation)
Indicators
(or pillars according with the GCI)
Source Argument Type of
business
Technological readiness
Global Competitiveness Report
R&D companies use new technologies, especially at ICT, so this pillar is very important for a scanning analysis.
R&D
Higher education and training
Global Competitiveness Report
The pillar shows: (i) quantity of education, (ii) quality of education, (iii) on-the-job training. All these factors are very important for R&D and programming, since this kind of activity requires a high qualified workforce.
R&D
Efficient use of talent Global Competitiveness Report
This indicator shows the potential for R&D, to find and
recruit talented workers. R&D
R&D Innovation Global Competitiveness Report
The indicator’s name speaks for itself. This pillar consist of (i) Capacity for innovation, (ii) Quality of scientific research institutions; (iii)Company spending on R&D; (iv) University-industry collaboration in R&D; (v) Government procurement of advanced technology products; (vi) Availability of scientists and engineers; (vii) PCT patent applications.
R&D
IDI 2016 skills
sub-index rank ICT Development Index
This sub-index measures the gross secondary and
tertiary enrolment in terms of schooling years. R&D
Market size Global Competitiveness Report
Knowing the market size can give to firms the
information about expected sales. Services
Individuals using Internet
Global Competitiveness Report
If firms can count their subscribers or quantity the use of equipment (products), they will know the size of their potential market. Services Fixed broadband Internet subscriptions Global Competitiveness Report
Information about quantity and quality of internet users will also allow firms to understand the size of their potential market. Services Mobile broadband subscriptions Global Competitiveness Report
This indicator is important for software companies and mobile device producers and sellers to know information about quantity mobile devices and mobile users to understand the size of their potential market.
Services
IDI 2016 access
sub-index rank ICT Development Index
The indicators shows access and infrastructures, i.e. ICT readiness, and allows to know information about expected sales.
Services
Source: Own elaboration using information retrieved from the websites of Doing Business (www.doingbusiness.org),
Global Competitiveness Report (www.weforum.org) and ICT Development Index(www.itu.int).
After the selection of variables, indicators, and pillars from the three datasets chosen, a market-penetration grid and a matrix for the GCI pillars will be created to examine the countries under analysis. The above sources do not include directly indicators of risk assessment. However, the indicators and pillars show them indirectly, this is, the higher the value of the indicators and pillars, the lower the risk. Due to this restriction, it has been decided to change the factors of risk by factors that measure efficiency. The market-penetration grid adopting the GCI pillars will be created using the following pillars are used as proxy variables to measure the business opportunity of an economy: (i) the GCI 3rd pillar that analysis the macroeconomic environment, (ii) the GCI 5th pillar that measures indicators related with higher education and training, (iii) the GCI 10th pillar regarding the market size, (iv) the GCI 11th pillar that measures the country business sophistication, and (v) the GCI 12th pillar that measures the degree of innovation in the economy.
pillar that offers several indicators that analyse the efficiency of institutions, (ii) the GCI 2nd pillar that offers several indicators that analyse the economy’s infrastructures, (iii) the GCI 6th pillar that measures the goods market efficiency, (iv) the GCI 7th pillar that measures the labour market efficiency, and, finally, (v) the GCI 9th pillar that includes indicators that measure the technological readiness.
2.3. Scanning analysis
There are many techniques to do a scanning analysis. A scanning analysis can be systematic, mathematical, judgmental, and intuitive, and the choice between the types depends on the information and/or data that is available. The data on which the scanning process relies is collected from reliable and international comparable sources of information – internationally formal world organizations such as the World Bank Group, the World Economic Forum, and the International Telecommunication Union. The first step of the scanning process implies the calculation of data ranks that can be presents in tables. The ranks are calculated first to choose the possible investment countries. The datasets, nowadays, calculate indicators for almost all the countries in the world, however, this analysis will be centred in a minor set of countries – the ones that could be really interesting in the sector of ICT. Then will be observe the value that each selected country present for each one of the indicators (pillars) presented in Table 1, for the all ICT sector of activity and inside this sector, for the sub-sectors of R&D, Production and Services.
To evaluate countries, opportunity and efficiency dimensions were used in this research paper in order to rank countries. For a better visual representation, grids and matrices will be presented in the following sections.
3. Presentation and analysis of aesults
3.1. Country’s selection for the scanning analysis
When using each one of the datasets mentioned in the previous section, a general index that ranks countries from the first place to the last one is presented. The countries that are presented in the top of the index are the best placed and the countries presented in the last places are the ones that perform worse. For example, if using the Doing Business Index, in the country that performs better is given the number 1 regarding doing business. Since the Doing Business Project analyses 190 countries, the number 190 is given to the country that performs worst. The other countries are located between these two numbers. Regarding the other two indexes, the behavior is similar.
Table 2. Scanning rank for selection of potential countries for implementing an ICT companies.
Scanning
rank Countries
Global Competitiveness Index ICT Development Index Doing Business
Rank Sum
(1) (2) (3) (4)=(1)+(2)+(3)
1 Denmark 12 3 2 17
2 United Kingdom 7 5 6 18
3 Hong Kong SAR, China 9 6 5 20
4 Sweden 6 7 9 22
5 Singapore 2 20 3 25
6 United States 3 15 7 25
7 New Zealand 13 13 1 27
8 Norway 11 9 8 28
9 Korea, Rep 26 1 4 31
10 Germany 5 12 14 31
11 Switzerland 1 4 29 34
12 Taiwan, China 14 - 10 37
13 Finland 10 17 12 39
14 Netherlands 4 8 27 39
15 Iceland 27 2 18 47
16 Australia 22 14 13 49
17 Japan 8 10 32 50
18 Estonia 30 18 11 59
19 Ireland 23 21 15 59
20 Austria 19 23 18 60
21 Canada 15 25 20 60
22 France 21 16 28 65
23 Belgium 17 22 38 77
24 United Arab Emirates 16 38 34 88
25 Luxembourg 20 11 57 88
26 Czech Republic 31 32 26 89
27 Spain 32 26 33 91
28 Lithuania 35 39 21 95
29 Israel 24 30 49 103
30 Latvia 49 40 17 106
31 Malaysia 25 61 22 108
32 Poland 36 50 25 111
33 Portugal 46 44 24 114
34 Slovenia 56 33 30 119
35 Russian Federation 43 43 36 122
36 Italy 44 37 44 125
37 Bulgaria 50 49 37 136
38 Qatar 18 46 74 138
39 Bahrain 48 29 66 143
40 Chile 33 56 55 144
60 Armenia 79 71 43 193
Source: Own elaboration using information retrieved from the websites of Doing Business (www.doingbusiness.org),
Global Competitiveness Report (www.weforum.org) and ICT Development Index (www.itu.int).
The rank that results from the sum of the three original ranks allows selecting a set of countries that may be considered to implement a new business in the ICT sector of activity. From the values presented in the Table 2 it is possible to understand developed countries are listed that at the top 20 of the scanning rank. For example, Denmark is at the top in the ranking when ‘sum’ column is looked at, although the country is not in the first place in any of the presented ranks. However, Denmark holds a very good position (rank) in the ICT Development index and Doing Business rank which makes it the best country to operate ICT business in, considering the three datasets selected.
As can be observed from the table, there are small differences between the countries that are ranked first, thus it can be expected that these countries will compete for the leading position in the future. Still, more in-depth analysis is needed for any of these countries in order to understand their attractiveness for investments in the ICT sector.
Moreover, all four big Asian economies – so-called Asian Tigers (South Korea, Singapore, Hong Kong, and Taiwan) – are represented in the list of selected countries, as well as some Arabic oil-rich countries It is also possible to observe in Table 2 which countries present problems with the governmental institutions, competitive advantages and ICT sector in general, even though these assumptions are just relative since the list contains only countries with high ranks in each one of the three datasets. For example, Estonia is in the 30th place in the Global Competitiveness Index. This may indicate the
existence of some problems regarding the competitive advantages of the country and a lower level of attractiveness among all the other countries. Nevertheless, it should be pointed out, that Estonia is an a relatively new economy since it withdrew from the USSR and gained independence only in 1991. The country has its problems regarding demography, salaries, unemployment rates etc. Still, it already improved a lot in terms of business regulations (11th place in Doing Business Rank) and ICT development
(18th place in the corresponding index). Thus, ICT sector can be considered as good and attractive for
further investments which can serve as a catalyst for the growing of the country’s economy.
It can be seen from Table 2 that Portugal has normal laws and rules, the government works well. Portugal is a little behind in competitiveness and ICT ranks in comparison with other developed countries. However, Portugal is in top 40 the list of countries and further analysis can be done.
Although Armenia is out of the top 40 (it has 60th rankingposition), it is included in the analysis. Armenia
implements certain actions in order to easy doing business procedures; however, the competitiveness and ICT development rankings are worse.
In the Table 2, Qatar and Chile have the last 2 positions, but it does not mean that they are worse, in their regions they are in avant-garde. But they still need to work to reach developed countries.
3.2. Implementation of the scanning process
The scanning process, presented in this section, is based on information that were collected and presented at Table 1. This is the information considered for doing the scanning analysis is the one that can be collected in the three datasets for the indicators selected.
The information from the Global Competitiveness Index (GCI) regards the period of 2016/2017. The information of all the pillars selected will be used to analyse possible investments in ICT - R&D, Production and Services – as it seems more appropriate. Companies in the R&D sub-sector will be more interested in the following GCI pillars and sub-pillars: (i) the sub-pillar 1.02 related with the intellectual property protection, (ii) the GCI sub-pillar 9.01 that measures the availability of latest technologies, (iii) the GCI sub-pillar 9.03 that measures the Foreign Direct Investment (FDI) and the technology transfer, and (v) the GCI general 9th pillar that offers indicators related with the technological readiness. For
analyses of the sub-sector of production ICT companies, the research will use the following Doing Business and GCI indicators, pillars and sub-pillars: (i) the Doing Business indicator that gives indications about the property rights, (ii) the Doing Business indicators that offers information about electricity and telephony infrastructures, (iii) the GCI sub-pillar 9.01 that indicates the values of availability of latest technologies, (iv) the GCI sub-pillar 9.03 that, as already indicated, measures the FDI and technology transfer, and, finally, (v) the GCI sub-pillar 9.01 that presents indicators related with technological adoption. To conclude, for the scanning process applied to the subsector of services, inside the ICT sector, the work uses the following GCI pillars and sub-pillars: (i) the GCI 10th pillar that offers indicators
about the market size, (ii) the GCI 9.04 pillar that indicates how many individuals are using Internet, (iii) the GCI sub-pillar 9.05 that presents the number of fixed broadband Internet subscriptions, (iv) the GCI pillar 9.07 that presents the number of mobile broadband subscriptions, and, finally, (v) the GCI sub-pillar 9.02 that measures the use of ICT.
To conclude, is also used information taken from the ICT Development Index, in particular 3 sub-indexes: the IDI 2016 skills sub-index rank for applying in R&D companies, the IDI 2016 use sub-index rank for applying in production companies, and the IDI 2016 access sub-index rank for applying in the services companies.
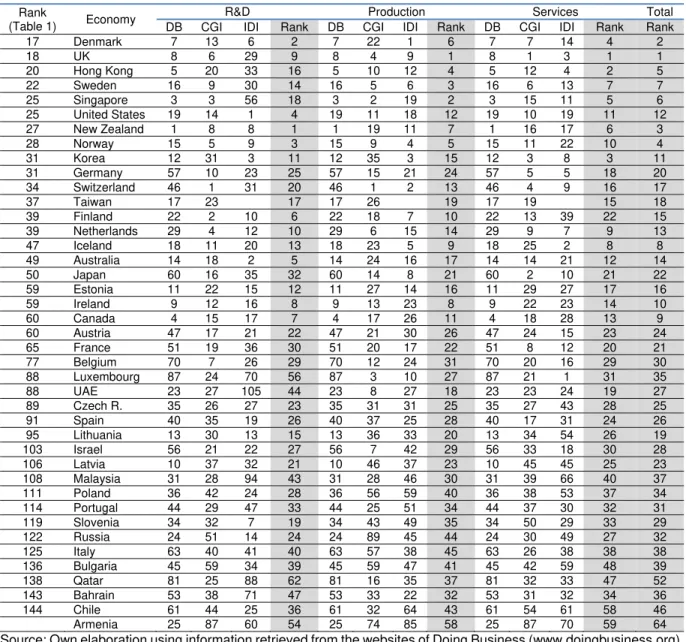
Table 3. Scanning rank for selection of potential countries for implementing R&D, Production, and Services ICT companies
Rank
(Table 1) Economy
R&D Production Services Total
DB CGI IDI Rank DB CGI IDI Rank DB CGI IDI Rank Rank
17 Denmark 7 13 6 2 7 22 1 6 7 7 14 4 2
18 UK 8 6 29 9 8 4 9 1 8 1 3 1 1
20 Hong Kong 5 20 33 16 5 10 12 4 5 12 4 2 5
22 Sweden 16 9 30 14 16 5 6 3 16 6 13 7 7
25 Singapore 3 3 56 18 3 2 19 2 3 15 11 5 6
25 United States 19 14 1 4 19 11 18 12 19 10 19 11 12
27 New Zealand 1 8 8 1 1 19 11 7 1 16 17 6 3
28 Norway 15 5 9 3 15 9 4 5 15 11 22 10 4
31 Korea 12 31 3 11 12 35 3 15 12 3 8 3 11
31 Germany 57 10 23 25 57 15 21 24 57 5 5 18 20
34 Switzerland 46 1 31 20 46 1 2 13 46 4 9 16 17
37 Taiwan 17 23 17 17 26 19 17 19 15 18
39 Finland 22 2 10 6 22 18 7 10 22 13 39 22 15
39 Netherlands 29 4 12 10 29 6 15 14 29 9 7 9 13
47 Iceland 18 11 20 13 18 23 5 9 18 25 2 8 8
49 Australia 14 18 2 5 14 24 16 17 14 14 21 12 14
50 Japan 60 16 35 32 60 14 8 21 60 2 10 21 22
59 Estonia 11 22 15 12 11 27 14 16 11 29 27 17 16
59 Ireland 9 12 16 8 9 13 23 8 9 22 23 14 10
60 Canada 4 15 17 7 4 17 26 11 4 18 28 13 9
60 Austria 47 17 21 22 47 21 30 26 47 24 15 23 24
65 France 51 19 36 30 51 20 17 22 51 8 12 20 21
77 Belgium 70 7 26 29 70 12 24 31 70 20 16 29 30
88 Luxembourg 87 24 70 56 87 3 10 27 87 21 1 31 35
88 UAE 23 27 105 44 23 8 27 18 23 23 24 19 27
89 Czech R. 35 26 27 23 35 31 31 25 35 27 43 28 25
91 Spain 40 35 19 26 40 37 25 28 40 17 31 24 26
95 Lithuania 13 30 13 15 13 36 33 20 13 34 54 26 19
103 Israel 56 21 22 27 56 7 42 29 56 33 18 30 28
106 Latvia 10 37 32 21 10 46 37 23 10 45 45 25 23
108 Malaysia 31 28 94 43 31 28 46 30 31 39 66 40 37
111 Poland 36 42 24 28 36 56 59 40 36 38 53 37 34
114 Portugal 44 29 47 33 44 25 51 34 44 37 30 32 31
119 Slovenia 34 32 7 19 34 43 49 35 34 50 29 33 29
122 Russia 24 51 14 24 24 89 45 44 24 30 49 27 32
125 Italy 63 40 41 40 63 57 38 45 63 26 38 38 38
136 Bulgaria 45 59 34 39 45 59 47 41 45 42 59 48 39
138 Qatar 81 25 88 62 81 16 35 37 81 32 33 47 52
143 Bahrain 53 38 71 47 53 33 22 32 53 31 32 34 36
144 Chile 61 44 25 36 61 32 64 43 61 54 61 58 46
Armenia 25 87 60 54 25 74 85 58 25 87 70 59 64
Source: Own elaboration using information retrieved from the websites of Doing Business (www.doingbusiness.org), Global Competitiveness Report (www.weforum.org) and ICT Development Index (www.itu.int).
As an example, United Kingdom (UK) and New Zealand can be compared. It is seen from the previous table that, in total, for these three sub-sectors, UK is located in the first position and New Zealand has the third one. However, if only R&D rank is taken into consideration, New Zealand occupies the first position and UK is just on the ninth one. If ranks for Production and Services are looked at, New Zealand is located on seventh and sixth positions, respectively, while UK is located first for both these ranks. At the same time, if the initial rank from Table 2 is analysed and compared with the total rank for the three sub-sectors, UK has the second position while New Zealand is on the seventh one. This difference is due to the fact that the ICT sector does not consist only on these three sub-sectors, and there are more pillars and sub-pillars in the rankings that can be used for evaluation and were not considered in the present research.
If the Services Rank for Sweden and Germany are compared, Sweden presents a better result - seventh position against the eighteenth position for Germany. However, if each ranking index is taken separately, for CGI and IDI Services, Germany goes up to the fifth position, while Sweden just ranks in the sixth and thirteenth positions, respectively. Only for the Doing Business project, the Services in Sweden perform better – Sweden has the sixteenth position against the fifty seventh’ position obtained by Germany, from this analysis it could be said that Germany presents more strong and robust rules than Sweden in terms of business regulations.
It is also important to compare the two countries which are located in the first two positions: Denmark and UK. As can be seen from Table 2, Denmark ranks first, closely followed by UK. However, in Table 3 they switch places. The reason could be because in Table 2 indicators for the ICT sector as a whole were used, while in Table 3 only indicators which are chosen and presented in Table 1 are taken into account.
Portugal rises from position 33 to position 31 place in the total rank calculated for the three considered sub-sectors if compared to the initial ranking. This indicates that Portugal has a stable position in all ICT sub-sectors, here considered, as well as normal and stable rules regarding the business environment and it is competitive, even if is not in the top-25 of the countries considered. A little bit lower in the rank is located Armenia. The country ranks in a position near the 60th place if whole the ICT sector of activity
is taken into consideration. However, in the R&D rank the economies situation is slightly better with the country ranking in the 54th place in the list.
Comparing positions of the top 40 countries (Table2 vs Table3) it can be seen that positions are almost identical - they only slightly differ by one or two points. Only five countries strengthened their position in the ranks Canada improved is location in twelve positions, Lithuania nine positions, Iceland and Latvia seven positions and Slovenia five positions. At the same time, three countries fell in the rating: Luxembourg felt ten positions, Belgium felt seven positions, and Malaysia six positions.
If Table 2 and Table 3 are compared, almost all countries remained from Table 2 to Table 3 and only Qatar went out from the list presented in Table 3. Slovakia appeared at the thirty-third position, for the first time, in the total rank of Table 3. Thus, using the indicators and pillars that were considered important to scan a country regarding the implementation of ICT comparison does not change the overall alignment of each country compared with others, as for each rank for ICT sectors especially suitable indicators, sub-indexes, pillars, and sub-pillars are used.
The choice of indicators and pillars may be criticized, and some others pillars, indicators or indices may be used for the analysis. However, in this particular study, the intention was the creation of a simple method for evaluating countries according with the perception of the author that relies on previous research and literature. It is obvious that any researcher or interested party can use any tool and indicators/indices that are considered more important for them. However, in the case of this research the results show that the overall picture does not change which indicates the right choice of data.
3.3. Countries comparison by grids and matrices
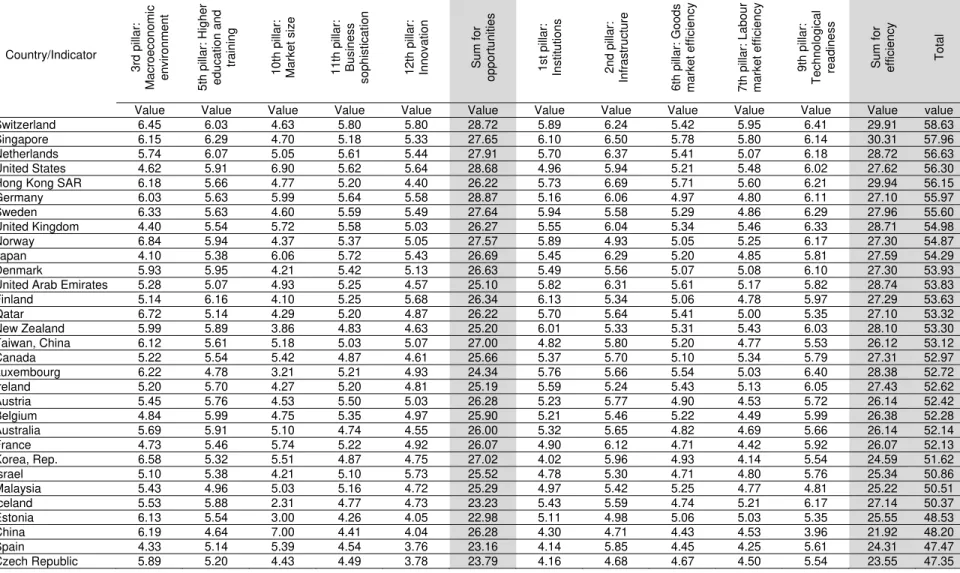
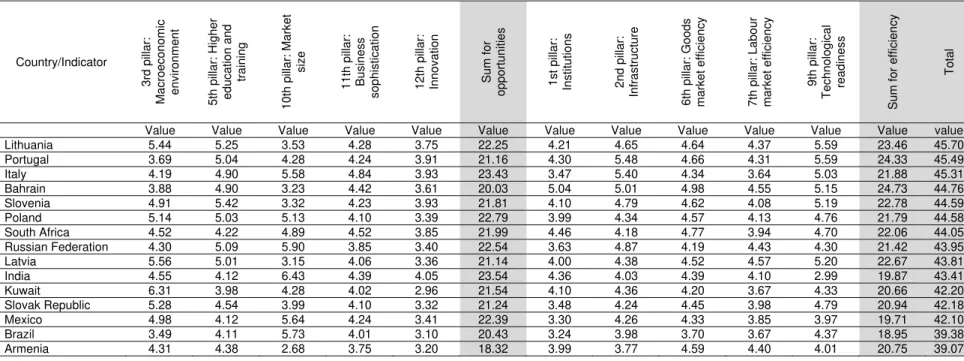
Table 4. Market-penetration grid.
Country/Indicator
3r
d pillar
:
Macroeconomic environment 5th pillar: Higher education and
training 10th pillar : Mar k et size 11th pillar : Business
sophistication 12th pillar
:
Innovation Sum for
opportunities 1st pillar
:
Institutions 2nd pillar:
Infrastructure
6th pillar: G
oods
market efficiency 7th pillar: Labour market efficiency
9th pillar
:
Technological
readiness Sum for efficiency
Total
Value Value Value Value Value Value Value Value Value Value Value Value value
Switzerland 6.45 6.03 4.63 5.80 5.80 28.72 5.89 6.24 5.42 5.95 6.41 29.91 58.63
Singapore 6.15 6.29 4.70 5.18 5.33 27.65 6.10 6.50 5.78 5.80 6.14 30.31 57.96
Netherlands 5.74 6.07 5.05 5.61 5.44 27.91 5.70 6.37 5.41 5.07 6.18 28.72 56.63
United States 4.62 5.91 6.90 5.62 5.64 28.68 4.96 5.94 5.21 5.48 6.02 27.62 56.30
Hong Kong SAR 6.18 5.66 4.77 5.20 4.40 26.22 5.73 6.69 5.71 5.60 6.21 29.94 56.15
Germany 6.03 5.63 5.99 5.64 5.58 28.87 5.16 6.06 4.97 4.80 6.11 27.10 55.97
Sweden 6.33 5.63 4.60 5.59 5.49 27.64 5.94 5.58 5.29 4.86 6.29 27.96 55.60
United Kingdom 4.40 5.54 5.72 5.58 5.03 26.27 5.55 6.04 5.34 5.46 6.33 28.71 54.98
Norway 6.84 5.94 4.37 5.37 5.05 27.57 5.89 4.93 5.05 5.25 6.17 27.30 54.87
Japan 4.10 5.38 6.06 5.72 5.43 26.69 5.45 6.29 5.20 4.85 5.81 27.59 54.29
Denmark 5.93 5.95 4.21 5.42 5.13 26.63 5.49 5.56 5.07 5.08 6.10 27.30 53.93
United Arab Emirates 5.28 5.07 4.93 5.25 4.57 25.10 5.82 6.31 5.61 5.17 5.82 28.74 53.83
Finland 5.14 6.16 4.10 5.25 5.68 26.34 6.13 5.34 5.06 4.78 5.97 27.29 53.63
Qatar 6.72 5.14 4.29 5.20 4.87 26.22 5.70 5.64 5.41 5.00 5.35 27.10 53.32
New Zealand 5.99 5.89 3.86 4.83 4.63 25.20 6.01 5.33 5.31 5.43 6.03 28.10 53.30
Taiwan, China 6.12 5.61 5.18 5.03 5.07 27.00 4.82 5.80 5.20 4.77 5.53 26.12 53.12
Canada 5.22 5.54 5.42 4.87 4.61 25.66 5.37 5.70 5.10 5.34 5.79 27.31 52.97
Luxembourg 6.22 4.78 3.21 5.21 4.93 24.34 5.76 5.66 5.54 5.03 6.40 28.38 52.72
Ireland 5.20 5.70 4.27 5.20 4.81 25.19 5.59 5.24 5.43 5.13 6.05 27.43 52.62
Austria 5.45 5.76 4.53 5.50 5.03 26.28 5.23 5.77 4.90 4.53 5.72 26.14 52.42
Belgium 4.84 5.99 4.75 5.35 4.97 25.90 5.21 5.46 5.22 4.49 5.99 26.38 52.28
Australia 5.69 5.91 5.10 4.74 4.55 26.00 5.32 5.65 4.82 4.69 5.66 26.14 52.14
France 4.73 5.46 5.74 5.22 4.92 26.07 4.90 6.12 4.71 4.42 5.92 26.07 52.13
Korea, Rep. 6.58 5.32 5.51 4.87 4.75 27.02 4.02 5.96 4.93 4.14 5.54 24.59 51.62
Israel 5.10 5.38 4.21 5.10 5.73 25.52 4.78 5.30 4.71 4.80 5.76 25.34 50.86
Malaysia 5.43 4.96 5.03 5.16 4.72 25.29 4.97 5.42 5.25 4.77 4.81 25.22 50.51
Iceland 5.53 5.88 2.31 4.77 4.73 23.23 5.43 5.59 4.74 5.21 6.17 27.14 50.37
Estonia 6.13 5.54 3.00 4.26 4.05 22.98 5.11 4.98 5.06 5.03 5.35 25.55 48.53
China 6.19 4.64 7.00 4.41 4.04 26.28 4.30 4.71 4.43 4.53 3.96 21.92 48.20
Spain 4.33 5.14 5.39 4.54 3.76 23.16 4.14 5.85 4.45 4.25 5.61 24.31 47.47
Czech Republic 5.89 5.20 4.43 4.49 3.78 23.79 4.16 4.68 4.67 4.50 5.54 23.55 47.35
Source: Global Competitiveness Index, (www.weforum.org).
Table 4. Market-penetration grid (continuation)
Country/Indicator
3r
d pillar
:
Macroeconomic environment 5th pillar: Higher education and
training 10th pillar : Mar k et size 11th pillar : Business
sophistication 12th pillar
:
Innovation Sum for opportunities 1st pillar
:
Institutions 2nd pillar: Infrastructure
6th pillar: G
oods
market efficiency 7th pillar: Labour market efficiency
9th pillar
:
Technological readiness
Sum for efficiency
Total
Value Value Value Value Value Value Value Value Value Value Value Value value
Lithuania 5.44 5.25 3.53 4.28 3.75 22.25 4.21 4.65 4.64 4.37 5.59 23.46 45.70
Portugal 3.69 5.04 4.28 4.24 3.91 21.16 4.30 5.48 4.66 4.31 5.59 24.33 45.49
Italy 4.19 4.90 5.58 4.84 3.93 23.43 3.47 5.40 4.34 3.64 5.03 21.88 45.31
Bahrain 3.88 4.90 3.23 4.42 3.61 20.03 5.04 5.01 4.98 4.55 5.15 24.73 44.76
Slovenia 4.91 5.42 3.32 4.23 3.93 21.81 4.10 4.79 4.62 4.08 5.19 22.78 44.59
Poland 5.14 5.03 5.13 4.10 3.39 22.79 3.99 4.34 4.57 4.13 4.76 21.79 44.58
South Africa 4.52 4.22 4.89 4.52 3.85 21.99 4.46 4.18 4.77 3.94 4.70 22.06 44.05
Russian Federation 4.30 5.09 5.90 3.85 3.40 22.54 3.63 4.87 4.19 4.43 4.30 21.42 43.95
Latvia 5.56 5.01 3.15 4.06 3.36 21.14 4.00 4.38 4.52 4.57 5.20 22.67 43.81
India 4.55 4.12 6.43 4.39 4.05 23.54 4.36 4.03 4.39 4.10 2.99 19.87 43.41
Kuwait 6.31 3.98 4.28 4.02 2.96 21.54 4.10 4.36 4.20 3.67 4.33 20.66 42.20
Slovak Republic 5.28 4.54 3.99 4.10 3.32 21.24 3.48 4.24 4.45 3.98 4.79 20.94 42.18
Mexico 4.98 4.12 5.64 4.24 3.41 22.39 3.30 4.26 4.33 3.85 3.97 19.71 42.10
Brazil 3.49 4.11 5.73 4.01 3.10 20.43 3.24 3.98 3.70 3.67 4.37 18.95 39.38
Armenia 4.31 4.38 2.68 3.75 3.20 18.32 3.99 3.77 4.59 4.40 4.01 20.75 39.07
Source: Global Competitiveness Index, (www.weforum.org)
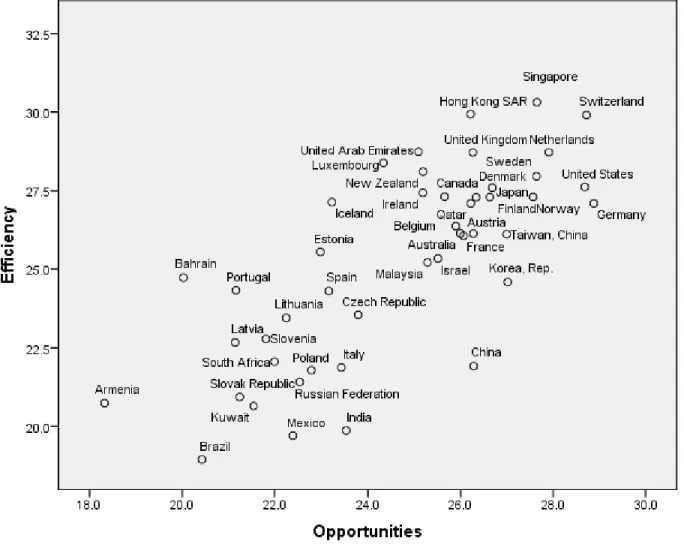
Table 4 and Figure 1 (that graphically illustrates the figures presented in Table 4) allow to understand, why some countries are in the beginning of the list and others are at the bottom. In Figure 1, X-axis shows the opportunities and Y-axis show efficiency. Looking at the axis, researchers and business managers can analyse which countries offer good opportunities and weighty efficiency
For an easier perception, it is possible to observe the comparison between US and Germany. For these countries the values of pillars do not present a big difference in value weights. However, when comparing US and China, US presents better values in most cases. China only presents a bigger market and has a better macroeconomic environment. Indeed, China presents, for example, more opportunities than Estonia but has less efficiency, so in this rank China is behind Estonia.
Figure 1. Market penetration matrix
Source: Global Competitiveness Index, (www.weforum.org)
The matrix in Figure 1 shows that two “oil countries” appear in good positions: United Arab Emirates and Qatar. UAE presents more efficiency than many developed countries. This also shows that in future UAE will try to improve it position in the rank and be more attractive for investments than other countries. China presents good opportunities but less efficiency which means that has to work on this direction, as Italy, Poland or Russian Federation.