International meta-analysis of PTSD genome-wide
association studies identi
fies sex- and
ancestry-speci
fic genetic risk loci
Caroline M. Nievergelt
et al.
#The risk of posttraumatic stress disorder (PTSD) following trauma is heritable, but robust
common variants have yet to be identified. In a multi-ethnic cohort including over 30,000
PTSD cases and 170,000 controls we conduct a genome-wide association study of PTSD. We
demonstrate SNP-based heritability estimates of 5
–20%, varying by sex. Three genome-wide
signi
ficant loci are identified, 2 in European and 1 in African-ancestry analyses. Analyses
strati
fied by sex implicate 3 additional loci in men. Along with other novel genes and
non-coding RNAs, a Parkinson
’s disease gene involved in dopamine regulation, PARK2, is
associated with PTSD. Finally, we demonstrate that polygenic risk for PTSD is signi
ficantly
predictive of re-experiencing symptoms in the Million Veteran Program dataset, although
speci
fic loci did not replicate. These results demonstrate the role of genetic variation in the
biology of risk for PTSD and highlight the necessity of conducting sex-strati
fied analyses and
expanding GWAS beyond European ancestry populations.
https://doi.org/10.1038/s41467-019-12576-w
OPEN
#A full list of authors and their affiliations appears at the end of the paper.
123456789
P
ost-traumatic stress disorder (PTSD) is a commonly
occurring mental health consequence of exposure to
extreme, life threatening stress, and/or serious injury/harm.
PTSD is frequently associated with the occurrence of comorbid
mental disorders such as major depression
1and other adverse
health sequelae including type 2 diabetes and cardiovascular
disease
2,3. Given this high prevalence and impact, PTSD is a
serious public health problem. An understanding of the biological
mechanisms of risk for PTSD is therefore an important goal of
research ultimately aimed at its prevention and mitigation
4,5.
Exposure to traumatic stress is, by definition, requisite for the
development of PTSD, but individual susceptibility to PTSD
(conditioned on trauma exposure) varies widely. Twin studies
over the past two decades provide persuasive evidence for at least
some genetic influence on PTSD risk
6,7, and the last decade has
witnessed the beginnings of a concerted effort to detect specific
genetic susceptibility variants for PTSD
8,9.
The Psychiatric Genomics Consortium—PTSD Group
(PGC-PTSD) published results from a large GWAS on PTSD, involving
a trans-ethnic sample of over 20,000 individuals, approximately
5000 (25%) of whom were cases
10. With this limited sample size,
no individual variants exceeded genome-wide significance;
how-ever, significant estimates of SNP heritability and genetic
corre-lations between PTSD and other mental disorders such as
schizophrenia were demonstrated for the
first time.
It is apparent from previous PGC work on other mental
dis-orders that sample size is paramount for GWAS to discern
common genome-wide significant variants of small effect that are
replicable
11. Subsequent to the publication of data from the
first
freeze
10, the PGC-PTSD has continued to acquire additional
PTSD cases and controls through partnerships with an expanding
network of investigators, such that we now have accrued a sample
size that has enabled us to turn the corner on genome-wide risk
discovery. Presented here are the results of our latest GWA
stu-dies that include over 23,000 European and over 4000 African
ancestry PTSD cases, now involving a total trans-ethnic sample of
over 200,000 individuals. In achieving this sample size, we
identify sex- and ancestry-specific findings. GWAS and
gene-based analyses across our cohorts indicate genome-wide
sig-nificant associations, involving genes related to dopamine and
immune pathways. We show high genetic correlations between
PTSD and related psychiatric disorders such as major depressive
disorder, but present evidence that some of the identified loci are
likely specific to PTSD. In addition, we construct a highly
sig-nificant polygenic risk score for PTSD, which is predictive of
re-experiencing symptoms (REX), a core feature of PTSD, in the
independent Million Veteran Program cohort
9.
Results
Meta-analysis strategy across ancestries and sex. We report
meta-analyses of GWAS from the PGC-PTSD Freeze 2 (PGC2),
comprised of an ancestrally diverse group of 206,655 participants
(including 32,428 cases) from 60 different PTSD studies, ranging
from clinically deeply characterized, small patient groups to large
cohorts with self-reported PTSD symptoms (Supplementary
Data 1). Trauma exposure included both civilian and/or military
events, often with pre-existing exposure to childhood trauma, and
the majority of controls were trauma-exposed. First ancestry
groups were consistently defined across studies (Supplementary
Fig. 1). Primary GWAS were then performed separately in the
three largest ancestry groups (European (EUA), African (AFA),
and Native American Ancestry (AMA)), then meta-analyzed
across studies and ancestry groups. Given the previously observed
differences between male and female heritability estimates in
PGC-PTSD Freeze 1
10, we also performed sex-stratified analyses.
Quantile-quantile plots showed low inflation across analyses
(Supplementary Fig. 2), which was mostly accounted for by
polygenic SNP effects with little indication of residual population
stratification (see Supplementary Note 1 for additional
information).
Heritability of PTSD. We estimated heritability of PTSD in the
EUA studies (Table
1
) based on information captured by
geno-typing arrays (h
2SNP) from summary statistics using LDSC
12.
Assuming a population prevalence of 30% after trauma exposure,
overall h
2SNP
in PGC2 was 0.05 on the liability scale (P
= 3.18 ×
10
−8). However, female heritability was highly significant
(h
2SNP= 0.10, P = 8.03 × 10
−11), while male heritability was not
significantly different from zero (h
2SNP
= 0.01, P = 0.63).
We further examined sex differences in heritability in different
subsets of the data: the PGC2 data without the UK Biobank
(referred to as PGC1.5) and the UK Biobank (UKB) by itself,
which comprises a large proportion of PGC2. Similar to the
overall PGC2, heritability in PGC1.5 was high in women and
not significant in men. In contrast, in the UKB, male heritability
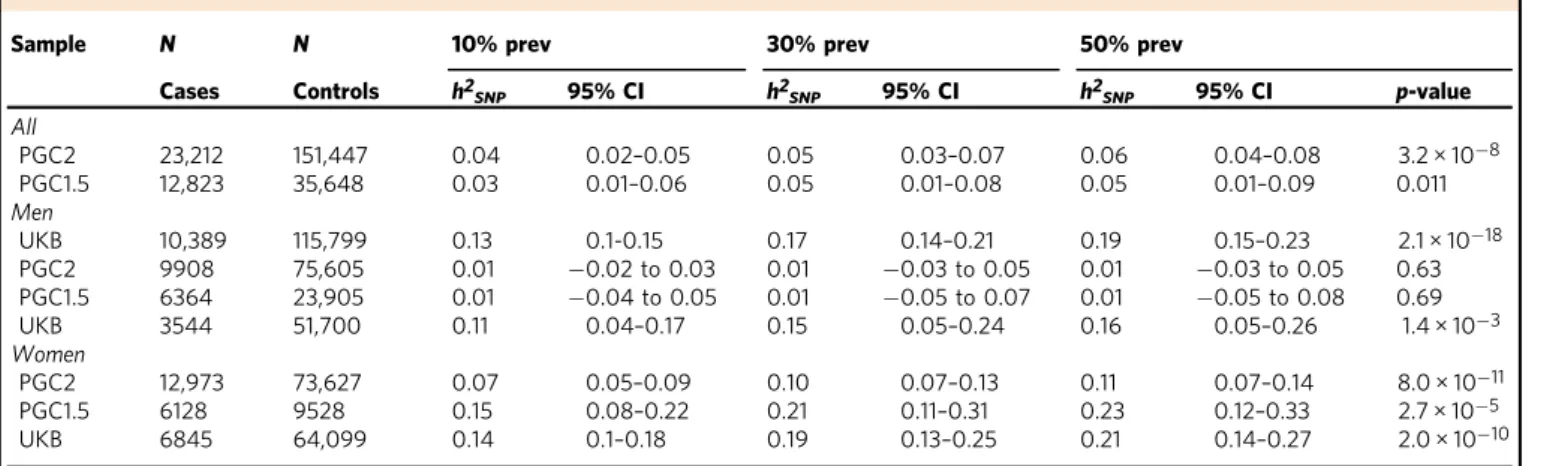
Table 1 Heritability estimates in subjects of European ancestry (EUA)
Sample N N 10% prev 30% prev 50% prev
Cases Controls h2SNP 95% CI h2SNP 95% CI h2SNP 95% CI p-value
All PGC2 23,212 151,447 0.04 0.02–0.05 0.05 0.03–0.07 0.06 0.04–0.08 3.2 × 10⁻⁸ PGC1.5 12,823 35,648 0.03 0.01–0.06 0.05 0.01–0.08 0.05 0.01–0.09 0.011 Men UKB 10,389 115,799 0.13 0.1-0.15 0.17 0.14–0.21 0.19 0.15–0.23 2.1 × 10⁻¹⁸ PGC2 9908 75,605 0.01 −0.02 to 0.03 0.01 −0.03 to 0.05 0.01 −0.03 to 0.05 0.63 PGC1.5 6364 23,905 0.01 −0.04 to 0.05 0.01 −0.05 to 0.07 0.01 −0.05 to 0.08 0.69 UKB 3544 51,700 0.11 0.04–0.17 0.15 0.05–0.24 0.16 0.05–0.26 1.4 × 10⁻³ Women PGC2 12,973 73,627 0.07 0.05–0.09 0.10 0.07–0.13 0.11 0.07–0.14 8.0 × 10⁻¹¹ PGC1.5 6128 9528 0.15 0.08–0.22 0.21 0.11–0.31 0.23 0.12–0.33 2.7 × 10⁻⁵ UKB 6845 64,099 0.14 0.1–0.18 0.19 0.13–0.25 0.21 0.14–0.27 2.0 × 10⁻¹⁰
Estimates are calculated using LD-score regression (LDSC) at different population prevalences after trauma exposure for the combined PGC freeze 2 samples, and separately for PGC1.5 (without the UK biobank), the UK biobank, and for men and women. Number of SNPs ranges from 1,160,174 to 1,175,791
P-value is testing if h2SNPis different from zero and applies to all prevalences
PGC2 all European ancestry subjects of PGC freeze 2 (including the UK biobank), PGC1.5 European ancestry subjects in the PGC1.5 EUA (not including the UK Biobank subjects), UKB UK Biobank European subjects,h2SNPmean SNP-based heritability,95% CI 95% confidence interval, prev prevalence
was significant (h
2SNP
= 0.15, P = 1.38 × 10
−3) and not
signifi-cantly different (z
= 0.23, P = 0.41) from heritability in women
(h
2SNP
= 0.19, P = 2 × 10
−10). Sensitivity analyses in UKB using
different case and control definitions further confirm these results
(Supplementary Table 1 and Supplementary Note 1).
We also compared heritability across ancestries using the
GCTA GREML method, which allows analysis of admixed
populations when individual genotypes are available. GCTA
estimates in the smaller EUA data remained similar to LDSC on
the full data (Table
2
). Heritability in AFA was comparable to
estimates for EUA in the overall sample and when stratified by
sex.
Comparability of PGC2 studies and sex-specific analyses. A
comparison of heritability estimates in subsets of PGC2 studies
stratified by sex, ancestry, and characteristics of study (i.e.
PGC1.5 vs. the large UKB cohort) show significant estimates for
PTSD in the range of 10–20% (Tables
1
–
2
). This is with the
notable exception of PGC1.5 males (in EUA and AFA analyses),
which fail to show significant h
2SNP
, despite similar numbers of
PTSD cases compared to PGC1.5 women. To further evaluate the
comparability of PGC2 studies we estimated genetic correlations
(r
g) between subsets with different characteristics (Supplementary
Table 2).
As numerous small studies contribute to PGC1.5 (24 EUA
studies with N < 200 cases, Supplementary Table 3), we
first
investigated the contribution of small studies to the overall
genetic signal and genetic similarity to the larger PGC1.5 cohorts.
The combined subset of small studies showed significant overall
heritability (h
2SNP= 0.12, P = 0.046) and close to significant
genetic correlation with large studies (r
g= 0.45, P = 0.08),
indicating a meaningful genetic contribution in aggregate.
Subsetting PGC1.5 and UKB by sex showed a high genetic
correlation between women and men for UKB (r
g= 1.03, P =
1.6 × 10
−5), but no significant genetic correlation between women
and men in PGC1.5, which was expected, since h
2SNP
in PGC1.5
men is not significant. Next, focusing on PGC1.5 women only, a
comparison to UKB showed significant genetic correlations with
the overall UKB (r
g= 0.46, P = 0.0004) and UKB women (r
g=
0.46, P
= 0.0008), and a slightly lower, but marginally significant
correlation with the smaller UKB male data (r
g= 0.44, P =
0.052).
Overall, these
findings of significant heritability estimates for
PTSD and moderate to high genetic correlations between most
PGC2 subsets, including PGC1.5 to UKB (r
g= 0.73, P = 0.0005),
are promising for GWAS in these data.
GWAS in subjects of European and African ancestry. Our
largest PTSD meta-analysis in subjects of EUA (maximum
number of subjects included in EUA meta-analyses: N
= 23,212
cases, 151,447 controls, see Table
3
for details) identified two
independent, genome-wide significant loci (P < 5 × 10
−8), both
mapping to chromosome 6, and sex-stratified analyses in men
identified two additional loci (Fig.
1
a, b, respectively). The smaller
meta-analyses in AFA (N
= 4363 cases, 10,976 controls)
identi-fied one genome-wide significant locus, and an additional locus
was found in men when stratified by sex (Fig.
1
c, d, respectively).
No genome-wide significant associations were found in
meta-analyses of EUA or AFA women (Supplementary Fig. 3).
Regional plots of the six genomic regions can be found in
Supplementary Figs. 4–9. The six leading markers show odds
ratios of 1.12–1.33 and no significant heterogeneity across studies
(Table
3
). This is supported by PM-plots (posterior probability
that a SNP effect exists in a given study) showing a high
consistency of effects among the studies predicted to have an
effect
13(Supplementary Figs. 10–15). A z-test on the effect sizes
confirmed similar effects for men and women for the three
leading variants in the joint-sex analyses, and significant
sex-specificity for the three male hits identified in the sex-stratified
analyses (Supplementary Table 4).
Analyses across ancestry groups. In order to study whether the
genetic associations with PTSD vary across different ancestries,
we
first tried to replicate our six EUA and AFA top hits in the
other main ancestry groups (EUA, AFA and AMA, respectively).
No evidence of replication was found by directly comparing the
six leading markers, nor by investigating the larger genomic
regions harboring the signal (Supplementary Figs. 16–21). In
addition, we did not identify any genome-wide significant hits by
performing a trans-ethnic genome-wide meta-analysis across the
six main ancestry groups (N
= 29,556 cases and 166,145 controls)
under
fixed- and random-effect models (Supplementary Fig. 22).
While lack of replication of the 4 EUA hits may not be
conclusive due to limited power in the smaller AFA and AMA
data (Supplementary Tables 5–6), the 2 hits in AFA provided an
opportunity for a more detailed analysis of ancestry effects.
GWAS in the AFA subjects included standard PCs to control for
average admixture across the genome. However, to precisely infer
local ancestry across the genome of admixed subjects, we further
implemented a local ancestry inference (LAI) pipeline
(Supple-mentary Note 1 and Supple(Supple-mentary Fig. 23). We confirmed the
AFA top hit rs115539978 to be specific to the African ancestral
background (8% MAF on the African, and <1% MAF on the
Table 2 Comparison of heritability between European (EUA) and African ancestry (AFA) studies
Sample N N 10% prev 30% prev 50% prev
Cases Controls h2SNP 95% CI h2SNP 95% CI h2SNP 95% CI p-value
All EUA 9354 25,175 0.04 0.02–0.06 0.05 0.02–0.08 0.05 0.02–0.08 1.3 × 10⁻⁴ AFA 3163 9459 0.02 −0.04 to 0.09 0.03 −0.06 to 0.12 0.04 −0.06 to 0.13 0.22744 Men EUA 4412 17,380 0.02 −0.02 to 0.05 0.02 −0.02 to 0.07 0.03 −0.03 to 0.08 0.15951 AFA 1195 4361 0.02 −0.14 to 0.18 0.03 −0.2 to 0.25 0.03 −0.21 to 0.27 0.41127 Women EUA 4689 5874 0.08 0.03–0.13 0.12 0.05–0.19 0.13 0.05–0.20 4.0 × 10⁻⁴ AFA 1761 4435 0.12 −0.01 to 0.25 0.17 −0.01 to 0.35 0.18 −0.01 to 0.38 0.028
Analyses are performed using GCTA in both sexes and for men and women separately and include all subjects used in the EUA and AFA GWAS with access to individual-level genotype data. Number of SNPs ranges from 4,071,335 to 4,863,146.
P-value is testing if h2SNPis different from zero and applies to all prevalences
European and Native American backgrounds, respectively;
(Supplementary Table 7). Conversely, LAI analyses of the
male-specific hit indexed by rs142174523 showed no evidence for
ancestry-specific effects that would explain the lack of replication
in the EUA meta-analyses (Supplementary Table 8); however, the
LD-structure in the MHC locus is complex
14.
Integration with functional genomic data. Functional mapping
and annotation of the 6 GWAS hits using the FUMA pipeline
conservatively predicted
five genes ZDHHC14, PARK2, KAZN,
TMEM51-AS1 and ZNF813 located in EUA risk loci, and
five
distinct genes LINC02335, MIR5007, TUC338, LINC02571 and
HLA-B in AFA risk loci (Table
4
). In addition, gene-based
ana-lyses on 18,222 protein-coding genes based on the EUA and AFA
GWAS summary data identified two additional gene-wide
sig-nificant loci, represented by SH3RF3 (P = 4.28 × 10
−07) and
PODXL (P
= 2.37 × 10
−06) in the EUA analysis. Gene-based
analyses in AFA did not result in genome-wide significant loci.
The biological function and potential psychiatric relevance of the
12 genes predicted by FUMA are detailed in the Supplementary
Note 1 and discussed below.
We next performed gene-set analyses to understand implicated
genes in the context of pathways and found four significant,
Bonferroni-corrected gene sets (Supplementary Data 2). Of note,
the two gene sets identified in the EUA data point towards a role
for the immune system in PTSD. This is supported by a number
of TNF-related genes summarized in a significant gene-set
in AFA.
Annotation of variants in risk loci showed limited evidence of
functionality (Table
4
and Supplementary Note 1). Most notably
for the AFA top hit on chromosome 13, when testing for
chromatin interactions using Hi-C data in neural progenitor cells,
significant chromatin conformation interactions were observed
between the risk region and a region ~1100 kb upstream
harboring additional non-coding RNAs including LINC00458,
hsa-mir-1297 and LINC00558 as well as a region approximately
820 kb downstream harboring the pseudogene HNF4GP1
(Sup-plementary Fig. 24). eQTL analyses did not show significant
associations with gene expression. However, the lack of functional
data for this region may be explained by the African ancestry
specificity of the GWAS findings since databases available within
the FUMA framework, including GTEx and BrainSpan for eQTL
analyses, are predominantly based on European populations.
Thus, we expanded our analyses for the AFA top hit through
cell culture experiments in lymphoblastoid cell lines (LCLs) from
African subjects (see Methods and Supplementary Note 1). We
show
evidence
that
the
African-ancestry-specific SNP
rs115539978 seems to capture a genomic region that may
influence the expression of non-coding RNAs from this PTSD
risk locus in response to increased glucocorticoid receptor
signaling, thus linking this African-specific genetic variant to
stress response and non-coding RNA expression (Supplementary
Fig. 25).
We further characterized the AFA signal (rs115539978) using
psychophysiology and imaging datasets available through the
Grady Trauma Project (GTPC) and found evidence that this lead
SNP captures a genomic region that is also associated with
increased amygdala volume and fear psychophysiology in a
traumatized population (Supplementary Note 1 and
Supplemen-tary Fig. 26).
Replication of
findings in the external MVP cohort. In an
attempt to replicate our genomics
findings in an
adequately-powered external study we used the large MVP cohort, including
146,660 EUA and 19,983 AFA participants assessed for
Table
3
Meta-analyses
of
European
(EU
A)
and
African
(AFA)
ancestry
GWAS
Subject s Vari ant Chr A1 A1 freq Beta SE OR 95% CI P -valu e N cases N contr ols N eff ective # sign. ma rkers I 2 QN studies EUA All rs3 4517852 6 a 0.34 0.110 0.02 1.12 1.08 –1.16 3.1 × 10 − 9 12,080 33, 446 30,274* 4 14.23 0.22 41 All rs93 64611 6 t 0.13 − 0.124 0.02 0.88 0.85 –0.92 4.3 × 10 − 8 23,212 151 ,447 70,332 1 0.00 0.6 0 4 3 Men rs57 18486 62 19 t 0.61 − 0.139 0.02 0.87 0.83 –0.91 7.8 × 10 − 9 6263 22 ,971 16,964* 1 0.00 0.8 3 3 1 Men rs1487 57321 1 ctgtg 0.83 0.168 0.03 1.18 1.1 1– 1.26 3.7 × 10 − 8** 6263 22 ,971 16,964* 2 26.16 0.09 31 AFA All rs115 5399 78 13 t 0.07 0.284 0.05 1.33 1.2 0– 1.47 2.7 × 10 − 8 4363 10 ,976 11,322 10 13.95 0.28 21 Men rs142 174523 6 a 0.30 − 0.277 0.05 0.76 0.69 –0.84 4.3 × 10 − 8** 1782 5361 4702 1 0.00 0.76 13 Leading markers for genome-wide signi fi cant loci (at p< 5×1 0 − 8) in the overall and sex -strati fi ed analyses are reported. The imputation informa tion score ranges from 0.64 (rs3 4517852) to 1.16 (rs115539 978), with a median score ranging from 0.8 9 to 0.97. CHR chromosome ,A 1 allele 1 (coded allele), A1 freq A1 allele frequency, SE standard error, OR odds ratio, I 2heterogeneity index, Q p-value for Cochran ’s Q statis tic *Not imputed in UK biobank **Not genome-wid e signi fi cant when adjusting for sex -split analyses (p < 1.67 × 10 − 8)re-experiencing symptoms (REX), a core feature of PTSD
9. We
first compared the genetic signals between PGC2 PTSD and MVP
REX EUA and found a highly significant genetic correlation (r
g=
0.80, SE
= 0.096, P = 2.85 × 10
−17). No evidence of replication was
found for the six leading PTSD markers identified in PGC2 EUA
and AFA GWAS for the MVP REX-specific symptoms
(Supple-mentary Table 9). However, two of these markers were not directly
genotyped and had to be assessed by proxy markers in only
moderately high (~75%) LD, and sex-stratified analyses were not
available for MVP.
Polygenic risk scores (PRS) for PTSD. PRS generated from
well-powered GWAS have recently become a tool of high relevance for
polygenic disorders and traits (e.g. ref.
15,16). We assessed the
predictive value of PRS for PTSD, using our largest cohort, the
UKB, as a training sample (Fig.
2
a). Our analyses were strongest at
a p-value threshold P
T= 0.3 and showed a highly significant
increase in odds to develop PTSD across PRS quintiles in the
PGC1.5 EUA target sample, with a variance explained on the
liability scale of r
2= 0.0015 (likelihood ratio test P = 5.44 × 10
−7).
Analyses within the UKB show even stronger PRS predictability,
with the highest OR for UKB men with a PRS trained on UKB
women, reaching an OR of 1.39 in the 5th quintile, with an overall
variance explained of r
2= 0.012 (P = 4.19 × 10
−10).
We also tested the overall PGC2 PTSD PRS in the external
MVP replication cohort, using REX as the target for predictions.
PRS predictions were strongest at P
T= 0.3 and highly significant
(likelihood ratio test P
= 5.4 × 10
−62, Supplementary Fig. 27).
Mean REX symptoms in MVP EUA participants was 8.48 (4.59
SD), and participants in the 5th quintile of genetic risk had
significantly higher REX scores than subjects in the 1st quintile
(beta
= 0.58, P = 1.41 × 10
−48; Fig.
2
b).
Genetic correlation of PTSD with other traits and disorders.
Analysis of shared heritability across common disorders of the
brain
17and specific genetic correlations of psychiatric disorders
with cognitive, anthropomorphic and behavioural measures
10,18–20has been facilitated greatly by the development of a centralized
database of GWAS results including a web interface for LDSC
(LD Hub
21). We estimated pairwise genetic correlations (r
g
)
between PTSD and 235 disorders/traits and found 21 significant
correlations after conservative Bonferroni correction (Fig.
3
, panel
A and Supplementary Data 3). Genetic variation associated with
PTSD was positively correlated with PRS from other psychiatric
traits including depressive symptoms, schizophrenia and
neuroti-cism, as well as epidemiologically comorbid traits such as
insom-nia, smoking behavior, asthma, hip-waist ratio and coronary
artery disease. In contrast, negative r
gwith PTSD include subjective
10 8 6 –log10 ( p -v alue) 4 2 10 8 6 –log10 ( p -v alue) 4 2 10 8 6 –log10 ( p -v alue) 4 2 10 8 6 –log10 ( p -v alue) 4 2 1 2 3 4 5 6 7 Chromosomal positions rs9364611 rs115539978 rs142174523 rs148757321 rs571848662 rs34517852
a
b
c
d
8 9 10 11 12 14 16 18 21 1 2 3 4 5 6 7 Chromosomal positions 8 9 10 11 12 14 16 18 21 1 2 3 4 5 6 7 Chromosomal positions 8 9 10 11 12 14 16 18 21 1 2 3 4 5 6 7 Chromosomal positions 8 9 10 11 12 14 16 18 21Fig. 1 Manhattan plots from meta-analyses of PTSD GWAS, showing the top variants in six independent genome-wide significant loci. Results are shown for subjects of European (EUA;a) and African ancestry (AFA; c), and for sex-stratified analyses in EUA men (b) and AFA men (d), respectively. Sex-stratified analyses for women were not significant (Supplementary Fig. 4). The red line represents genome-wide significance at P < 5 × 10⁻⁸. Note: rs148757321 and rs142174523 do not remain significant after Bonferroni-adjustment for sex-stratified analyses (at P < 1.67 × 10⁻⁸)
well-being, education, and a strong correlation with parents’ age at
death (r
g= −0.70). Significant positive correlations were also
found for reproductive traits such as the number of children ever
born, and, as previously reported for women
22, PTSD was
nega-tively correlated with age at
first birth.
With the notable exception of asthma, our
findings on PTSD
correspond closely with genetic correlations between these traits
and other psychiatric disorders such as MDD
18, SCZ
23, BPD
19and ADHD
20(Fig.
3
, panels B-E). These
findings are not
surprising, as pleiotropic effects (i.e. SNPs impacting multiple
traits) have been widely reported for psychiatric disorders.
In order to test to what degree genome-wide significant
findings from our GWAS meta-analyses were specific to PTSD
rather than driven by correlated traits as identified above, we
adjusted the top hits from our analyses for the effects of
genetically correlated psychiatric traits. Since the strongest
correlations were found between PTSD and depressive symptoms
(r
g= 0.80) and MDD (r
g= 0.62), summary statistics from PGC
MDD
18, as well as MDD plus BPD and SCZ, were included in the
analyses. Using a recently implemented method applicable to
external GWAS summary data (mtCOJO
24) to approximate an
analysis where these traits are regressed out, we found that effect
sizes for the four EUA top hits were not markedly reduced when
adjusted for the effects of MDD, or all three psychiatric traits
tested simultaneously (Supplementary Tables 10, 11). These
findings indicate that the genetic variants identified here are
specific to PTSD when tested in the context of the three
psychiatric disorders genetically most significantly correlated
with PTSD.
Discussion
PTSD is a common and debilitating condition influenced by
genetic factors, yet common genetic risk variants for PTSD have
not been robustly identified. The PGC-PTSD combined data from
60 multi-ethnic cohorts (PGC1.5) and the UK Biobank (PGC2)
achieved a sample size of 206,655 participants with 32,428 PTSD
cases, over ten times that of any previous analysis
10,25. As has
been demonstrated in GWAS of SCZ
23, BPD
26, and recently in
MDD
18,27and ADHD
20, sample size is critical to produce robust
genome-wide significant hits that inform foundational knowledge
on the neurobiology of complex psychiatric conditions. These
results show this is also true of PTSD. This increased power has
led us to draw several major conclusions.
First, our genetic
findings squarely place PTSD among the
other psychiatric disorders in terms of heritability and genetic
relationship with other disorders. While this statement may seem
obvious to some, there remains debate about whether PTSD is
entirely a social construction
28. We found substantial SNP-based
heritability (i.e. phenotypic variation explained by genetic
dif-ferences) at 5–20%, similar to that for major depression
18across
methods, studies and ancestries. The heritability results and
pattern of genetic correlations are also consistent with our initial
findings
10and with those from twin studies. PTSD shares
com-mon variant risk with other psychiatric disorders, which show
substantial sharing of common variant risk with one another
29.
PTSD was most significantly (genetically) correlated with major
depression, but also with schizophrenia, both of which have
genome-wide significant loci implicated in brain function.
Second, our GWAS analyses identified several genetic loci not
previously associated with PTSD. These loci pointed to a number
of different target genes that merit further investigation. With
PARK2, there is a posited role of dopaminergic systems in PTSD.
The dopaminergic system has a critical role in fear conditioning
which is important in the development and maintenance of
PTSD
30. There is also epidemiological evidence for association of
Table
4
Functional
mapping
and
annotation
of
GWAS
meta-analyses
in
the
European
and
African
ancestry
data
Group GWAS hit lead variant #SNPs in LD (r 2 > 0.6) genomic coordinate risk locus (hg19) predicted genes in risk locus SNPs in LD with CADD scores > 12.37 SNPs in LD with RegulomeDB scores < 5 Chromatin state analysis (Roadmap Epigenomics) in neuronal cell lines/tissues a eQTL Hi-C in 3 neuronal tissue/ cell line datasets, GSE87112 EUA All rs34517852 20 chr6: 157,780,424 –157,801,753 ZDHHC14 (upstream ofTSS ) rs35262389 = 15.28 rs9348095 = 1 (TSS site) Transcriptional active chromatin at TSS None Yes, with downstream elements rs9364611 12 chr6: 162,157,139 –162,168,506 PARK2 (intronic) None None Overall quiecent, some enhancer function None Yes, intronic within the same intron Men rs571848662 5 chr19: 53,988,841 –53,990,834 ZNF813 None None Weak transcription None None rs148757321 10 chr1: 15,427,801 –15,449,791 KAZN and TMEM51- AS1 None None None Signi fi cant interaction with regions further upstream of KAZN AFR All rs115539978 61 chr13: 55,652,129 –55,759,209LINC02335, MIR5007, TUC338
None None Overall silenced chromatin (score of 15), some SNPs map to loci with weak transcription or enhancer function None Interaction between risk locus and upstream region harboring LINC00458 ,MIR1297 , and LINC00558 as well as downstream region harboring HNF4GP1 Men rs142174523 237 chr6: 31,257,622 –31,319,815 (MHC locus ) LINC02571, HLA-B None many b Overall PolyComb repressed chromatin, heterochromatin 16 c None GWAS in females of European and African ancestry did not identify genome-wide signi fi cant hits TSS transcriptional start site, eQTL expression quantita tive trait locus (in 28 neuronal tissue/ cell lines from Commo nMind Co nsortium, BRAINEA C o r GTEx v7) aIn neurona l cell lines/ti ssues E053, E054, E067, E068, E069, E070, E071, E072, E073, E074, E081, E082, E125 bSee http://fu ma.ctglab.nl/browse 30 –32 for a visualization of these resul ts cATP6 V1G2, C4A, C4B, CCHCR 1, CYP2 1A1P, DDR1, HCG27, HLA-B, HLA-C, MICB, NOTC H4, POU5F1, PSORS1C3, SKIV2L, VARS and VARS2
Parkinson Disease and PTSD
31–33. PODXL is involved in neural
development and synapse formation
34, SH3RF3 is associated with
neurocognition and dementia
35,36, ZDHHC14 is associated with
regulation of
β-adrenergic receptors
37,38, and KAZN is expressed
in the brain
39, where it has been found to be underexpressed in
parvalbumin neurons of the superior temporal cortex of
schizo-phrenia cases
40and overexpressed in the substantia nigra of
Parkinson’s cases
41. Finally, the HLA-B complex may be related
through the known role of immunity and inflammation in
stress-related disorders
42,43. Less is known about the role of the
iden-tified RNAs LINC02335, MIR5007, TUC338 and LINC02571 in
regards to the biology of PTSD. However, preliminary work from
our group including imaging and psychophysiology highlights the
value of deep phenotyping in conducting functional
investiga-tions into the meaning of GWAS
findings
8. Extensive follow-up
work is needed to replicate our
findings and to determine the
function of identified genes and their relationship to putative
pathological processes. For example, in SCZ the MHC locus is
now thought to influence risk, in part, through pruning of
synapses using immune machinery rather than through classical
immune pathways
44. These ancestry-specific results are
pre-liminary, and even larger PTSD GWAS will facilitate the
identi-fication of plausible neurobiological targets for PTSD.
Third, our results also illustrate that there may be genetic
contributions to the well-documented association between PTSD
and dysregulation in inflammatory and immune processes
45. It
has been widely recognized that PTSD is associated with a broad
range of adverse physical health conditions over the life course
ranging from type-2-diabetes and cardiovascular disease to
dementia and rheumatoid arthritis
46,47. Less is known about the
biological mechanisms driving the relationship between PTSD
and these outcomes. Our genetic correlation analyses may
pro-vide some initial clues for further investigation. For example, we
found a high genetic correlation (r
g= 0.49, P = 0.0002) between
PTSD and asthma. Our subsequent gene-set and pathway
ana-lyses provide some clues further implicating the immune system.
Of note, these genetic results converge with evidence from
epi-demiologic cohort studies documenting the role of stress-related
disorders such as PTSD in autoimmune diseases
48, case-control
studies showing elevations of immune-related biomarkers in
women with PTSD
49, and epigenetic studies pointing to the role
of the immune system in PTSD etiology
50,51. Further work is
needed to determine whether PTSD has genetic overlap with
immune disorders broadly and the causal direction between
disorders. At minimum, the emerging genetic evidence presented
here suggests that association between PTSD and health
condi-tions may, in some cases, have some genetic origin.
Fourth, PGC-PTSD is distinct in relation to current genomics
consortia due to its high proportion of data from participants of
diverse ancestries. For example, a recent review found that only
three percent of all samples in genetic studies were from African
ancestry
52. This contrasts sharply with the 10% of AFA
1.8 Training → Target UKB women → UKB men UKB men → UKB women UKB → PGC 1.5 1.6 1.4 1.2 Quintile odds r atio (95% Cl) 1.0 0.8 1 2 3 PRS quintile 4 5 0.8 Training → Target PGC2 → MVP 0.6 0.4 0.2 Quintile beta (95% Cl) 0.0 1 2 3 PRS quintile 4 5
Fig. 2 Genetic risk score (PRS) predictions for PTSD. a Using PTSD subjects from the UK Biobank (UKB) as discovery sample, odds ratios (OR) for PTSD per PRS quintile relative to thefirst quintile show a significant increase in different PGC PTSD target samples. For example, UKB men in the 5th quintile have 40% higher odds to develop PTSD than UKB men in the lowest quintile, when using women from the same population as a training set.b PRS predictions of re-experiencing symptoms in the external replication cohort from the Million Veteran Program (MVP) using the overall PGC2 as discovery sample show a highly significant increase in PTSD re-experiencing symptoms per PRS quintile. Sample sizes in different training and target sets include: UKB women: 6845 PTSD, 64,099 controls; UKB men: 3,544 PTSD, 51,700 controls; UKB: 10,389 PTSD, 115,799 controls; PGC1.5: 10,213 PTSD, 27,445 controls; PGC2: 23,212 PTSD, 151,447 controls; MVP: 146,660 participants with re-experiencing symptoms assessments. Analyses include only subjects of European ancestry
participants in our consortium. We have the
first heritability
estimates for PTSD in African ancestry: they are similar to EUA,
highly significant in women and lower in men. Our GWAS in
subjects of African ancestry indicated at least one
ancestry-specific locus using local ancestry methods developed for this
analysis. We note the sample size in the AFA analysis has only
about 15,000 participants, which is small and under-powered,
increasing the chance for false positives. However, other work has
shown that genetic studies of underrepresented populations
afford the opportunity to discover novel loci that are invariant in
European populations
53. As others have noted, there are major
limitations in our knowledge of the genetic and environmental
risk architecture of psychiatric disorders in persons of African
descent
54. Our
findings provide further evidence of the need to
invest in research that includes diverse ancestral populations, to
expand reference data, and to continue to develop methods to
analyze data from such populations. Until such an investment is
made, we are limited in our ability to understand biological
mechanisms, predict genetic risk
55, and produce optimal
treat-ments for non-European populations. African genomes are
characterized by shorter haplotype blocks and contain many
millions more variants per individual than populations outside
Africa
56. Further, including data from African populations in
genetic studies of PTSD and other neuropsychiatric disorders
may accelerate genetic discovery and could be useful for
fine
mapping disease causing alleles
57.
Fifth, although PTSD heritability remained relatively stable
across methods, studies, and ancestries, sex differences in
herit-ability were observed in the overall cohort analyses as well as in
the AFA analyses
10. It is of note that the sex differences in
her-itability were not evident in the UK Biobank data, which we
hypothesize is due to differences between the PGC1.5 cohorts and
the UK Biobank. PTSD is conditional on trauma exposure, which
is also highly heterogeneous across individuals and populations
58.
Unlike PGC1.5, the UK Biobank cohort is comprised of few to no
subjects who experienced military-related trauma. In contrast, a
substantial proportion of men in the PGC1.5 cohorts were from
military cohorts, while virtually all women were civilians. The
environmental experiences (e.g. military versus civilian) and
index traumatic events leading to PTSD in male subjects versus
female subjects could explain observed lower heritability
esti-mates in males in the PGC1.5 cohorts. In future work, we aim to
investigate this empirically by pooling detailed trauma and PTSD
phenotypic information on both males and females and by
modeling the effects of measurement variability on heritability
estimates. Future work could also aim to increase samples of
civilian men and military women to allow for analyses stratified
by military trauma and sex.
Lastly, we report a significant polygenic risk score for PTSD,
which also significantly predicts re-experiencing symptoms in
independent data from the MVP
9. However, larger sample sizes
are needed to achieve sensitivity and specificity at levels of clinical
utility
16. In the future, polygenic risk may eventually be useful in
algorithms developed to identify vulnerable persons after
expo-sure to trauma. PTSD is one of the most theoretically preventable
mental disorders, as many people exposed to trauma come to
clinical attention in
first response settings such as emergency
rooms, intensive care units, and trauma centers. Controlled
clinical trials show that PTSD risk can be significantly reduced by
early preventive interventions
59,60. However, these interventions
have nontrivial costs, making it infeasible to offer them to all
persons exposed to trauma, given that only a small minority goes
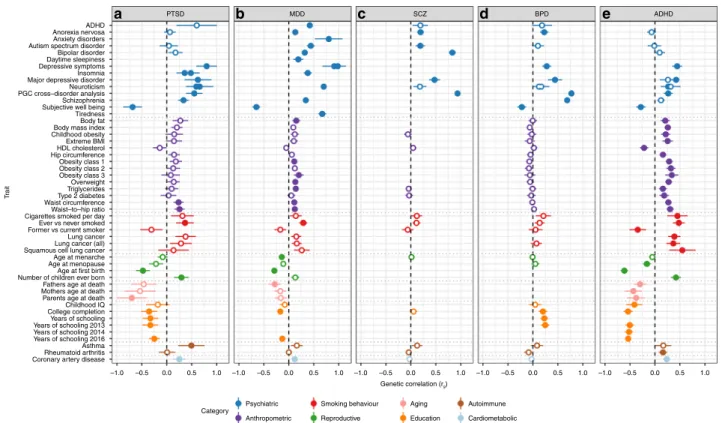
T rait ADHD PTSD
a
b
MDDc
SCZd
BPDe
ADHD Anorexia nervosa Anxiety disorders Autism spectrum disorder Bipolar disorder Daytime sleepiness Depressive symptoms Insomnia Major depressive disorder Neuroticism PGC cross–disorder analysis Subjective well being Body fat Body mass index Childhood obesity Extreme BMI HDL cholesterol Hip circumference Obesity class 1 Obesity class 2 Obesity class 3 Overweight Triglycerides Type 2 diabetes Waist circumference Waist–to–hip ratio Cigarettes smoked per day Ever vs never smoked Former vs current smoker Lung cancer Lung cancer (all) Squamous cell lung cancer Age at menarche Age at menopause Age at first birth Number of children ever born Fathers age at death Mothers age at death Parents age at death Childhood IQ College completion Years of schooling Years of schooling 2013 Years of schooling 2014 Years of schooling 2016 Rheumatoid arthritis Coronary artery diseaseCategory
Psychiatric Smoking behaviour
Anthropometric Aging Reproductive Autoimmune Education –1.0 Cardiometabolic –0.5 0.0 0.5 1.0 –1.0 –0.5 0.0 0.5 1.0 –1.0 –0.5 0.0 Genetic correlation (rg) 0.5 1.0 –1.0 –0.5 0.0 0.5 1.0 –1.0 –0.5 0.0 0.5 1.0 Asthma Tiredness Schizophrenia
Fig. 3 Commonality of genetic correlations between PTSD and other psychiatric disorders and traits with GWAS summary statistics on LD Hub. Psychiatric traits includea PTSD, b MDD, c SCZ, d BPD and e ADHD and their genetic correlations with traits from psychiatric, anthropomorphic, smoking behavior, reproductive, aging, education, autoimmune and cardiometabolic categories. Only traits with at least one significant correlation with the 5 psychiatric disorders are shown. Error bars indicate 95% confidence limits. Solid points indicate significant correlation after Bonferroni correction. The total number of correlations tested were 235 for PTSD, 221 for MDD, 172 for SCZ, 196 for BPD and 219 for ADHD
on to develop PTSD
61,62. They are also unnecessary for many
survivors who recover spontaneously
59. To be cost-effective, risk
prediction rules are needed to identify which exposed persons are
at high risk of PTSD. Such risk prediction tools have been
developed
63,64, but none to date has included polygenic risk as a
predictor.
These
findings advance our understanding of the genetic basis
of PTSD, but they also demonstate that PGC-PTSD remains
under-powered for the detection of most risk loci and associated
pathways. PTSD is similar to major depression in both prevalence
(among trauma-exposed persons) and in heritability. There are
now 100 genome-wide significant signals for major depression;
notably, that level of discovery required 246,363 cases and
561,190 controls
27. Other limitations include the treatment of
PTSD as a binary disorder in our analysis. Extensive
epidemio-logic work has shown that subthreshold PTSD is highly prevalent
and debilitating
65,66. In our analysis, persons with subthreshold
PTSD are classified as controls, which would likely reduce our
power to
find genetic associations. In future work, we will
con-sider PTSD as a continuous phenotype as well as examine clusters
of PTSD symptoms, which are more homogeneous. Of note,
Gelernter et al. (2019) recently found multiple genome-wide
significant loci for re-experiencing symptoms, which is the cluster
of symptoms most unique to PTSD, in data from over 100,000
veterans in the Million Veteran Program
9. Finally, we used
mostly unscreened controls, but controls carefully screened for
trauma may increase power since trauma is required for a PTSD
diagnosis. In addition to increasing sample size, we aim in the
future to also pool item-level phenotypic data from our cohorts in
order to address these limitations.
Advances in understanding the genomic architecture of PTSD
are critical for understanding the pathophysiology of this
debili-tating syndrome and to developing novel biologically-based
treatment approaches. The current data from a PTSD GWAS in
>195,000 participants advances our understanding of the genetic
underpinnings of PTSD and trauma-related disorders.
Methods
Participating studies. The PGC-PTSD Freeze 2 dataset (PGC2) includes 60 ancestrally diverse studies from Europe, Africa and the Americas. Of these, 12 were already included in Freeze 110. Study details and demographics can be found in
Supplementary Data 1. PTSD assessment was based either on lifetime (where possible) or current PTSD (i.e. including participants with a potential lifetime PTSD diagnosis as controls), and PTSD diagnosis was established using various instruments and different versions of the DSM (DSM-III-R, DSM-IV, DSM-5). For GWAS analyses, all studies provided PTSD case status as determined using stan-dard criteria and control subjects not meeting the PTSD diagnostic criteria (see Supplementary Data 1 for additional exclusion criteria). The majority of controls was trauma-exposed. A detailed description of the studies included is presented in Supplementary Methods. We have complied with relevant ethical regulations for work with human subjects. All subjects provided written informed consent and studies were approved by the relevant institutional review boards and the UCSD IRB (protocol #16097×).
Data assimilation. Subjects were genotyped on a range of Illumina genotyping arrays (exception: UKB was genotyped on the Affymetrix Axiom array). At the time of analysis, direct access to individual-level genotypes was permitted for 65,555 subjects. For these, pre-QC’ed genotype data were deposited on the LISA server for central data processing and analysis, using the standard PGC pipelines (https://sites.google.com/a/broadinstitute.org/ricopili/) and (https://github.com/ orgs/Nealelab/teams/ricopili). Studies with data sharing restrictions (eight studies, N= 137,114 subjects) performed analyses off site using identical pipelines unless otherwise indicated (Supplementary Data 1). Such studies then shared summary results for meta-analyses.
Global ancestry determination. To determine consistent global ancestry estimates across studies, each subject was run through a standardized pipeline, based on SNPweights67of 10,000 ancestry informative markers genotyped in a reference
panel including 2911 unique subjects from 71 diverse populations and six con-tinental groups (K= 6)68(https://github.com/nievergeltlab/global_ancestry).
Pre-QC genotypes were used for these analyses.
For the present GWA studies, subjects were placed into three large, homogeneous groupings, using previously established cut-offs (Supplementary Table 12): European and European Americans (EUA; subjects with≥90% European ancestry), African and African-Americans (AFA; subjects with≥5% African ancestry, <90% European ancestry, <5% East Asian, Native American, Oceanian, and Central-South Asian ancestry; and subjects with≥50% African ancestry, <5% Native American, Oceanian, and <1% Asian ancestry), and Latinos (AMA; subjects with≥5% Native American ancestry, <90% European, <5% African, East Asian, Oceanian, and Central-South Asian ancestry). Native Americans (subjects with≥60% Native American ancestry, <20% East Asian, <15% Central-South Asian, and <5% African and Oceanian ancestry) were grouped together with AMA. All other subjects were excluded from the current analyses (N= 6,740). Supplementary Fig. 1 shows the ancestry grouping used for GWAS of 69,484 subjects for which individual-level genotype data was available to the PGC. The ancestry pipeline was shared with external sites in order to ensure consistency in ancestry calling across cohorts.
Genotype quality control. The standard PGC pipeline RICOPILI was used to perform QC, but modifications were made to allow for ancestrally diverse data. In the modified pipeline, each dataset was processed separately, including subjects of all ancestries. Sample exclusion criteria: using SNPs with call rates >95%, samples were excluded with call rates <98%, deviation from expected inbreeding coefficient (fhet<−0.2 or >0.2), or a sex discrepancy between reported and estimated sex based
on inbreeding coefficients calculated from SNPs on X chromosomes. Marker exclusion criteria: SNPs were excluded for call rates <98%, a > 2% difference in missing genotypes between cases and controls, or being monomorphic. Hardy-Weinberg equilibrium (HWE): the modified pipeline identified the largest homo-genous ancestry group in the data, identified SNPs with a HWE P-value < 1 × 10⁻⁶
in controls, and excluded these SNPs in all subjects of the specific datasets, irre-spective of ancestry.
Relatedness within studies. Within-study relatedness was estimated using the IBS function in PLINK 1.969. From each pair with relatedness^π > 0.2, one
indi-vidual was removed from further analysis, retaining cases where possible.
Calculation of principal components (PC’s) for GWAS. For each dataset, unrelated subjects were subset into the three ancestry groups (EUA, AFA, AMA; Supplementary Tables 3, 5, 6) for analysis. SNPs were excluded that had a MAF <5%, HWE P > 1 × 10⁻³, call rate <98%, were ambiguous (A/T, G/C), or due to being located in the MHC region (chr. 6, 25–35 MB) or chromosome 8 inversion (chr. 8, 7–13 MB). SNPs were pairwise LD-pruned (r2> 0.2) and a random set of
100 K markers was used for each subset to calculate PC’s based on the smartPCA algorithm in EIGENSTRAT70.
Imputation. Imputation was based on the 1000 Genomes phase 3 data (1KGP phase 371). Any dataset using a human genome assembly version prior to GRCh37
(hg19) was lifted over to GRCh37 (hg19). SNP alignment proceeded as follows: for each dataset, SNPs were aligned to the same strand as the 1KGP phase 3 data. For ambiguous markers, the largest ancestry group was used to calculate allele fre-quencies and only SNPs with MAF <40% and≤15% difference between matching 1KGP phase 3 ancestry data were retained. Pre-phasing was performed using default settings in SHAPEIT2 v2.r83772without reference subjects, and phasing
was done in 3 megabase (MB) blocks, where an additional 1 MB of buffer was added to either end of the block. Haplotypes were then imputed using default settings in IMPUTE2 v2.2.273, with 1KGP phase 3 reference data and genetic map,
a 1 MB buffer, and effective population size set to 20,000. RICOPILI defaultfilters for MAF and Info were removed since analyses were run across ancestry groups at this step. Imputed datasets were deposited with the PGC DAC and are available for approved requests.
Main GWAS. The analysis strategy for the main association analyses is shown in Supplementary Tables 3, 5 and 6. Analyses were performed separately for each study and ancestry group, unless otherwise indicated. The minimum number of subjects per analysis unit was set at 50 cases and 50 controls, or a total of at least 200 subjects, and subsets of smaller size were excluded. Smaller studies of similar composition were genotyped jointly in preparation for joint analyses (e.g. PSY1, PSY3). For studies with unrelated subjects, imputed SNP dosages were tested for association with PTSD under an additive model using logistic regression in PLINK 1.9, including thefirst five PC’s as covariates. For family and twin studies (VETSA, QIMR), analyses were performed using linear mixed models in GEMMA v0.9674,
including a genetic relatedness matrix (GRM) as a random effect to account for population structure and relatedness, and thefirst five PC’s as covariates. The UKB data (UKB) were analyzed with BGenie v1.2 (https://www.biorxiv.org/content/
early/2017/07/20/166298) using a linear regression with 6 PC’s, and batch and
center indicator variables as covariates (see Supplementary Methods for additional details). In addition, all GWAS analyses were also performed stratified by sex.
Meta-analyses. Summary statistics on the linear scale (from GEMMA and BGenie) were converted to a logistic scale prior to meta-analysis (for formula see75). Within each dataset and ancestry group, summary statistics werefiltered to
MAF≥1% and PLINK INFO score ≥0.6. Meta-analyses across studies were performed within each of the three ancestry groups and across all ancestry groups. Inverse variance weightedfixed effects meta-analysis was performed with METAL (v. March25 2011)76. Heterogeneity between datasets was tested with a Cochran
test and for nominally significant Q-values, a Han-Eskin random effects model (RE-HE) meta-analysis was performed with METASOFT v.2.0.177. Markers with
summary statistics in less than 25% of the total effective sample size or present in less than three studies were removed from meta-analyses. Quantile-quantile (QQ) plot of expected versus observed−log10p-values included genotyped and imputed
SNPs at MAF≥1%. The proportion of inflation of test statistics due to the actual polygenic signal (rather than other causes such as population stratification) was estimated as 1—(LDSC intercept—1)/(mean observed Chi-square—1), using LD-score regression12(LDSC).
For primary analyses, genome-wide significance was declared at P < 5 × 10⁻⁸.
To account for multiple comparisons in analyses stratified by sex, genome-wide significance was also considered at P < 1.67 × 10⁻⁸. For genome-wide significant
hits, Forest plots and PM-Plots were generated using the programs METASOFT with default settings and M-values were generated using the MCMC option13,78.
For a given study and SNP, the M-value is the posterior probability that there is a SNP effect in that study. Studies with values <0.1 are predicted to have no effect, values≥0.1 and ≤0.9 are ambiguous, and values >0.9 are predicted to have an effect. In PM-plots, M-values are plotted against -log10P-values. Regional association
plots were generated using LocusZoom79with 400KB windows around the index
variant and compared to the corresponding windows in the other ancestry groups, including the 1000 Genomes Nov. 2014 reference populations EUR, AFR and AMR, respectively. To test for sex-specific effects, a z-test was performed on the difference of the effect estimates from male and female sex-stratified analyses. Estimating PTSD heritability. SNP-based heritability estimates (h2SNP) in EUA
subjects were calculated using LDSC on meta-analysis summary data. Estimates were calculated for the combined PGC freeze 2 samples (PGC2) and separately for PGC1.5 (without UKB), the UK biobank (including alternative subject/phenotype selections), and for men and women. Unconstrained regression intercepts were used to account for potential inclusion of related subjects and residual population stratification, and precomputed LD scores from 1KGP EUR populations were used. For population prevalence we used a range of values (conservative low at 10%, moderate at 30%, and very high at 50%), based on prevalences reported for subjects exposed to different types of trauma80. Sample prevalence was set to the actual
proportion of cases in each set of data. To estimate h2
SNPin admixed individuals and compare h2SNPacross different
ancestries, individual-level genotype data was analyzed using an unweighted linear mixed model81as implemented in the LDAK software82. For each ancestry group
(EUA and AFA, respectively), imputed individual-level genotype data werefiltered to bi-allelic SNPs with MAF≥1% in the corresponding 1KGP phase
3 superpopulation. Imputed genotype probabilities≥0.8 were converted to best-guess genotype calls, and for each ancestry group, studies were merged and SNPs with <95% genotyping rate or MAF <10% removed. Next, to estimate relatedness between subjects, a genetic relatedness matrix (GRM) was constructed based on autosomal SNPs that were LD pruned at r2> 0.2 over a 1MB window, and an
unweighted model withα = −1, where α is the power parameter controlling the relationship between heritability and MAF. To prevent bias of h2SNPdue to cryptic
relatedness, strict relatednessfilters were applied. For pairs with relatedness values > the negative of the smallest observed kinship (−0.014 for EUA and −0.045 for AFA, respectively), one subject was randomly removed. PC’s were then calculated in the remaining sets of unrelated subjects. Finally, to estimate h2SNP, an
unweighted GRM was estimated without LD-pruning, and h2SNPwas calculated on
the liability scale using REML in LDAK, including 5 PC’s and dummy indicator variables for study (number of studies - 1) as covariates.
Comparability of PGC2 studies. To compare the genetic signal between specific PGC2 subsets, LDSC12was used to estimate heritability and genetic correlations.
Small EUA studies with N < 200 cases and total effective sample size of N < 500 were selected (N= 24 studies; GWAS including 2102 cases and 7366 controls, effective N= 5162) and compared to larger studies. To reduce standard error given this relatively small sample, we estimated heritability with the LDSC intercept constrained to 1, afterfirst testing that the intercept was not significantly different from 1.
Replication study. Data from the US Million Veteran Program (MVP) were used to replicate GWASfindings9. Participants reported here completed the PCL-C that
asked respondents to report how much they have been bothered in the past 30 days by symptoms in response to stressful experiences (i.e. not just military experiences). The symptom cluster most distinctive for PTSD, re-experiencing symptoms (range 5–25), was analyzed. After accounting for missing phenotype data, the final sample for European Americans was 146,660, of whom 41.3% were combat-exposed.
Genotyping was accomplished via a 723,305-SNP Affymetrix Axiom biobank array, customized for the MVP. Imputation was performed with Minimac 383and the
1000 Genomes Phase 3 reference panel. GWAS analysis was conducted using RVTEST84using linear regression with thefirst 10 principal components, age, and
sex included as covariates. The results werefiltered with imputation quality score R2≥ 0.9, MAF > 0.01 and HWE test P-value > 1 × 10-06. LDSC was used to estimate
genetic correlation with the PGC2 EUA sample. The PGC2 EUA GWAS summary statistics were used to estimate PRS in MVP samples, where linear regression was then used to test for association between PRS and re-experiencing symptoms. Local ancestry deconvolution. A pipeline was developed to determine local ancestry in subjects with African and/or Native American admixture (AFA, AMA; Supplementary Fig. 28). Additional QC to consistently prepare cohort data for downstream analysis was performed with a custom script (https://github.com/ eatkinson/Post-QC). Post-QC steps involved extracting autosomal data, removing duplicate loci, updating SNP IDs to dbSNP 144, orienting data to the 1KGP reference (with removal of indels and loci that either were not found in 1KGP or that had different coding alleles),flipping alleles that were on the wrong strand, and removing ambiguous SNPs.
Data harmonization and phasing: We then intersected and jointly phased the post-QC’ed cohort data with autosomal data from 247 1KGP reference panel individuals, removing conflicting sites and flipping any remaining strand flips. The merged dataset was thenfiltered to include only informative SNPs present in both the cohort and reference panel using afilter of MAF ≥ 0.05 and a genotype missingness cutoff of 90%. The program SHAPEIT285was used to phase
chromosomes, informed by the HapMap combined b37 recombination map86.
Individuals from the cohort and reference panel were then separated and exported as harmonized sample and reference panel VCFs to be fed into RFMix87.
Reference panel: Three ancestral populations of European, African, and Native American ancestry were chosen for the admixed AFA cohorts based on ancestry proportion estimates from SNPweights runs. All reference populations were taken from 1KGP phase 3 data71. Specifically, 108 West African Bantu-speaking YRI
were used as the African reference population, 99 CEU comprised the European reference, and 40 PEL of >85% Native American ancestry were used as the Native American reference panel. Individuals used as the reference panel can be found on (https://github.com/eatkinson).
Local ancestry inference (LAI) parameters: LAI was run on each cohort separately using RFMix version 287(https://github.com/slowkoni/rfmix) with 1 EM
iteration and a window size of 0.2 cM. We used the HapMap b37 recombination map86to inform switches. The -n 5flag (terminal node size for random forest
trees) was included to account for an unequal number of reference individuals per reference population. We additionally used the --reanalyze-referenceflag, which recalculates admixture in the reference samples for improved ability to distinguish ancestries.
Local ancestry of genome-wide significant variants: Haplotypes of the genomic regions around genome-wide significant associations were aligned to the local ancestry calls according to genomic position. To compare MAF of top hits on different ancestral backgrounds within a specific admixed population (AFA or AMA), subjects were grouped according to the number of copies (1 or 2) of a specific ancestry (European, African, and Native American, respectively) at that position. For a given SNP, MAF was calculated within each of the six groups. To ensure successful elimination of population stratification by standard global PC’s in regression analyses of admixed populations, two (out of 3, to reduce redundancy) local ancestry dosage covariates were included, coded as the number of copies (0, 1 or 2) from a given ancestral background. Finally, to compare if effects of the minor allele depend on a specific ancestral background (European, African, and Native American), for each SNP, we coded variables that counted the number of copies of the minor allele per ancestral background. Association between these three variables and PTSD were jointly evaluated using a logistic regression, including study indicators andfive global ancestry PC’s as additional covariates. Functional mapping and annotation. We used Functional Mapping and Anno-tation of genetic associations (FUMA) v1.3.0 (https://fuma.ctglab.nl/) to annotate GWAS data and obtain functional characterization of risk loci. Annotations are based on human genome assembly GRCh37 (hg19). FUMA was used with default settings unless stated otherwise. The SNP2Gene module was used to define inde-pendent genomic risk loci and variants in LD with lead SNPs (r2> 0.6, calculated
using ancestry appropriate 1KGP reference genotypes). SNPs in risk loci were mapped to protein-coding genes with a 10 kb window. Functional consequences for SNPs were obtained by mapping the SNPs on their chromosomal position and reference alleles to databases containing known functional annotations, including ANNOVAR, Combined Annotation Dependent Depletion (CADD), RegulomeDB (RDB), and chromatin states (only brain tissues/cell types were selected). Next eQTL mapping was performed on significant (FDR q < 0.05) SNP-gene pairs, mapping to GTEx v7 brain tissue, RNA-seq data from the CommonMind Con-sortium and the BRAINEAC database. Chromatin interaction mapping was performed using built-in chromatin interaction data from the dorsolateral pre-frontal cortex, hippocampus and neuronal progenitor cell line. We used a FDR q < 1 × 10⁻⁵to define significant interactions, based on previous recommendations,