UNIVERSIDADE DE LISBOA
FACULDADE DE CIÊNCIAS
DEPARTAMENTO DE BIOLOGIA ANIMAL
Phylogeny and phylogeography of Atlantic
Islands’ Columba species
Ana Catarina Gonçalves Dourado
Mestrado em Biologia Humana e Ambiente
UNIVERSIDADE DE LISBOA
FACULDADE DE CIÊNCIAS
DEPARTAMENTO DE BIOLOGIA ANIMAL
Phylogeny and phylogeography of Atlantic
Islands’ Columba species
Ana Catarina Gonçalves Dourado
Mestrado em Biologia Humana e Ambiente
Dissertação orientada por: Profª. Doutora Deodália Dias
Prof. Doutor Octávio Paulo
i
Nota prévia
A presente Tese de Mestrado está escrita na língua inglesa para ser posteriormente adaptada a uma publicação científica numa revista internacional.
Molecular Ecology foi a revista escolhida como modelo para a elaboração das referências bibliográficas por ser uma conceituada revista da área temática em que a presente Tese se insere.
ii
Agradecimentos
Parece que é habitual agradecer às pessoas que de alguma forma contribuíram para que uma tese pudesse ser efectuada. Não fugirei à regra!
Pela proposta do tema desta tese, incentivo, orientação e apoio durante estes longos meses (mais do que inicialmente desejado!), agradeço à Professora Deodália Dias e ao Professor Octávio Paulo.
Inês Silva e Pedro Didelet Pereira: foram vocês que me deram a conhecer as rotinas laboratoriais quando ainda era voluntária (juntamente com a Mariaaa), e por isso vos agradeço.
Agradeço ao Dr. Paulo Oliveira por me ter fornecido algumas amostras e à Joana Gomes, que de uma forma tão prestável as entregou pessoalmente. Agradeço também ao Professor Godfrey Hewitt, com quem brevemente pude discutir os resultados desta tese.
Há pessoas a quem eu não me posso esquecer de agradecer: colegas dos grupos DDias e CoBiG2! A todos vós, OBRIGADO! E não agradeço apenas os conselhos, a ajuda quando o computador (dizia eu!) não funcionava, mas sobretudo a AMIZADE. Tu, Joana Costa, a certa altura já nem me devias poder ouvir, a queixar-me das dificuldades no laboratório, da análise dos dados… e quanto à escrita da tese isso então nem se fala! Mas não eras a única, uma vez que também vocês, Ana Margarida Lopes, Ana Sofia Rodrigues, Bruno Vieira, Eduardo Marabuto, Eva Rolo, Francisco Pina-Martins, Raquel Vaz (a nossa aquisição da BD), Rita Oliveira Dario e Sara Silva me iam ajudando com as usuais dificuldades de uma tese. Mas também não esqueço a amizade e companhia que a Ana Vieira, Diogo Silva, Inês Modesto, Patrícia Brás, Renata Martins, Sofia Seabra e Vera Nunes me proporcionaram!
Eduardo, Joana, Bruno, Sofia, Vera e Rita: pela paciência, disponibilidade e preciosas sugestões durante a escrita da tese, vocês merecem um agradecimento especial. MUITO OBRIGADO!
Aos colegas de laboratório que me fizeram companhia ao som da Rádio Comercial, principalmente nos fins-de-semana e feriados em que pessoas ditas normais e com vida social estariam em qualquer outro lugar, obrigado. Os fins-de-semana nunca mais serão os mesmos sem uma ida à Faculdade para fazer uns quantos PCRs e electroforeses!
Alguns amigos fora do contexto da Faculdade foram fundamentais, visto que uma tese não se constrói apenas dentro das paredes do laboratório ou da tão fria de Inverno e quente de Verão sala de bolseiros! A ti, Ana Lúcia Pereira, muito obrigado por me ires aturando, e me
iii
obrigares a distrair quando a vontade não era essa. Também vocês, Filipa Nunes, Lese Costa, Lucas Coito, Maria Tavares e Rui Nunes foram importantes nas longas conversas ao telefone, nos divertidos jantares, nos passeios pela cidade e nos cafés no sítio do costume. E claro que nunca se esqueciam de fazer a tão famosa pergunta sempre que me viam: Então, como vai essa tese?!?
E a vocês, Pai e Mãe, nem sei bem o que dizer… Apesar de estarem no fim desta lista foram provavelmente as pessoas que mais contribuíram para que esta tese pudesse ser concluída. Pelas horas tardias para jantar, pelos fins-de-semana em que mal vos via, pelo stress frequente nos últimos meses e por me desculparem por tudo isto e muito mais, OBRIGADO!
Aqui fica publicamente e para sempre registada a minha gratidão a todos vós. Se por acaso me esqueci de alguém (e posso garantir que é bem provável que isso aconteça!) peço desculpa… não serão certamente esquecidos na Tese de Doutoramento!!!
iv
Resumo
Os arquipélagos têm sido essenciais para a aquisição de conhecimento acerca de processos evolutivos (Bollmer et al. 2006; Dietzen et al. 2008), pois o fluxo genético é reduzido devido à existência de barreiras geográficas, a sua fauna e flora é bem conhecida devido ao reduzido tamanho das ilhas e também porque podem possuir habitats diversos. Estes factores contribuem para que os arquipélagos tenham elevados níveis de endemismo (Emerson 2002).
As diferenças entre as populações insulares e as populações continentais são geralmente maiores em espécies com baixa taxa de dispersão, em ilhas de menores dimensões e nos arquipélagos mais distantes (Frankham 1997). O reduzido tamanho das populações e o seu isolamento em algumas ilhas pode ter como resultado a existência de linhagens distintas em ilhas próximas. (Bollmer et al. 2006).
A filogeografia e a filogenética são duas áreas que respondem a questões complementares, pois enquanto a primeira pretende analisar os processos evolutivos que ocorrem a nível populacional, a outra pretende determinar as relações filogenéticas entre as espécies (Brito & Edwards 2009). Para responder a estas questões podem ser utilizados diversos tipos de marcadores moleculares.
O DNA mitocondrial tem sido amplamente utilizado em estudos filogenéticos devido à sua elevada taxa de evolução (Bonilla et al. 2010), pelo que acumula mutações mais rapidamente do que certas regiões do DNA nuclear (Avise 2009). Tem características particulares que contribuíram para que fosse um dos marcadores moleculares mais utilizados: elevada taxa de mutação, geralmente não sofre recombinação e é normalmente herdado via materna (Brito & Edwards 2009). Como os genes mitocondriais não são independentes uns dos outros, por vezes é importante comparar dados obtidos através de múltiplas genealogias (alcançadas a partir de diferentes genes), sendo o DNA nuclear fundamental (Sota & Vogler 2003).
Quando se recorre ao DNA nuclear para inferir filogenias e relações filogeográficas é necessário que sejam considerados determinados aspectos, nomeadamente o facto de isolar haplótipos nucleares poder não ser de fácil execução, assim como detectar eventos de recombinação (Avise 2009). Com o aumento do conhecimento foi possível compreender que os genes nucleares têm menos bases parcimoniosamente informativas do que o DNA
v
mitocondrial, tendo por isso menos poder de resolução. Para ultrapassar este problema, começou-se a recorrer à concatenação de vários fragmentos, passando também a utilizar-se intrões e não apenas zonas codificantes do genoma (Brito & Edwards 2009). Os intrões, por serem regiões não-codificantes, acumulam bases parcimoniosamente informativas mais rapidamente do que as zonas codificantes (Creer 2007).
Combinar dados moleculares com diferentes origens pode não ser fácil, pois cada fragmento possui a sua taxa de evolução, tendo um sinal filogenético diferente. Sabe-se há muito tempo que as árvores filogenéticas de cada gene podem diferir entre si (Nichols 2001). Portanto, diferentes partes do genoma podem ter histórias evolutivas distintas (Creer 2007).
Os Columbiformes são uma ordem de aves com distribuição mundial. Uma das famílias desta ordem, a Columbidae, é actualmente constituída por mais de 300 espécies (Pereira et al. 2007). De acordo com a Integrated Taxonomic Information System Database, o género Columba Linnaeus, 1758 contém 35 espécies.
Nos arquipélagos atlânticos (excluindo Cabo Verde), quatro espécies endémicas existem: Columba palumbus azorica Hartet, 1905 (Açores), Columba trocaz Heineken, 1829 (Madeira) (Cabral et al. 2005), Columba bollii Godman, 1872 (Canárias) e Columba junoniae Hartert, 1916 (Canárias) (Gonzalez et al. 2009).
O pombo mais abundante e disperso na Europa é o pombo torcaz, Columba palumbus Linnaeus, 1758 (Bruun et al. 1993), podendo também ser encontrado na Ásia e em África (BBC). Enquanto as populações do norte europeu são migradoras (Bea et al. 2003), as do sul são essencialmente sedentárias (Elias et al. 1998).
Das seis subespécies que estão descritas, duas existem na Europa: C. p. azorica e C. p. palumbus. A população açoriana tem sido considerada uma subespécie distinta por se encontrar geograficamente isolada (Cabral et al. 2005).
Nos últimos anos têm sido obtidos dados interessantes acerca destas aves, colocando-se algumas questões sobre a existência de uma completa diferenciação entre C. p. palumbus e C. p. azorica (Abrantes 2000; Grosso 2002; Duarte 2006; Silva 2007). Dados de microssatélites sugerem uma menor variabilidade genética da população açoriana, provavelmente por se encontrar isolada num sistema insular (Abrantes 2000). Resultados contraditórios foram obtidos com genes mitocondriais, que apontam no sentido de que as populações europeia e açoriana não estão diferenciadas (Grosso 2002; Duarte 2006). Um estudo recente baseado em intrões aponta para a existência de diferenciação entre as referidas populações, assim como a existência de semelhanças entre alguns exemplares da espécie C. p.
vi
azorica com C. trocaz e C. bollii, enquanto outros são filogeneticamente próximos de C. p. palumbus (Silva 2007).
Os resultados obtidos na presente Tese de Mestrado contribuem para esclarecer as pertinentes questões previamente mencionadas.
No total foram sequenciadas 132 amostras e 2900 pb foram analisados. Encontraram-se muitas baEncontraram-ses variáveis, Encontraram-seis indels e alguns indivíduos heterozigóticos em relação ao tamanho do indel.
Em relação às diversidades haplotípica e nucleotídica, C. p. azorica apresenta valores mais elevados do que C. p. palumbus e C. trocaz para a maioria dos intrões analisados (GHR, RP40, TROP e β-FIB), o que é muito interessante por se tratar de uma população insular, e geralmente populações insulares têm menor diversidade genética que as populações continentais que lhes deram origem (Frankham 1997). Foram detectados eventos de recombinação em quatro intrões (GHR, TROP, β-FIB e TGF-β2).
Sete SNPs interspecíficos foram descobertos, permitindo distinguir geneticamente C. p. palumbus de C. trocaz.
Quanto à análise filogenética, as filogenias obtidas diferem entre si consoante o gene que têm como base, pelo que se percebe facilmente que os filogramas e a verdadeira árvore da espécie têm diferenças, como argumentado em Nichols (2001). No entanto, existe concordância entre alguns dos fragmentos utilizados (GHR, TROP e β-FIB). Os restantes mostram padrões diferentes, evidenciando que diferentes partes do genoma podem ter histórias evolutivas distintas (Creer 2007).
Relativamente a C. junoniae, esta espécie chegou às Ilhas Canárias muito antes do que C. bollii (Gonzalez et. al. 2009), e isso é corroborado pelas filogenias alcançadas no presente trabalho. As espécies C. bollii e C. trocaz são filogeneticamente próximas entre si, e também com algumas amostras de C. p. azorica. Algumas amostras da população açoriana são filogeneticamente semelhantes a C. p. palumbus. Esta última subespécie não mostra diferenciação consoante o local amostrado, estando este aspecto relacionado com o seu comportamento migrador. Deste modo, é possível verificar que a subespécie açoriana não se comporta como sendo monofilética, pois surge em clades distintos nas árvores filogenéticas.
Considerando todos os resultados conhecidos acerca destas espécies, existe uma evidente discrepância entre os dados mitocondriais e nucleares. Uma possível explicação pode ser a dispersão preferencial das fêmeas (female-biased dispersal), que se sabe ser frequente em aves (Petit & Excoffier 2009).
vii
Com base nos resultados apresentados, o arquipélago dos Açores deve ter sido colonizado pelo mesmo ancestral de C. trocaz e C. bollii, no mesmo evento colonizador ou pouco depois, a partir dos arquipélagos da Madeira ou Canárias. Depois, terão divergido devido a isolamento geográfico. Num passado recente, indivíduos da espécie C. p. palumbus terão chegado ao arquipélago açoriano, tendo ocorrido cruzamentos entre os indivíduos da espécie já estabelecida e os recém-chegados. A hibridação pode explicar as diferenças entre os marcadores genéticos utilizados, pois deve ter conduzido à introgressão do DNA mitocondrial de C. p. palumbus nos indivíduos que previamente habitavam as ilhas, tendo sido substituído e depois prevalecido.
Esta teoria é particularmente interessante porque a introgressão é relativamente rara em animais (Zakharov et. al. 2009). Portanto, C. p. azorica tem certamente uma história evolutiva diferente e bem mais curiosa do que se julgava, sendo presumivelmente fruto de uma dupla colonização.
Palavras-chave: género Columba; filogenia; intrões; introgressão; múltiplas
viii
Abstract
In the last decade considerable research on the genetic differentiation of genus Columba has been raising relevant questions, particularly about the existence of a complete differentiation beteween pigeons C. p. palumbus and C. p. azorica, since incongruent results have been achieved according to the different molecular markers used so far (Abrantes 2000; Grosso 2002; Duarte 2006; Silva 2007). While microsatellite data suggest a smaller genetic variability of the insular subspecies, C. p. azorica, some mitochondrial genes and a nuclear intron point out to the inexistence of a true differentiation between both subspecies. The most recent study shows that some C. p. azorica samples are in the same clade of C. p. palumbus while the others cluster together with C. trocaz and C. bollii.
In the present study, the evolutionary history of the mentioned Columba species was studied using nuclear DNA sequences comprising 2900 bp derived from six introns, in six nuclear genes (GHR, RP40, TROP, β-FIB, TGF-β2 and IRF2). Of the 132 samples sequenced, several have SNPs, indels and length variation polymorphism. C. p. azorica shows higher Hd and π values than C. p. palumbus and C. trocaz for most introns analyzed, which was not expected since, generally, insular populations have less genetic diversity than mainland populations (Frankham 1997).
As expected, C. junoniae comes up as an outgroup to the remaining species and very distant from the sympatric C. bollii. This agrees with an old colonization of the Canary Islands (Gonzales et al. 2009). The obtained results corroborate Silva (2007) in that the most plausible hypothesis to explain the phylogeny of woodpigeons is that Azores Islands have been colonized by C. trocaz and C. bollii ancestral and then diverged due to geographic isolation. In a recent past, C. p. palumbus reached those islands, and admixture occurred between both species. This might be the reason why C. trocaz, C. bollii and some C. p. azorica individuals are so similar, while other C. p. azorica and C. p. palumbus are in the same clade. Hybridization may have conducted to introgression of mtDNA from C. p. palumbus into the other individuals that inhabited Azorean Islands, and mtDNA from C. p. palumbus prevailed.
Instead of a mere isolated woodpigeon population, C. p. azorica represents a much more complex and fascinating event in pigeon evolution than it was previously believed.
ix
Index
Nota prévia ... i Agradecimentos ... ii Resumo ... iv Abstract ... viii Index of Figures ... xiIndex of Tables ... xix
1 Introduction ... 1
1.1 Insular Systems ... 1
1.2 Phylogenetic and Phylogeographic Studies ... 4
1.3 Molecular Markers ... 5
1.3.1 Selected Molecular Markers ... 7
1.4 Genus Columba - State of the Art ... 8
1.4.1 Taxonomy and Distribution of the Species in Study ... 8
1.4.2 C. p. azorica – Pertinent Questions About This Subspecies ... 11
2. Thesis Aims ... 13
3. Material and Methods ... 14
3.1 Sampling ... 14
3.2 Selection of Suitable Molecular Markers ... 15
3.3 DNA Extraction, Amplification and Sequencing ... 16
3.4 Molecular Analysis ... 19
3.5 Phylogenetic and Phylogeographic Analysis ... 20
4. Results and Discussion ... 22
4.1 Extractions and Amplifications - Laboratorial Constraints ... 22
4.2 Sequence Analysis ... 24
4.3 Phylogenetic and Phylogeographic Analysis ... 29
4.3.1 GHR Intron 9 ... 29 4.3.2 RP40 Intron 5 ... 34 4.3.3 TROP Intron 5 ... 37 4.3.4 β-FIB Intron 7... 41 4.3.5 TGF-β2 Intron 5 ... 45 4.3.6 IRF2 Intron 2 ... 48
x
4.3.7 Introns Data – Further Considerations ... 51
4.3.8 Concatenated Data ... 52 5. Final Remarks ... 54 6. References ... 57 Appendices ... 64 Appendix I ... 65 Appendix II ... 69 Appendix III ... 73 Appendix IV ... 74 Appendix V ... 76 Appendix VI ... 89
xi
Index of Figures
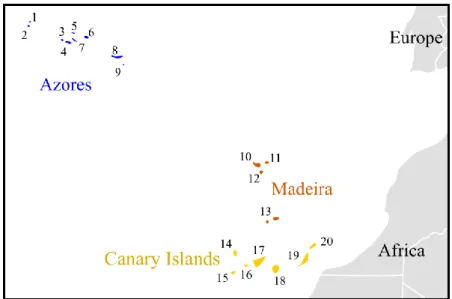
Figure 1: Part of the biogeographical area known as Macaronesia (Azores, Madeira and
Canary Islands) and estimated geological age of the islands (Myr) ): 1) Corvo – 0.71; 2) Flores – 2.16; 3) Faial – 0.73; 4) Pico – 0.25; 5) Graciosa – 2.50; 6) Terceira – 3.52; 7) S. Jorge – 0.55; 8) S. Miguel – 4.01; 9) Sta. Maria – 8.12; 10) Madeira – 4.6; 11) Porto Santo – 15; 12) Desertas Islands – 3.6; 13) Selvagens Islands – 27; 14) La Palma – 1.5; 15) El Hierro – 1.1; 16) La Gomera – 12; 17) Tenerife – 8; 18) Gran Canaria – 14; 19) Fuerteventura – 20; 20) Lanzarote – 16 (Schwarz et al. 2005; Whittaker & Fernández-Palacios 2007; Borges et al.
2009)………...3
Figure 2: Columba palumbus palumbus………9
Figure 3: Columba palumbus azorica………9
Figure 4: Columba trocaz………10
Figure 5: Columba junoniae………10
Figure 6: Columba bollii………..11
Figure 7: Columba livia……….…………..11
Figure 8: Sampling map of each species……….14
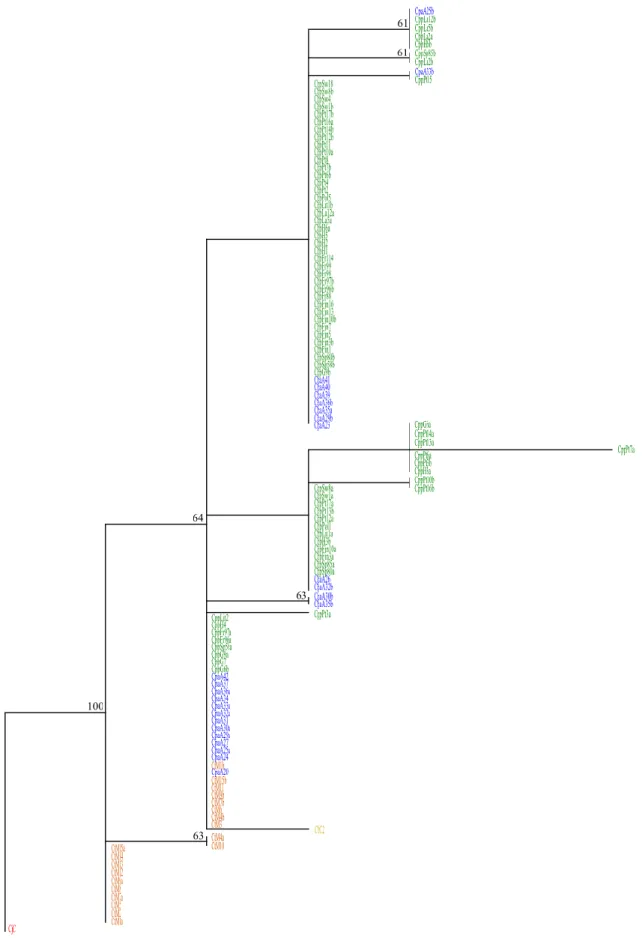
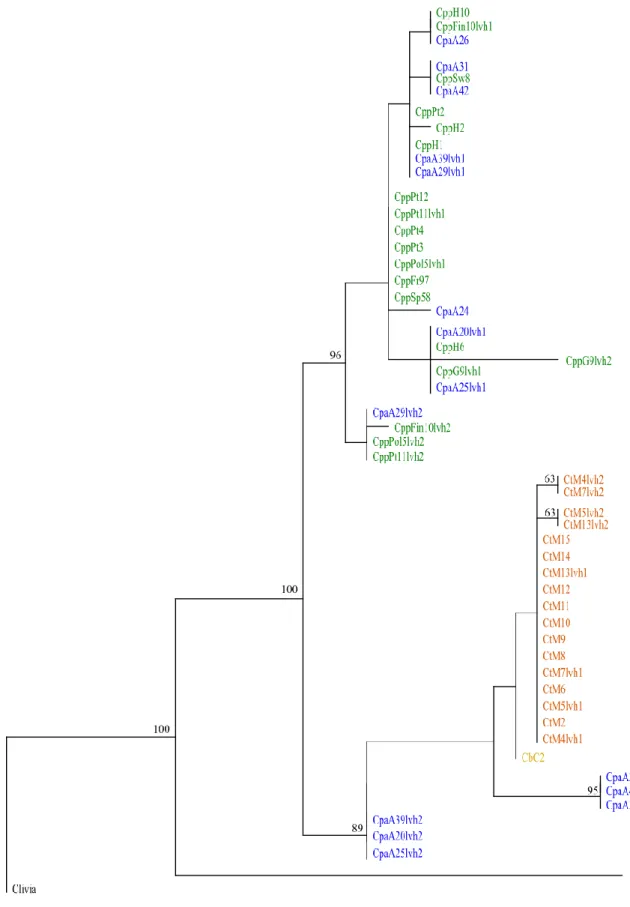
Figure 9: Maximum parsimony tree based on GHR intron 9 sequence data with heterozygous bases as ambiguities (one out of one thousand trees with equal tree length). Branch support is given by MP bootstrap values (only values above 50% are shown). Colors indicate the species: green – C. p. palumbus; blue – C. p. azorica; orange – C. trocaz; yellow – C. bollii and red – C. junoniae………..31
xii
Figure 10: Maximum parsimony tree based on GHR intron 9 haplotypic data (one out of
fifty-four trees with equal tree length). Branch support is given by MP bootstrap values (only values above 50% are shown). Colors indicate the species: green – C. p. palumbus; blue – C. p. azorica; orange – C. trocaz; yellow – C. bollii and red – C. junoniae. a and b refers to both haplotypes of a sample with ambiguous bases in this fragment………..32
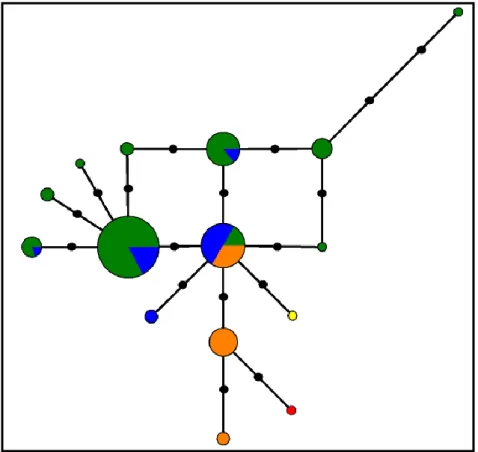
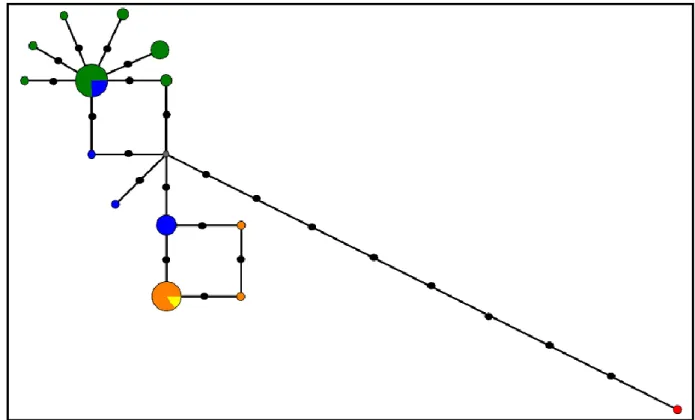
Figure 11: Median-joining network from GHR intron 9 haplotypic data. Circle size is
proportional to the frequency of each haplotype. Each species is represented by a different color: green – C. p. palumbus; blue – C. p. azorica; orange – C. trocaz; yellow – C. bollii and red – C. junoniae. A median vector is represented by a grey circle. Black circles correspond to mutation events……….33
Figure 12: Maximum parsimony tree based on RP40 intron 5 sequence data with
heterozygous bases as ambiguities (one out of one thousand trees with equal tree length). Branch support is given by MP bootstrap values (only values above 50% are shown). Colors indicate the species: green – C. p. palumbus; blue – C. p. azorica; orange – C. trocaz; yellow – C. bollii and red – C. junoniae……….35
Figure 13: Maximum parsimony tree based on RP40 intron 5 haplotypic data (one out of one
thousand trees with equal tree length). Branch support is given by MP bootstrap values (only values above 50% are shown). Colors indicate the species: green – C. p. palumbus; blue – C. p. azorica; orange – C. trocaz; yellow – C. bollii and red – C. junoniae. a and b refers to both haplotypes of a sample with ambiguous bases in this fragment………...36
Figure 14: Median-joining network from RP40 intron 5 haplotypic data. Circle size is
proportional to the frequency of each haplotype. Each species is represented by a different color: green – C. p. palumbus; blue – C. p. azorica; orange – C. trocaz; yellow – C. bollii and red – C. junoniae. Black circles correspond to mutation events……….….37
Figure 15: Maximum parsimony tree based on TROP intron 5 sequence data with
heterozygous bases dealt as ambiguities (one out of one thousand trees with equal tree length). Branch support is given by MP bootstrap values (only values above 50% are shown). Colors
xiii
indicate the species: green – C. p. palumbus; blue – C. p. azorica; orange – C. trocaz; yellow – C. bollii and red – C. junoniae………...39
Figure 16: Maximum parsimony tree based on TROP intron 5 haplotypic data (one out of two
hundred and seventy trees with equal tree length). Branch support is given by MP bootstrap values (only values above 50% are shown). Colors indicate the species: green – C. p. palumbus; blue – C. p. azorica; orange – C. trocaz; yellow – C. bollii and red – C. junoniae. a and b refers to both haplotypes of a sample with ambiguous bases in this fragment………...40
Figure 17: Median-joining network from TROP intron 5 haplotypic data. Circle size is
proportional to the frequency of each haplotype. Each species is represented by a different color: green – C. p. palumbus; blue – C. p. azorica; orange – C. trocaz; yellow – C. bollii and red – C. junoniae. A median vector is represented by a grey circle. Black circles correspond to mutation events……….…41
Figure 18: Maximum parsimony tree based on β-FIB intron 7 sequence data with
heterozygous bases dealt as ambiguities (one out of one thousand trees with equal tree length). Branch support is given by MP bootstrap values (only values above 50% are shown). Colors indicate the species: green – C. p. palumbus; blue – C. p. azorica; orange – C. trocaz; yellow – C. bollii and red – C. junoniae. lvh1 and lvh2 refer to the both possible haplotypes when the sample has a length variation in the fragment………...43
Figure 19: Maximum parsimony tree based on β-FIB intron 7 haplotypic data (one out of one
thousand trees with equal tree length). Branch support is given by MP bootstrap values (only values above 50% are shown). Colors indicate the species: green – C. p. palumbus; blue – C. p. azorica; orange – C. trocaz; yellow – C. bollii and red – C. junoniae. The samples with both heterozygous sites and length variation, four possible options are shown - lvh1a, lvh1b, lvh2a and lvh2b………...44
Figure 20: Median-joining network from β-FIB intron 7 haplotypic data. Circle size is
proportional to the frequency of each haplotype. Each species is represented by a different color: green – C. p. palumbus; blue – C. p. azorica; orange – C. trocaz; yellow – C. bollii and
xiv
red – C. junoniae. Median vectors are represented by grey circles. Black circles correspond to mutation events……….45
Figure 21: Maximum parsimony tree based on TGF-β2 intron 5 sequence data with
heterozygous bases dealt as ambiguities (one out of one thousand trees with equal tree length). Branch support is given by MP bootstrap values (only values above 50% are shown). Colors indicate the species: green – C. p. palumbus; blue – C. p. azorica and orange – C. trocaz….46
Figure 22: Maximum parsimony tree based on TGF-β2 intron 5 haplotypic data (one out of
thirty trees with equal tree length). Branch support is given by MP bootstrap values (only values above 50% are shown). Colors indicate the species: green – C. p. palumbus; blue – C. p. azorica and orange – C. trocaz. a and b refer to both haplotypes of a sample with ambiguous bases in this fragment……….47
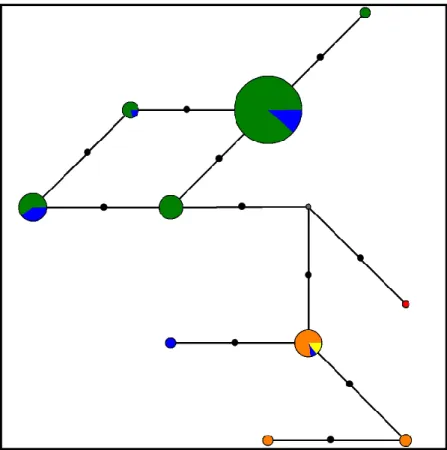
Figure 23: Median-joining network from TGF-β2 intron 5 haplotypic data. Circle size is
proportional to the frequency of each haplotype. Each species is represented by a different color: green – C. p. palumbus; blue – C. p. azorica and orange – C. trocaz. A median vector is represented by a grey circle. Black circles correspond to mutation events……….48
Figure 24: Maximum parsimony tree based on IRF2 intron 2 sequence data with heterozygous bases dealt as ambiguities (one out of one thousand trees with equal tree length). Branch support is given by MP bootstrap values (only values above 50% are shown). Colors indicate the species: green – C. p. palumbus; blue – C. p. azorica and orange – C. trocaz….49
Figure 25: Maximum parsimony tree based on IRF2 intron 2 haplotypic data (one out of one
thousand trees with equal tree length). Branch support is given by MP bootstrap values (only values above 50% are shown). Colors indicate the species: green – C. p. palumbus; blue – C. p. azorica and orange – C. trocaz. a and b refer to both haplotypes of a sample with ambiguous bases in this fragment……….50
Figure 26: Median-joining network from IRF2 intron 2 haplotypic data. Circle size is
proportional to the frequency of each haplotype. Each species is represented by a different color: green – C. p. palumbus; blue – C. p. azorica and orange – C. trocaz. Black circles correspond to mutation events………..51
xv
Figure 27: Maximum parsimony tree based on 5 fragments concatenated (GHR, RP40,
TROP, β-FIB and TGF-β2), with heterozygous bases dealt as ambiguities (one out of one thousand trees with equal tree length). Branch support is given by MP bootstrap values (only values above 50% are shown). Colors indicate the species: green – C. p. palumbus; blue – C. p. azorica; orange – C. trocaz and red – C. junoniae. Numbers 1 and 2 refer to both concatenation options due to the presence of a length variation in β-FIB intron 7…………..53
Figure 28: Consensus tree obtained from the 1000 trees on MP analysis of GHR intron 9
sequence data with heterozygous bases dealt as ambiguities. Numbers indicate consensus values above 50%. Colors indicate the species: green – C. p. palumbus; blue – C. p. azorica; orange – C. trocaz; yellow – C. bollii and red – C. junoniae………..….76
Figure 29: Consensus tree obtained from the 54 trees on MP analysis of GHR intron 9
haplotypic data. Numbers indicate the consensus values above 50%. Colors indicate the species: green – C. p. palumbus; blue – C. p. azorica; orange – C. trocaz; yellow – C. bollii and red – C. junoniae. a and b refer to both haplotypes of a sample with ambiguous bases in this fragment……….77
Figure 30: Consensus tree obtained from the 1000 trees on MP analysis of RP40 intron 5
sequence data with heterozygous bases dealt as ambiguities. Numbers indicate consensus values above 50%. Colors indicate the species: green – C. p. palumbus; blue – C. p. azorica; orange – C. trocaz; yellow – C. bollii and red – C. junoniae………..….78
Figure 31: Consensus tree obtained from the 1000 trees on MP analysis of RP40 intron 5
haplotypic data. Numbers indicate consensus values above 50%. Colors indicate the species: green – C. p. palumbus; blue – C. p. azorica; orange – C. trocaz; yellow – C. bollii and red – C. junoniae. a and b refer to both haplotypes of a sample with ambiguous bases in this fragment………79
Figure 32: Consensus tree obtained from the 1000 trees on MP analysis of TROP intron 5
xvi
values above 50%. Colors indicate the species: green – C. p. palumbus; blue – C. p. azorica; orange – C. trocaz; yellow – C. bollii and red – C. junoniae………...80
Figure 33: Consensus tree obtained from the 270 trees on MP analysis of TROP intron 5 haplotypic data. Numbers indicate the consensus values above 50%. Colors indicate the species: green – C. p. palumbus; blue – C. p. azorica; orange – C. trocaz; yellow – C. bollii and red – C. junoniae. a and b refer to both haplotypes of a sample with ambiguous bases in this fragment……….81
Figure 34: Consensus tree obtained from the 1000 trees on MP analysis of β-FIB intron 7
sequence data with heterozygous bases dealt as ambiguities. Numbers indicate consensus values above 50%. Colors indicate the species: green – C. p. palumbus; blue – C. p. azorica; orange – C. trocaz; yellow – C. bollii and red – C. junoniae. lvh1 and lvh2 refer to the both possible haplotypes when the sample has a length variation in the fragment………...82
Figure 35: Consensus tree obtained from the 1000 trees on MP analysis of β-FIB intron 7
haplotypic data. Numbers indicate consensus values above 50%. Colors indicate the species: green – C. p. palumbus; blue – C. p. azorica; orange – C. trocaz; yellow – C. bollii and red – C. junoniae. The samples with both heterozygous sites and length variation, four possible options are shown - lvh1a, lvh1b, lvh2a and lvh2b……….….83
Figure 36: Consensus tree obtained from the 1000 trees on MP analysis of TGF-β2 intron 5
sequence data with heterozygous bases dealt as ambiguities. Numbers indicate consensus values above 50%. Colors indicate the species: green – C. p. palumbus; blue – C. p. azorica and orange – C. trocaz………..………84
Figure 37: Consensus tree obtained from the 30 trees on MP analysis of TGF-β2 intron 5
haplotypic data. Numbers indicate consensus values above 50%. Colors indicate the species: green – C. p. palumbus; blue – C. p. azorica and orange – C. trocaz. a and b refer to both haplotypes of a sample with ambiguous bases in this fragment………...85
Figure 38: Consensus tree obtained from the 1000 trees on MP analysis of IRF2 intron 2
xvii
values above 50%. Colors indicate the species: green – C. p. palumbus; blue – C. p. azorica and orange – C. trocaz………..86
Figure 39: Consensus tree obtained from the 1000 trees on MP analysis of IRF2 intron 2
haplotypic data. Numbers indicate consensus values above 50%. Colors indicate the species: green – C. p. palumbus; blue – C. p. azorica and orange – C. trocaz. a and b refer to both haplotypes of a sample with ambiguous bases in this fragment……….…..87
Figure 40: Consensus tree obtained from the 1000 trees on MP analysis of 5 concatenated
fragments (GHR, RP40, TROP, β-FIB and TGF-β2). Numbers indicate consensus values above 50%. Colors indicate the species: green – C. p. palumbus; blue – C. p. azorica; orange – C. trocaz and red – C. junoniae. . 1 and 2 refer to both concatenation options due to the presence of a length variation in β-FIB intron 7……….…...88
Figure 41: Median-joining network from GHR intron 9 data with heterozygous bases dealt as
ambiguities. Circle size is proportional to the frequency of each haplotype. Each species is represented by a different color: green – C. p. palumbus; blue – C. p. azorica; orange – C. trocaz; yellow – C. bollii and red – C. junoniae. A median vector is represented by a grey circle. Black circles correspond to mutation events……….…89
Figure 42: Median-joining network from RP40 intron 5 data with heterozygous bases dealt as
ambiguities. Circle size is proportional to the frequency of each haplotype. Each species is represented by a different color: green – C. p. palumbus; blue – C. p. azorica; orange – C. trocaz; yellow – C. bollii and red – C. junoniae. Black circles correspond to mutation events………89
Figure 43: Median-joining network from TROP intron 5 data with heterozygous bases dealt
as ambiguities. Circle size is proportional to the frequency of each haplotype. Each species is represented by a different color: green – C. p. palumbus; blue – C. p. azorica; orange – C. trocaz; yellow – C. bollii and red – C. junoniae. A median vector is represented by a grey circle. Black circles correspond to mutation events……….……90
xviii
Figure 44: Median-joining network from β-FIB intron 7 data with heterozygous bases dealt
as ambiguities. Circle size is proportional to the frequency of each haplotype. Each species is represented by a different color: green – C. p. palumbus; blue – C. p. azorica; orange – C. trocaz; yellow – C. bollii and red – C. junoniae. A median vector is represented by a grey circle. Black circles correspond to mutation events……….……90
Figure 45: Median-joining network from TGF-β2 intron 5 data with heterozygous bases dealt
as ambiguities. Circle size is proportional to the frequency of each haplotype. Each species is represented by a different color: green – C. p. palumbus; blue – C. p. azorica and orange – C. trocaz. A median vector is represented by a grey circle. Black circles correspond to mutation events………91
xix
Index of Tables
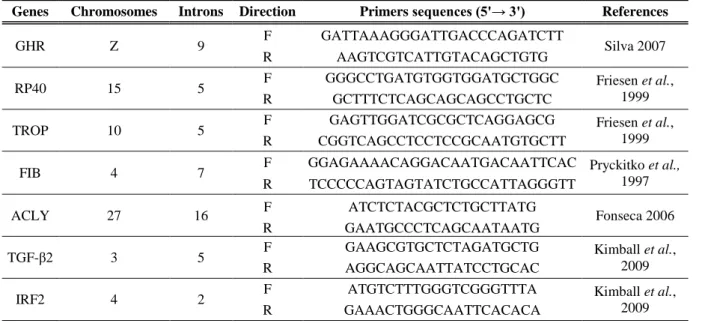
Table 1: Genes, chromosomes, introns, primers sequences and their references………17
Table 2: Final concentrations of reagents used in the amplification of each fragment, as well
as the reactions’ final volume………...17
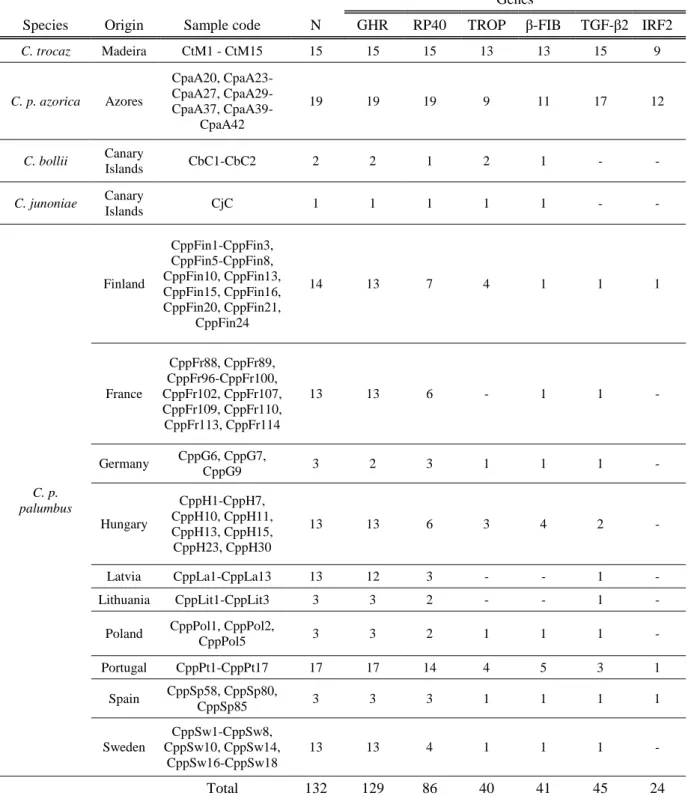
Table 3: Number of amplified samples of each species for each fragment. N corresponds to
the number of samples………..23
Table 4: Length of each intron and the total number of base pairs analyzed………...24
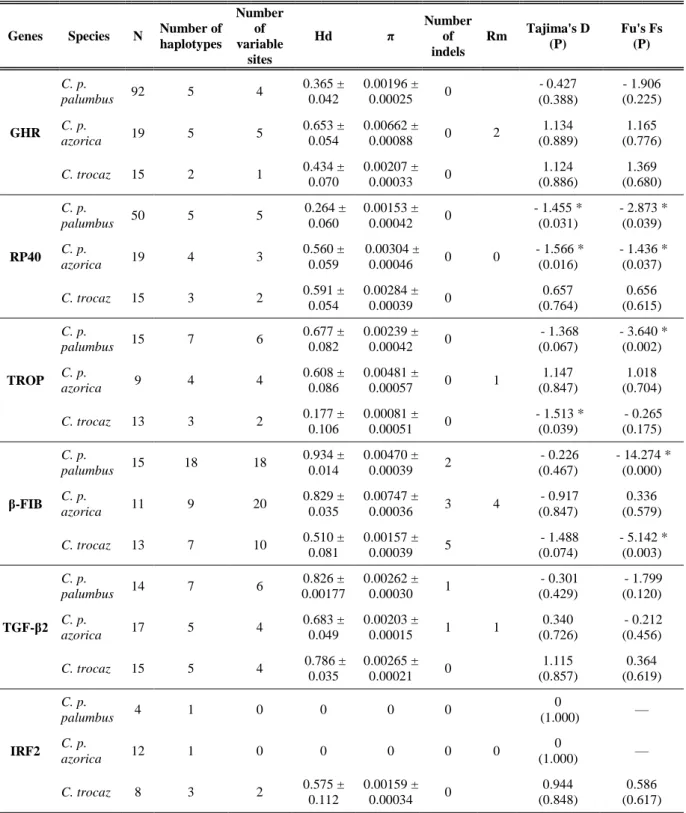
Table 5: Genetic variability at each of the six nuclear intronic regions, for each species.
Number of haplotypes, number of variable sites, haplotypic diversity (Hd), nucleotide diversity (π) and minimum number of recombination events (Rm) were calculated employing DnaSP v 5.10.01. Values of standard deviations are shown for Hd and π. Neutrality tests (Tajima’s D and Fu’s Fs tests) were determined in the software Arlequim v 3.5.1.2. P values for Tajima’s D and Fu’ Fs tests are given in brackets, and * indicates significance (P < 0.05). Number of individuals (N) and number of indels are also shown………27
Table 6: Interspecific SNPs found in the fragments GHR, TROP, β-FIB and TGF-β2……..28
Table 7: Samples identification – name, species, origin, sample type and collection date of
each sample………...65
Table 8: Amplified samples for each fragment in the present work (dark grey) or previously
(light grey) in Silva (2007)………69
Table 9: Used samples in the concatenated dataset. White spaces mean that those samples
1
1 Introduction
The genus Columba is an interesting group of birds due to their widely studied migratory behaviors and also because these birds may be potential hosts for several pathogenic agents. Besides that, they constitute a very important resource in a few European countries as game birds.
Some studies concerning this genus focus on the research of their pathogenic agents, most of them concerning domestic pigeons, due to the effects that infections have on the performance of these birds as racing pigeons or as messengers during wars in the past (Marlier & Vindevogel, 2006). Throughout the migratory movements, birds may then carry pathogens that can be transmitted between species. This is particularly important since some of them inhabit urban areas, being eventually in contact with people. Data about avian movements may be used to improve disease surveillance schemes or to adapt preventive measures (Jourdain et al. 2007).
Some pigeon populations are migratory. Their migration routes may occur not only over land but also over the sea, and as a consequence they can reach nearby islands (Bankovics 2001).
1.1 Insular Systems
Oceanic islands (never connected to continents) correspond to the perfect laboratory to test for evolution in the action, a simplified model from old and complex continental systems. Islands come up with a variety of shapes and sizes, share and differ upon different biotic and abiotic environments and vary much in their distance to nearby continent(s), this having a huge effect in the animals and plants that populate them (Whittaker & Fernández-Palacios 2007).
Archipelagos have been essential for knowledge acquisition concerning evolutionary processes (Bollmer et al. 2006; Dietzen et al. 2008), such as the study of gene flow, which is reduced (and very often interrupted) by oceanic barriers. This and genetic drift make up the pillars of allopatric speciation, which is thought to be essential to the high levels of endemism in oceanic archipelagos, being microcosms for evolutionary processes (Emerson 2002).
2
Islands are dynamic entities, where the island area and isolation from the mainland influence the immigration and the extinction rates (Donazar et al. 2005; Agudo et al. 2011). Differences between island and mainland populations are supposed to be greater for species with lower dispersal rate, and consequently a considerable number of insular populations have lower levels of genetic diversity than the corresponding mainland populations. It is also known that insular endemic species tend to have lower genetic variation that the nonendemic ones (Frankham 1997). In several cases, despite the distance between the island and the mainland, insular and mainland populations may not be totally independent, since migration can occur, particularly for species with high dispersal capacity. In order to detect these occurrences, recent studies have been integrating not only the genetic information but also satellite tracking data (Agudo et al. 2011).
Small population size and isolation on island systems often results in distinct lineages on near islands. More recently, phylogenetic techniques revealed a common event – mainland source populations and colonization patterns in archipelagos (Bollmer et al. 2006).
Macaronesia is a biogeographical region comprising the Azores, Madeira, Canary Islands and Cape Verde archipelagos, whose high rate of endemic species makes it one biodiversity hotspot (Donazar et al. 2005). In fact, the number of endemic species of terrestrial organisms is estimated to be about 420 in Azores, 1419 in Madeira, 3672 in the Canary Islands (Martin et al. 2010) and 533 in Cape Verde Archipelago (Arechavaleta et al. 2005).
All these islands share a volcanic origin within the mid-atlantic. Some of them are much older than others, covering a wide range of geological ages. Their emergence above the sea level is thought to have begun about 27 million years ago (Myr) in the Selvagens Islands (Madeira), followed by Canary Islands (from 20 Myr), Madeira (15 Myr) and finally Cape Verde (10 Myr) and Azores (8 Myr) (Whittaker & Fernández-Palacios 2007). Figure 1 shows each archipelago location and each island approximated geological age (Cape Verde data not shown).
Nowadays, distances from European and African mainlands to the Macaronesian Islands have huge differences. For instance, 96 Km is the distance between Fuertventura (Canary Islands) and Stafford Point (Western Sahara), and 1370 Km separate São Miguel (Azores) from Lisbon (Europe) (Whittaker & Fernández-Palacios 2007).
3
Figure 1: Part of the biogeographical area known as Macaronesia (Azores, Madeira and Canary Islands) and
estimated geological age of each island (Myr): 1) Corvo – 0.71; 2) Flores – 2.16; 3) Faial – 0.73; 4) Pico – 0.25; 5) Graciosa – 2.50; 6) Terceira – 3.52; 7) S. Jorge – 0.55; 8) S. Miguel – 4.01; 9) Sta. Maria – 8.12; 10) Madeira – 4.6; 11) Porto Santo – 15; 12) Desertas Islands – 3.6; 13) Selvagens Islands – 27; 14) La Palma – 1.5; 15) El Hierro – 1.1; 16) La Gomera – 12; 17) Tenerife – 8; 18) Gran Canaria – 14; 19) Fuerteventura – 20; 20) Lanzarote – 16 (Schwarz et al. 2005; Whittaker & Fernández-Palacios 2007; Borges et al. 2009).
In spite of physically isolated, these archipelagos probably had connections in the past both between each other and with mainland areas (Fernandez-Palacios et al. 2011) particularly in the light of: 1) new territory has been formed as a consequence of the continuing volcanic activity; 2) the existence of consolidated wind and marine current systems in this region since 3.5 – 5 Myr, which have promoted the arrival of colonizers from the adjacent continents; 3) the lowering of sea level during the Pleistocene, conducted to the emergence of sub-marine banks, serving as stepping stones. These stepping stones may have been important for birds, which have been responsible for introducing many plant species to the islands. The banks existing to the north of Madeira Islands provided connections between Madeira and the Iberian Peninsula, for example. Dispersal opportunities between Canary Islands and Madeira were also enhanced by some of these banks and by the Selvagens Islands (Whittaker & Fernández-Palacios 2007).
Molecular phylogenetics has recently elucidated many relationships between mainland taxa and Macaronesia populations. Among plants, several plant taxa seem to have colonized Madeira from the Canary Islands, and some of them have then colonized the Azores archipelago; others are thought to have colonized firstly Madeira and then the Canary Islands (Whittaker & Fernández-Palacios 2007).
4
1.2 Phylogenetic and Phylogeographic Studies
Phylogeography and phylogenetics may be seen as part of a continuum that crosses the species boundary. Nevertheless, these two fields of knowledge have asked different questions, exploiting different methods: while the first one pretends to analyze the evolutionary processes that happen at the population level, phylogenetics intends to determine species relationships (Brito & Edwards 2009). It is also possible to say that phylogeography has the purpose of using phylogenetic methodologies in order to clarify historical processes in a geographic context (Nielsen & Beaumont 2009), dealing within and between closely related species (Avise 2009).
In vertebrates, mitochondrial DNA (mtDNA) has been widely used in phylogenetics due to its evolutionary rate and rapid coalescence (Bonilla et al. 2010). Mitochondrial DNA has several features that have contributed for being selected as a molecular marker: due to an inefficient mutation repair mechanism, mtDNA has high evolutionary rates; its genes are single copy and are not usually a target of recombination; it is generally inherited through maternal line (Brito & Edwards 2009). Because it is uniparentally inherited, molecules from different families hardly ever recombine (Avise 2009).
Animal mtDNA is very compact, and this organization must be advantageous in the cell, where the smaller mitochondria may replicate faster than the bigger ones. The rapid evolution of mtDNA in most animal species is reflected in the existence of high nucleotide sequence variation, which is a requirement for phylogeographic studies. According to mtDNA characteristics, it accumulates mutations faster than usually does nuclear DNA (nDNA) (Avise 2009).
Despite the fact that mtDNA has been routinely used to infer genealogies in phylogenetic analyses of closely related species, nDNA can be extremely important in many cases. Mitochondria represent a single linkage group, which means that mitochondrial genes are not independent from each other; so it is important to compare multiple gene genealogies with potentially different evolutionary histories (Sota & Vogler 2003).
When scientists handle nDNA, some constrains must be considered: it mutates slower than does mtDNA, isolating nuclear haplotypes may be difficult and the detection of
5
intragenic recombination must be taken into account. But it is possible to overcome these difficulties since introns evolve faster than exons, and as a consequence they are preferred to study close relationships between individuals belonging to the same or closely related species (Avise 2009).
With recent methodological developments, another feature of nDNA was uncovered: it has been noticed that a nuclear gene usually contains a small number of informative sites, and consequently shows poor phylogenetic resolution. To overcome this, scientists increased tree resolution by concatenating several genes simultaneously. Introns are now commonly used in multilocus approaches (Brito & Edwards 2009). However, concatenation of several nuclear genes may cause some problems since the sorting of each allele in different parts of genome may conduct to incorrect species trees (Bellemain et al. 2008).
Combining different molecular data is not as easy as it might seem, since each gene could have their own evolution rate, containing singular phylogenetic signals. Thus, combining data is challenging. Recently, the implementation of sophisticated methodologies allows data treatment more accurately (Brito & Edwards 2009). Besides this, it is known that gene trees could differ from each other (Nichols 2001). The structure of a gene tree depends on the specific individuals that have left descendents in the next generation (in the case of mtDNA) and which of the two alleles was transmitted during reproduction (in the case of nDNA for diploid organisms) (Nielsen & Beaumont 2009).
1.3 Molecular Markers
DNA markers have been used to examine an extensive range of biological issues, including species identification, population genetics and phylogenetics (Kimball et al. 2009). Mitochondrial DNA has been widely used in bird molecular phylogenetics, but the same hasn’t happened with nuclear genes, rather less frequently used (Johnson & Clayton 2000).
The nuclear genome is not homogeneous, consisting of coding regions, untranslated regions, intergenic regions and introns. Molecular markers have different patterns of evolution, so they can be used at several taxonomic levels and answering different types of phylogenetic questions (Kimball et al. 2009).
6
Introns are untranslated gene regions spliced out during the formation of mature RNA molecules (Creer 2007). They are no more considered junk DNA, and some of them are known for their functional importance. Therefore, some may be evolving under the influence of natural selection (Zhu et al. 2009). However, since they have a small functional importance, they can be considered as neutral markers. Since introns are non-coding regions, it allows them to acquire a large number of parsimony informative sites (Creer 2007).
Introns evolve faster than exons, and they consequently have a high substitution rate. Studying this part of the genome has the advantage in the easy design of primers in the flanking exons, which are conserved regions (Bonilla et al. 2010).
An elementary concept in molecular phylogenetics is that a single phylogeny can be obtained from the DNA fragments under study. However, nuclear fragments often experience recombination events, and these can create mosaic genes. As a result, different parts in the DNA sequence have different evolutionary histories (Creer 2007). Recombination tends to complicate a gene tree genealogy and it should not be ignored (Avise 2009). It is possible to overcome this phenomenon in two ways: one is by studying nuclear regions with a previously known recombination rate, but these regions may not provide enough variation to answer many questions; a second approach consists in the detection of the recombination events and then the incorporation of that information into models of evolution during data analyses (Zhang & Hewitt 2003; Creer 2007; Brito & Edwards 2009). Recombination rate is different for each locus, and it is influenced by several factors, such as structural characteristics of the sequence or chromosomal location of the locus under study. It is common to find regions with higher recombination rates than mutation rates (Zhang & Hewitt 2003).
Organisms can be homozygous or heterozygous for a certain intronic sequence (since there are two copies in the diploid genome). Heterozygous bases (or ambiguities) are easily recognized in the sequence chromatogram as dual peaks of approximately the same intensity occupying the same base position (Creer 2007). Organisms that are heterozygous at a particular site have two different alleles or haplotypes. To determine the correct haplotypes (also known as to ―determine the phase‖), experimental and statistical approaches have been developed (Brito & Edwards 2009).
Introns frequently have insertions / deletions (indels), which often comprise a considerable part of the detected polymorphisms. In this case, patterns of indels (that appears as gaps in the aligned sequences) may contain important phylogenetic information that should not be ignored in the analyses (Zhang & Hewitt 2003). Indels can influence gene structure,
7
pre-mRNA splicing, gene expression, gene duplication and chromosomal rearrangements (Rao et al. 2010). A recent study on chicken genome demonstrated that indels density is highly correlated with single nucleotide polymorphisms (SNPs) density (Brandstrom & Ellegren 2007).
Another intronic trait more complex to deal with when occurring is length variation (length variation heterozygote – LVH), and in this case, the sequence chromatogram is like an apparent corruption of the sequencing reaction by the superposition of two separate sequences occupying the same frame (Creer 2007). Even nowadays, some studies do not incorporate LVH in their analyses (Yu & Zhang 2005), but others are doing so according to different approaches (Sota & Vogler 2003; Creer et al. 2006; Bellemain et al. 2008).
SNPs can be found both in coding and non-coding regions of the genome (Primmer et al. 2002). A SNP can be defined as a position in the genome where more than one nucleotide can be found in a given population, thus implying different sequence alternatives (alleles). To be considered a SNP, it is necessary to have a frequency of at least 1% in a given population (Brookes 1999). These genetic markers are co-dominant (Morin et al. 2004) and have a Mendelian heredity (Primmer et al. 2002). In principle, SNPs could be bi-, tri- or tetra-alellic, but they are usually considered biallelic (Brumfield et al. 2003).
SNPs are believed to be the most abundant type of polymorphism in most genomes. Due to its high frequency in the genome and the existence of automatic analysis systems, their use as genetic markers has been regular in evolutionary studies (Slate et al. 2009). Despite being a relatively recent type of genetic marker, SNPs have been very relevant in the discovery of populations’ evolutionary history (Brumfield et al. 2003).
In bird studies, introns of these organisms tend to be highly variable, having a high rate of SNPs (Primmer et al. 2002).
1.3.1 Selected Molecular Markers
Considering previous arguments in favor of introns as molecular markers in phylogenetics and phylogeography, these have been elected in this study. Other reasons must be considered behind such decision: they are abundant in the genome, their lengths are
8
convenient for amplification and their amplification by Polymerase Chain Reaction is potentially easy (Prychitko & Moore 1997).
It is also important to use not only one but several introns, since each fragment can evolve in a differently, and consequently, the phylogenetic signal may differ between genes. Using more than one gene / intron we can bypass this problem (Brito & Edwards 2009).
1.4 Genus Columba - State of the Art
1.4.1 Taxonomy and Distribution of the Species in Study
Columbiformes is a very well recognized avian order worldwide. A recent study (Pereira et al. 2007) points to a Gondwanaland origin (as previously suggested by other studies), implying a diversification by vicariance due to continental drift. This order is subdivided in two families: Raphidae and Columbidae, being the latter represented nowadays by more than 300 living species of doves and pigeons.
According to the Integrated Taxonomic Information System Database, the genus Columba Linnaeus, 1758 comprises 35 species. One of the most common in Europe is the Woodpigeon, Columba palumbus Linnaeus, 1758 (Bruun et al. 1993).
In the Atlantic Archipelagos (Cape Verde not included), four endemic taxa exists: Columba palumbus azorica Hartert, 1905 in Azores (Portugal) Columba trocaz Heineken, 1829 in Madeira (Portugal) (Cabral et al. 2005), while both Columba bollii Godman, 1872 and Columba junoniae Hartert, 1916 are endemic to the Canary Islands (Spain) (Gonzalez et al. 2009).
Columba palumbus, is the most abundant and widespread of European pigeons (Bruun et al. 1993), having a wide distribution in Europe, Asia and Africa (BBC). In Europe, this species experienced a substantial expansion since the nineteenth century, with occasional records of nesting in Iceland (Cabral et al. 2005). While the northern Europe populations are described as migratory (Bea et al. 2003), the southern populations are mainly sedentary (Elias et al. 1998).
9
From the six described subspecies, two can be found in Europe: Columba palumbus palumbus, Linnaeus, 1758 (throughout Europe) and Columba palumbus azorica Hartert, 1905 (endemic to the Azores archipelago) (Figures 2 and 3). Columba palumbus azorica can be found in all Azorean islands. Azorean populations of Columba palumbus have been classified as distinct from the others because of their geographic isolation and slightly different morphology.
In Madeira archipelago (Portugal) existed in times the subspecies madeirensis (Columba palumbus madeirensis Tschusi, 1904), now considered extinct (Cabral et al. 2005).
Columba trocaz Heineken, 1829, commonly known as Trocaz Pigeon (Figure 4), is an endemic species from Madeira archipelago (Cabral et al. 2005). Despite having already existed in the island of Porto Santo, it is currently restricted to the Madeira Island (Correia-Fagundes & Romano 2011). Two factors were critical for this population decline: habitat reduction and fragmentation, as well as hunting and poisoning by humans because of the damage they often cause in agricultural fields. Due to population decline, C. trocaz has been considered a vulnerable species (Cabral et al. 2005). However, nowadays the population of this species has achieved considerable levels of recovery, which has changed the conservation status. Based on these aspects, C. trocaz is now officially a game bird (Paulo Oliveira, personal communication).
The Laurel Pigeon (Columba junoniae Hartert, 1916) is an endemic pigeon that inhabits the Canary Islands (Figure 5). Despite several constraints that occurred in the past, such as the decrease in extent of habitats, hunting and introduced predators, C. junoniae is not a threatened species nowadays. Evidences based on nuclear and mitochondrial genes indicate
Figure 2: Columba palumbus palumbus
(Photo: Eduardo Marabuto).
Figure 3: Columba palumbus azorica
10
that the colonization of the archipelago by this species occurred between 5 and 20 million years ago, depending on the inference model (Gonzalez et al. 2009).
As the Laurel Pigeon, the Bolles’s Pigeon (Columba bollii Godman, 1872) is an endemic pigeon from the Canary Islands (Figure 6). Besides having been under same constrains that have affected C. junoniae in the last years, C. bollii has also recovered in terms of population size. Nowadays, both C. junoniae and C. bollii are restricted to the islands of Tenerife, El Hierro, La Gomera and La Palma, where densest laurel forest remains. It is thought that its arrival to the Archipelago occurred approximately between 1.6 and 5 million years ago, depending on the considered model. A study highlights the closer phylogenetic relationship between C. bollii and C. palumbus, suggesting a palearctic origin of C. bollii, later than the Laurel Pigeon (Gonzalez et al. 2009).
Columba livia Gmelin, 1789, the Rock Pigeon (Figure 7), has a long domestication and human associated history. Worldwide however, many birds have returned to the wild, becoming feral populations. This pigeon, considering the feral and the wild populations, has a wide distribution area (Hume 2002), being present in all continents with the exception of Antarctica. The truly wild populations occur is a more restricted area, being almost inexistent in South and North America, Asia, Australia and North of Europe. It is present in Azores and Madeira, being considered a distinct subspecies – Columba livia atlantis (Cabral et al. 2005).
Figure 5: Columba junoniae
(Photo: Philipp Lehmann).
Figure 4: Columba trocaz (Photo:
11
1.4.2 C. p. azorica – Pertinent Questions About This Subspecies
In the last decade considerable research on this bird species has been developed, raising relevant questions about the existence of a complete genetic differentiation between C. p. palumbus and C. p. azorica (Abrantes 2000; Grosso 2002; Duarte 2006; Silva 2007).
In 2000, Abrantes studied some microsatellites in these subspecies, and sampling included individuals from three European countries: France, Spain, Portugal and also the Azores archipelago. From the ten studied loci, only three of them proved to be polymorphic in the Azorean population. These data suggest a smaller genetic variability of C. p. azorica since they live in an insular system, with the consequent genetic isolation (Abrantes 2000).
Based on the mitochondrial gene cytochrome b, it has been suggested that the differentiation of the Azorean and some European populations of C. palumbus do not exist. The obtained pattern in the phylogenetic trees is consistent with a recent population expansion. However, it is stated that the sampling may have not been ideal and that the mtDNA marker may not have enough mutation rate to resolve relationships among these populations. The author recommended that the subspecies concept should not be applied to the Azorean population of Columba palumbus (Grosso 2002).
Another study achieved incongruent results on the matter, since the microsatellite data suggest an evident differentiation between C. p. azorica and C. p. palumbus, whereas mitochondrial (cytochrome b and cytochrome c oxidase I) and nuclear (β-fibrinogen – intron 7) markers point to the inexistence of a true differentiation. The study also included samples from Madeira Island (C. trocaz) and Canary Islands (C. bollii and C. junoniae), and they seem to be differentiated, suggesting an isolation by distance (Duarte 2006).
Figure 7: Columba livia (Photo:
J. M. Garg).
Figure 6: Columba bollii (Photo:
12
In 2007, Silva used another approach to clarify the taxonomic issue: SNPs. Results point to the differentiation between C. p. azorica and C. p. palumbus, as well as to the existence of similarities between C. p. azorica, C. trocaz and C. bollii. One hypothesis proposed by this author to explain these similarities is an initial colonization of Azores by ancestors of the current populations of C. palumbus from Europe, and then their divergence in the archipelago by geographic isolation. Then, this population has colonized Canary Islands, originating C. bollii, as well as the Madeira archipelago, originating C. trocaz. Later, a second colonization by the European Mainland C. palumbus may have occurred, and these new pigeons have formed hybrids with the local populations. Another hypothesis to explain the relation between C. p. azorica and C. p. palumbus and also with C. trocaz, is the occurrence of two colonizations from both populations. Those individuals have then originated hybrids. Silva (2007) also proposed other explanations, comprising convergent adaptation or reduction of background selection.
From the studies above mentioned, incongruent results have been achieved according to the molecular markers involved in each study - mtDNA or nDNA (microsatellites and SPNs). Thus, there is still a lack of knowledge on phylogeny and phylogeography concerning the genus Columba, namely the species living in the Atlantic Islands.
13
2. Thesis Aims
There are several goals to achieve in order to clarify the questions previously mentioned about the Columba species inhabiting the Azores, Madeira and the Canary Islands.
The first purpose is to increase the number of analyzed samples from previous studies, namely the following species: C. p. azorica (Azores), C. trocaz (Madeira), C. bollii and C. junoniae (Canary Islands) and also C. livia (from Azores, Madeira and Portugal).
In a previous work (Silva 2007), some samples were not analyzed for all genes studied, namely those from the Atlantic Islands and other European countries, such as Germany, Lithuania, Poland and Spain. Therefore, this goal is crucial in the current study as they may be interesting within the context of pigeon phylogeny.
As it was previously explained, when dealing with introns it is important to use a considerable number in order to obtain reliable results. Thus, another intention of the present study is to increase the number of introns analyzed.
It is also intended to use proper software for some assays, such as the haplotype reconstruction due to the presence of heterozygous sequences, as well as the detection of recombination.
With these approaches, this Master Thesis will contribute to clarify the evolutionary events behind the current distribution patterns and phylogeny among Atlantic Columba species under study, namely the colonization events and differentiation in the Azores.
14
3. Material and Methods
3.1 Sampling
Most of the samples used in the present work were collected between 1999 and 2000. Therefore, they were already present in the laboratory and conserved in 96% ethanol, at a temperature of -20ºC. The samples comprise tissue (muscle and liver) and feathers. New samples of C. trocaz (10 individuals) consisting of muscle were obtained and conserved as the previous ones. Were also obtained 54 samples (feathers) of C. l. atlantis from Azores, but they were in bad preservation conditions. Detailed collection data of samples can be consulted in Appendix I.
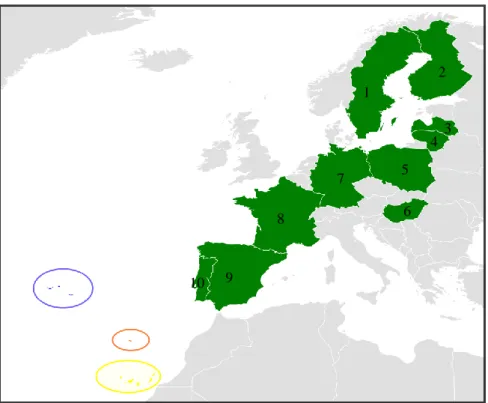
The map below (Figure 8) indicates the countries where the sampling was performed.
Figure 8: Sampling map of each species. Green: C. p. palumbus (Europe mainland – 1) Sweden, 2) Finland, 3)
Latvia, 4) Lithuania, 5) Poland, 6) Hungary, 7) Germany, 8) France, 9) Spain and 10) Portugal); blue: C. p.
azorica (Azores, Portugal); orange: C. trocaz (Madeira, Portugal); yellow: C. bollii and C. junoniae (Canary
Islands, Spain). 2 3 4 5 1 8 7 6 10 9
15
3.2 Selection of Suitable Molecular Markers
Since this work is a follow up of a previous one (Silva 2007), the first goal was to improve sampling, and amplify the same introns for the new added samples, as well as for some samples that were missing in Silva (2007) work, in order to increase the work robustness (observe Appendix II). Thus, in this work, the same four introns of Silva (2007) were used, from four different genes: growth hormone receptor (GHR – intron 9); ribosomal protein 40 (RP40 – intron 5); tropomyosin (TROP – intron 5) and fibrinogen β-chain (β-FIB – intron 7).
Nevertheless, and in the same purpose of increase work robustness, three new introns were chosen for this work based on some principles: they had to be present in different chromosomes, primers should have already been designed and the amplifications should have been previously tested in several species, in order to reduce the optimization procedures. So, fragments chosen were: ATP-citrate lyase (ACLY – intron 16) (Fonseca 2006), transforming growth factor - β2 (TGF-β2 – intron 5) and interferon regulatory factor 2 (IRF2 – intron 2) (Kimball et al. 2009). These introns have been tested in other works, such as Prychitko et al.(1997), Johnson et al. (2001), Russello & Amato (2004), Fonseca (2006), Brumfield et al. (2008) and Oliveros & Moyle (2010).
GHR gene encodes a protein that is a transmembrane receptor for growth hormone.
Binding of growth hormone to the receptor leads to the activation of an intra- and intercellular signal transduction pathway leading to growth (GeneCards Online Database1).
RP40 gene acts in ribosome formation and in the regulation of ribosome activity. It is
also a precursor for a membrane associated laminin receptor. It is known that chicken has a single gene, while mammals have several copies, being some of them pseudogenes (Friesen et al. 1999).
TROP is a protein involved in the control of muscle fibers’ contraction and relaxation
(Friesen et al. 1999).
β-FIB is a protein with two major functions: yielding monomers that polymerize into
fibrin and acting as a cofactor in platelet aggregation (GeneCards Online Database2).
ACLY is the first enzyme responsible for the synthesis of cytosolic acetyl-CoA in