CO
2capture and valorisation to
chemicals: methane production
Dissertation presented to the
University of Porto
for the degree of
Doctor of Philosophy in Chemical and Biological Engineering
by
CARLOS EDUARDO GERALDES DE VASCONCELOS MIGUEL
Supervisor: Prof. Dr. Luís Miguel Palma Madeira
Co-Supervisor: Prof. Dr. Adélio Miguel Magalhães Mendes
Department of Chemical Engineering
Faculty of Engineering
University of Porto
Abstract
In this work, a carbon capture and utilization (CCU) unit for CO2 capture
and conversion to methane was studied. A layered packed bed consisting in a high temperature CO2 sorbent and a methanation catalyst was considered to
perform both capture and conversion in the same unit, in a perspective of process intensification. The proof-of-concept of the sorptive reactor was performed using commercial materials in a lab-scale experimental setup which was built for such purpose allowing also to perform sorption or reaction experiments.
A thermodynamic analysis of the CO2 hydrogenation using as feed a
post-combustion stream was performed. Hydrogenation to methane is considerably less demanding in terms of pressure compared to the methanol option, particularly in the operating temperature window of available industrial catalysts. Regarding CO2 methanation, the negative effect caused by the presence of
oxygen on CO2 conversion recommends its removal from flue gas. Further
separation of CO2 from the remaining species present in flue gas is also
recommended to enrich the outlet stream with CH4.
Hydrotalcite sorbents were synthesized considering the partial substitution of aluminum by gallium and the promotion with K, Cs and Sr; their effect on CO2
sorption at high temperature (200-300 ºC) was studied. Cesium and, especially, potassium enhanced the sorption capacity of the hydrotalcite, while strontium decreased. A kinetic model assuming two parallel contributions was proposed for the sorption kinetics, which fitted very well the experiment data. Ga-substitution improved the sorption capacity of the hydrotalcite that performed well under cyclic operation. However, gallium incorporation increases the sorbent cost, which certainly restrains its utilization at industrial scale.
The intrinsic kinetics of CO2 methanation over an industrial nickel catalyst
model was validated through the simulation of an isothermal plug-flow reactor and a reasonable agreement between model predictions and the observed values was obtained.
The integrated sorption-reaction process for CO2 capture and conversion
to CH4 was studied between 300 ºC and 350 ºC and at low pressure (P ≤ 2.5
bar). The sorptive reactor had inside a layered bed of a commercial hydrotalcite sorbent (Pural MG30-K from Sasol) and a commercial nickel catalyst (METH 134 from Clariant). The materials proved their compatibility and stability under cyclic operation, at least under the considered operation conditions. The sorption equilibrium was well described by the dual-site Langmuir model, which considers that CO2 is sorbed through physical sorption (exothermic contribution) and
chemical reaction (endothermic contribution). Reactive regeneration mode (i.e. with a H2 stream) improved desorption kinetics, when compared to normal
regeneration (i.e. with a N2 stream), and allowed to completely recover the
sorbent capacity in each cycle. The steam produced in situ by the methanation reaction causes this positive effect. The synthetic flue gas used was made of CO2 and N2 only. CO2 conversion was high in batch operation (ca. 92 %) and
almost complete (99 %) when the reactor operated under continuous mode. The major drawback found in the operation of the sorptive reactor was the need for improving the methane purity; CO formation could be avoided by decreasing the temperature and/or increasing the pressure.
The use of highly permeable and selective metal membranes can be considered for feeding radially hydrogen to the methanation packed-bed reactor. The permeance towards H2 of a 50-µm thick PdAg membrane was then
measured between 200 ºC and 300 ºC considering a pure H2 stream or binary
H2/CO or H2/CO2 mixtures. The Sieverts law was observed for the former
conditions, while for the binary mixtures the Sieverts-Langmuir model explained the inhibitory effect on H2 permeance caused by CO and CO2. A modified
Sieverts-Langmuir equation was proposed to account for changes in the permeation driving-force under high H2 recovery conditions.
Resumo
Neste trabalho estudou-se uma unidade de captura e utilização de carbono (CCU) para a captura e conversão de CO2 em metano. Para realizar a
captura e conversão de CO2 na mesma unidade, foi considerado um leito
estratificado contendo um adsorvente de CO2 de alta temperatura e um
catalisador para a reação de metanação, numa perspetiva de intensificação de processos. A prova de conceito do reator adsortivo foi efetuada utilizando materiais comerciais e teve lugar numa unidade experimental à escala laboratorial que foi construída para este fim, a qual permite também realizar ensaios de adsorção e reação separadamente.
A reação de hidrogenação de CO2 foi estudada do ponto de vista
termodinâmico considerando como alimentação uma corrente de pós-combustão. A hidrogenação de CO2 para formação de metano é
consideravelmente menos exigente em termos de pressão de operação quando comparada com a opção do metanol, em particular na gama de temperatura de operação dos catalisadores industriais disponíveis. Em relação à reação de metanação, o efeito negativo causado pela presença de oxigénio na conversão do CO2 recomenda a sua remoção do gás de exaustão. A separação do CO2
das restantes espécies presentes no gás de exaustão também é recomendada, essencialmente para enriquecer a corrente de saída em CH4.
Foram sintetizadas hidrotalcites considerando a substituição parcial de alumínio por Ga e a modificação com K, Cs e Sr, tendo-se estudado o seu efeito na capacidade de adsorção de CO2 entre 200 ºC e 300 ºC. A impregnação com
césio e potássio, e deste último em particular, aumenta a capacidade de adsorção da hidrotalcite, enquanto o estrôncio diminui. Foi proposto um modelo para a cinética de adsorção considerando duas contribuições em paralelo, o qual ajustou muito bem os dados experimentais. A substituição com Ga melhorou a capacidade de adsorção e o adsorvente mostrou boa capacidade
A cinética verdadeira da metanação de CO2 foi determinada usando um
catalisador de níquel industrial entre 250 ºC e 350 ºC à pressão atmosférica. O modelo cinético selecionado foi adaptado da literatura (entre outros igualmente testados) e apresenta apenas 4 parâmetros de ajuste. O mecanismo assume a formação de uma espécie de formilo (CHO*) intermediária obtida após a adsorção dissociativa de H2 e CO2, bem como o grupo hidroxilo (OH*) como
espécie mais abundante na superfície do catalisador. O modelo foi validado através da simulação de um reactor isotérmico de leito fixo incluindo a cinética determinada e os resultados ajustam bem os dados experimentais.
O processo integrado de adsorção-reação para a captura e conversão de CO2 em CH4 foi estudado entre 300 ºC e 350 ºC a baixa pressão (P ≤ 2.5 bar).
O leito do reator adsortivo foi estruturado em camadas intercaladas de uma hidrotalcite comercial (Pural MG30-K da Sasol) e de um catalisador de níquel comercial (METH 134 da Clariant). Os materiais mostraram serem compatíveis e estáveis em operação cíclica, pelo menos nas condições de operação usadas. O equilíbrio de adsorção foi bem descrito pelo modelo de Langmuir de dois centros (dual-site), o qual considera que o CO2 é adsorvido através de adsorção
física (contribuição exotérmica) e reação química (contribuição endotérmica). A regeneração reativa (i.e. com uma corrente de H2) melhorou a cinética de
dessorção, quando comparada com a regeneração normal (i.e. com N2), tendo
permitido recuperar completamente a capacidade de adsorção em cada ciclo. O vapor de água produzido in situ pela reação de metanação provocou este efeito positivo. A corrente de gás de exaustão considerada foi feita apenas com CO2 e N2. A conversão de CO2 foi elevada em operação descontínua (ca. 92 %)
e quase total (99 %) quando o reator foi operado em modo contínuo. A maior contrariedade registada na operação do reator adsortivo foi a necessidade de aumentar-se a pureza do metano na corrente de saída; a formação de CO pode ser evitada diminuindo a temperatura ou aumentando a pressão.
O uso de membranas metálicas altamente permeavéis e seletivas pode ser considerado para se alimentar radialmente hidrogénio ao reactor de metanação de leito fixo. Mediu-se então a permeância ao H2 de uma membrana
de PdAg com 50 µm de espessura entre 200 ºC e 300 ºC considerando uma corrente pura de H2 ou mistura binárias de H2/CO ou H2/CO2. A lei de Sieverts
foi observada para o primeiro caso, enquanto o modelo de Sieverts-Langmuir descreve o efeito inibitório na permeação de H2 provocado pelo CO e CO2. Foi
proposta uma versão modificada deste modelo que considera as alterações na força diretriz da permeação e que deve ser aplicada em condições de elevada recuperação de H2.
Acknowledgments
In this section I would like to acknowledge all of you who, in many ways, gave me support throughout this journey.
I am grateful to my thesis supervisors, Prof. Luis Miguel Madeira and Prof. Adélio Mendes, for their guidance and encouragement. Both showed me how to think as a chemical engineer researcher. Thanks Professor Madeira for your confidence on my work, your comprehension during these years and for assuring me the best conditions to do my work. Thanks Professor Adélio for being always available and for your valuable comments.
To Eng. Silvano Tosti, from ENEA (Frascaty, Italy), I acknowledge for his collaboration (namely for providing the membranes) and sharing his expertise on Pd-based membranes.
I am grateful to Prof. Vicente Rives, Prof. Miguel Angel Vicente and Prof. Raquel Trujillano for welcoming me twice in the University of Salamanca (Spain) and for providing me guidance and sharing their knowledge in the synthesis and characterization of hydrotalcite materials.
I am grateful to Prof. Alírio Rodrigues for giving me the opportunity to finish the adsorption experiments at LSRE and move forward with my work when I faced endless problems with the gas sorption analyzer at LEPABE. I am grateful to Dr. Alexandre Ferreira for his help on the adsorption experiments and for sharing his knowledge during my stay at LSRE.
I would like to thank to Dr. Miguel Soria for helping me assembling the experimental unit, for his useful advices on experimental questions and for his scientific inputs in the works we have performed together. I am also grateful for our Monday morning talks about Sporting CP and River Plate performances during the weekend, which were very pleasant, especially when both teams had won.
To all my lab mates, FEUPsal team colleagues and friends outside the “academic and scientific world” I acknowledge for their camaraderie and
I acknowledge companies Sasol and Clariant for supplying the materials that I used in this work. I am grateful to Ana Taborda (Clariant) for her attention and sympathy.
To my parents António and Clarisse and my brothers Vanessa and Armando for their unconditional love.
To my wife Cristina for her love, patience, and generosity. This thesis is dedicated to her… and to our son Gustavo.
I acknowledge the Portuguese Foundation for Science and Technology (FCT) for my PhD grant (SFRH/BD/110580/2015) financed by national funds of the Ministry of Science, Technology and Higher Education and the European Social Fund (ESF) through the Human Capital Operational Programme (POCH). Furthermore, I would like to acknowledge also partial financial support of: ● Project PTDC/EQU/ERQ/098730/2008 financed by the European Fund for Regional Development (ERDF) through COMPETE - Operational Programme for Competitiveness Factors and through national funds by FCT;
● Project NORTE-07-0124-FEDER-000026 - RL1_ Energy funded by the ERDF through the COMPETE and ON.2 – O Novo Norte - North Portugal Regional Operational Programme and through national funds by FCT;
● Project PEst-C/EQB/UI0511 funded by national funds through FCT;
● Portugal-Spain Cooperation Integrated Action Nº E-59/10 funded by CRUP. ● Project POCI-01-0145-FEDER-006939 (Laboratory for Process Engineering, Environment, Biotechnology and Energy – UID/EQU/00511/2013) - funded by the ERDF through COMPETE2020 - Programa Operacional Competitividade e Internacionalização (POCI) – and by national funds through FCT;
● Project “LEPABE-2-ECO-INNOVATION”, with the reference NORTE‐01‐ 0145‐FEDER‐000005, supported by Norte Portugal Regional Operational Programme (NORTE 2020), under the Portugal 2020 Partnership Agreement, through the ERDF.
Contents
Abstract I
Resumo V
Acknowledgments IX
Chapter 1. General Introduction 1
1.1 Relevance and Motivation 2
1.1.1 Options for CO2 capture 3
1.1.1.1 Absorption 5
1.1.1.2 Membranes 6
1.1.1.3 Cryogenic distillation 9
1.1.1.4 Adsorption 10
1.1.2 Options for CO2 conversion 12
1.1.3 The Power-to-Gas concept 14
1.2 Overview of the Portuguese energy sector 17
1.2.1 Energy dependence 17
1.2.2 Energy from fossil fuels 19
1.2.2.1 Oil 19
1.2.2.2 Coal 20
1.2.2.3 Natural Gas 21
1.2.3 Energy from renewables 24
1.2.3.1 Geothermal 27
1.2.3.2 Photovoltaic 27
1.2.3.3 Biomass 28
1.2.4.1 Surplus renewable power 34
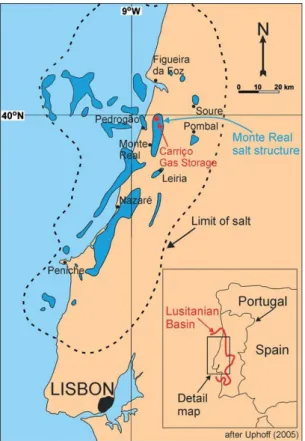
1.2.4.2 CO2 sources and availability 35
1.2.4.3 Natural gas grid 39
1.2.4.4 Summary 45
1.3 Objective and outline of the thesis 48
1.4 Acronyms 51
1.5 References 52
Chapter 2. Direct CO2 hydrogenation to methane and methanol from
post-combustion exhaust streams – a thermodynamic study 61
2.1 Introduction 62
2.2 Methodology 64
2.3 Results and Discussion 67
2.3.1 Strategies for CO2 valorisation: CH4 or CH3OH? 67
2.3.2 CO2 methanation: effect of pressure, temperature and H2/CO2
ratio 70
2.3.3 Direct CO2 methanation from coal-fired power plant (CF-PP)
flue gas streams 72
2.3.3.1 Effect of H2O 72
2.3.3.2 Effect of O2 74
2.3.3.3 Simultaneous effect of H2O and O2 75
2.4 Technological implementation 76
2.5 Conclusions 78
2.6 References 79
Chapter 3. High temperature CO2 sorption with gallium-substituted and
promoted hydrotalcites 83
3.1 Introduction 84
3.2 Experimental 86
3.2.1 Chemicals and gases 86
3.2.3 Sorbents characterization 88
3.3 Results and Discussion 89
3.3.1 Sorbents physicochemical characterization 89
3.3.1.1 TG / DTG 89
3.3.1.2 XRD 90
3.3.1.3 SEM / EDS 92
3.3.1.4 Physical adsorption of nitrogen at 77 K 94
3.3.1.5 FTIR 95
3.3.2 CO2 sorption experiments 97
3.3.2.1 Determination of adsorption equilibrium isotherms at 573
K – sorbent screening 97
3.3.2.2 Sorption-desorption experiments 100
3.4 Conclusions 107
3.5 References 108
Chapter 4. Intrinsic kinetics of CO2 methanation over an industrial
nickel-based catalyst 113
4.1 Introduction 114
4.2 Mechanisms for CO2 methanation 116
4.2.1 “Carbon intermediate” mechanism 116
4.2.2 “Formate intermediate” mechanism 118
4.2.3 “Formyl intermediate” mechanism 119
4.3 Experimental 121
4.3.1 Experimental setup 121
4.3.2 Kinetic experiments 122
4.3.3 Computational methods 124
4.4 Results and Discussion 125
4.4.1 Kinetic experiments 125
4.4.1.1 Isothermal regime and catalyst stability 125 4.4.1.2 Identifying the region of kinetic rate control 126
4.4.2 Modelling work 129 4.4.2.1 Model discrimination and parameter estimation 129
4.4.2.2 Model validation 132
4.5 Conclusions 138
4.6 Nomenclature 139
4.7 References 141
Chapter 5. A sorptive reactor for CO2 capture and conversion to
renewable methane 145
5.1 Introduction 146
5.2 Experimental 148
5.2.1 Experimental setup and hybrid unit 148
5.2.2 Sorption-desorption/reaction experiments 151 5.2.3 Process indicators: definitions and equations 152
5.3 Results and Discussion 154
5.3.1 Sorptive reactor under discontinuous operation mode 155
5.3.1.1 CO2 sorption working capacity 155
5.3.1.2 Effect of steam produced during reactive regeneration 156
5.3.1.3 Effect of temperature 165
5.3.1.4 Effect of pressure 168
5.3.2 Sorptive reactor under continuous operation mode 171
5.3.3 Reactor design considerations 174
5.4 Conclusions 175
5.5 Nomenclature 177
5.6 References 179
Chapter 6. Effect of CO and CO2 on H2 permeation through finger-like
Pd-Ag membranes 183
6.1 Introduction 184
6.3 Experimental 189 6.3.1 Membrane preparation and experimental set up 189
6.3.2 Gas permeation experiments 190
6.4 Results and Discussion 191
6.4.1 Pure H2 permeance experiments 191
6.4.2 Effect of CO and CO2 on H2 permeance 192
6.4.2.1 Comparison between Sieverts-Langmuir model and
rearranged equation 192
6.4.2.2 Modelling by the Sieverts-Langmuir equation 195
6.5 Conclusions 201
6.6 References 202
Chapter 7. Conclusions and Future Work 205
7.1 Conclusions 205
7.2 Future work 211
7.3 References 214
Appendix A. Supplementary information for Chapter 3 215
Appendix B. Supplementary information for Chapter 4 223
Appendix C. Supplementary information for Chapter 5 233
Chapter 1. General Introduction
This chapter presents the relevance and motivation behind this PhD study, listing the available options for CO2 capture and conversion. Among
these options, the Power-to-Gas concept is introduced and its implementation in Portugal forecasted based on the situation of the Portuguese energy sector. The chapter ends listing the PhD work objectives and providing the thesis outline.
1.1 Relevance and Motivation
The increase of CO2 concentration in the atmosphere, resulting from
human activity and excessive burning of fossil fuels, is considered the major contributor to global warming [1]. In this perspective, it is essential to develop strategies that lead to improved technologies regarding CO2 capture,
sequestration and recycling [2]. Although there are several examples of systems for capturing CO2 that have been used for several years [3], there are clear
technical and economic advantages in contemplating its conversion, particularly if substances that can bring added value to the process/company can be produced [2]. In these cases, CO2 can be seen as a raw material with null (or
even negative) cost, if used to produce chemicals and fuels, a market that opens potentially gigaton-level applications for CO2 utilization [4].
There are several products into which CO2 can be converted: fuels, the
intermediates of such substances or other value-added products, a topic that has been the subject of several reviews [4-8]. When choosing the technology to use for CO2 recycling several criteria should also be considered, such as the
associated costs, the market needs or the easiness of storage and transportation of the produced fuels/intermediates. For these reasons, the choice of the technology for CO2 recycling fell in the synthesis of CH4, which can be easily
integrated with the existing natural gas infrastructures [4]. In this process there is consumption of H2, and so this route should be viable when the H2 proceeds
from non-fossil sources [4, 7]. This is the case, for instance, when H2 is obtained
via water electrolysis. Additionally, the energy required for H2 production must
be also renewable (such as solar, wind, etc.) to approach a sustainable process from the carbon footprint point of view.
This thesis addresses therefore the sustainable production of methane while simultaneously reducing carbon dioxide emissions into the atmosphere by recycling carbon using renewable energy for “green” hydrogen production.
1.1.1 Options for CO
2capture
The International Energy Agency (IEA) estimated that CO2 emissions
reached 32.4 Gt in 2014 and this value is expected to grow up to 37.5 Gt of CO2
by 2035 [9]. Additionally, IEA also shows that the emissions resulting from electricity and heat generation in power plants represented in 2014 about 42 % of the global CO2 emissions, whereas the transport and industry sectors
accounted for 23 % and 19 %, respectively [9]. Developing more efficient and economical capture technologies is required to minimize the impact on the environment caused by greenhouse gases (GHG) emissions when the world’s economy still intensively relies on the combustion of fossil fuels for energy production.
The efficiency of capture technologies depends on several conditions such as the exhaust stream composition, temperature and pressure. CO2 content in
a post-combustion exhaust stream from a natural gas power plant can be as low as 4 %, up to 15 % in a coal power plant, and between 20-30 % in cement and steel production plants [10]. Higher values are obtained in pre-combustion streams, such as those observed in syngas production processes, like hydrocarbons reforming or gasification. Syngas is commonly produced via the steam reforming of methane (SRM) (Eq. (1.1)) and water-gas shift (WGS) reactions (Eq. (1.2)). In these processes, CO2 can be captured by adsorption
during reaction - the so-called Sorption-Enhanced Reaction Processes (SERP) (e.g. [11-14]). -1 4 2 2 298 K CH + H O CO + 3H H 205.9 kJ mol (1.1) -1 2 2 2 298 K CO + H O CO + H H 41.1 kJ mol (1.2)
direction of product formation so that the overall performance is improved. Therefore, in theory this concept allows obtaining:
I. An higher reactant conversion when compared to a traditional packed-bed reactor in the same operating conditions;
II. Two separate H2- and CO2-rich streams during the adsorption and
desorption stages, respectively.
In gasification processes, namely in Integrated Coal Gasification Combined Cycle (IGCCC) systems, CO2 is typically captured by absorption with
amines prior to H2 combustion for electricity production in a gas turbine
combined-cycle [3, 15]. From a thermodynamic point of view, and for streams at the same temperature and pressure, less work is required for the separation in streams with high CO2 contents, which is the case found in pre-combustion
approaches as illustrated in Fig. 1.1.
Fig. 1.1 – Minimum thermodynamic work for various coal or gas-to-electricity
conversions. NGCC: natural gas combined cycle; PCC: Post-combustion capture; IGCC: Integrated Coal Gasification combined cycle. Reprinted by permission from Springer Nature: Springer, Carbon Capture by Jennifer Wilcox, Copyright (2012).
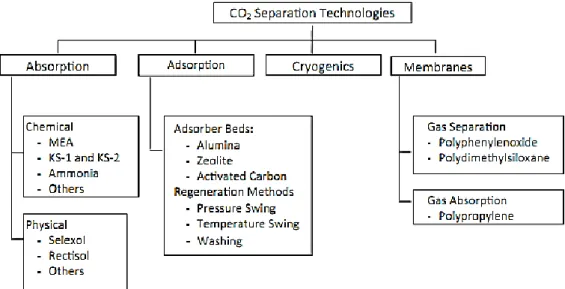
Fig. 1.2 shows a diagram presenting the available CO2 separation
technologies. Each technology will be briefly addressed in the following sections.
Fig. 1.2 - Carbon dioxide separation technologies. Reprinted from Chemical Engineering
Research and Design, 89, M. Wang, A. Lawal, P. Stephenson, J. Sidders, C. Ramshaw, Post-combustion CO2 capture with chemical absorption: A state-of-the-art review, 1609-1624, Copyright (2011), with permission from Elsevier.
1.1.1.1 Absorption
CO2 capture by absorption with amines is the most mature and established
solution among the various options available, taking place for over 70 years [3]. Absorption technology is based on the transfer of a solute from a gas- to a liquid-phase and requires two connected columns. On one column the solute (i.e. CO2)
is being separated due to its affinity with the solvent (amine) and in the second one it is released while the solvent is regenerated for further usage (Fig. 1.3).
Fig. 1.3 - Typical CO2 absorption process scheme. Reprinted from Separation Science and Technology, 40, D. Aaron, C. Tsouris, Separation of CO2 from flue gas: a review, 321-348, Copyright (2005), with permission from Taylor & Francis.
The efficiency of the removal is based on the CO2 solubility, diffusivity and
chemical reactivity with the solvent. The most common solvent used is monoethanolamine (MEA), particularly for low CO2 concentrations (<15 vol. %)
[16]; the industrial standard for CO2 removal using MEA is ca. 60 gCO2·kgMEA-1 (or
1.36 molCO2 kgMEA-1) [17]. The operation and maintenance cost including solvent
replacement is about $40-$70 per ton of CO2. Temperature requirements for
solvent regeneration represent ca. 70-80 % of the operating cost [16].
1.1.1.2 Membranes
Membranes can be porous or non-porous and the dominant related transport mechanisms for each type are illustrated in Fig. 1.4.
a) b) c) d)
Fig. 1.4 – Transport mechanisms for (a-c) porous and (d) non-porous membranes: a)
convective flow, b) Knudsen diffusion, c) activated transport/molecular sieving and d) solution-diffusion (adapted from [18]).
As illustrated in Fig. 1.4, separation in porous membranes relies on molecular size difference between species present in the mixture (Fig. 1.4c) and/or their diffusivity rates (Fig. 1.4b). In the former, only molecules having a smaller size than the pores are able to pass through the membrane, while on the latter the fastest molecules are firstly recovered at the permeate side. Depending on the pore size range, porous membranes can be classified according to the classes presented in Table 1.1.
Table 1.1 - Porous membranes classifications [19]. Classification Pore size range (nm)
Microfiltration 100-5000
Ultrafiltration 1-100
Nanofiltration 0.5-10
Reverse osmosis < 0.5
However, the kinetic diameter of species typically present in flue gas streams are very similar (cf. Table 1.2). Thus, preparing membranes with a narrow pore size distribution is complex and, generally, high selectivity towards CO2 is difficult to achieve. Besides, water vapour condensation may block the
Table 1.2 – Kinetic diameter of species typically found in flue gas streams [18]. Molecule Kinetic diameter (nm)
CH4 0.380 CO 0.376 N2 0.364 O2 0.346 CO2 0.330 H2 0.289 H2O 0.280
Examples of porous membranes for CO2 separation includes zeolite
membranes, carbon molecular sieve and metal-organic frameworks (MOF’s) based membranes [3]. The most common non-porous membranes are based on polymers (e.g. poly-acetylenes, polyaniline, polyarylates, polycarbonates, polyetherimides, polyimides, polysulfones) [20]. In the work by Robeson [21], the relationship between permeability and separation for several gas pairs and polymeric membranes is given; a trade-off relationship shows that, in general, the higher the permeability, the lower is the selectivity.
Another class of non-porous membranes are the facilitated-transport membranes (also referred as carrier mediated transport membranes). These membranes can be divided in two classes: mobile- and fixed-carrier [22]. The working principle is based on the reaction of CO2 with a carrier (e.g. amine) to
form a complex at the feed side, being regenerated in the permeate side (c.f. Fig. 1.5). The remaining feed gases that do not react with the carrier agent permeate by the solution-diffusion mechanism or remain in the retentate side [23].
The applicability of membrane separation for CO2 capture from a power
plant exhaust stream is mostly compromised due to the simultaneous low CO2
content and pressure, not providing the required driving-force for effective permeation [3]. For this reason, membrane systems are more suitable for application in pre-combustion capture, where a higher CO2 fraction and pressure
can be found. However, to this technology become competitive, cheap, selective, and stable membranes at high temperatures are required. If these
requirements are fulfilled, membrane systems present important advantages such as the easiness of operation, low maintenance work, easy scale-up and, eventually, the exemption of a regeneration stage.
Fig. 1.5 – Illustration showing the facilitated-transport mechanism. Reprinted with
permission from Industrial & Engineering Chemistry Research, 47, J. Huang, J. Zou, W. S. Winston Ho, Carbon dioxide capture using a CO2-selective facilitated transport membrane. Copyright (2008) American Chemical Society.
1.1.1.3 Cryogenic distillation
Cryogenic distillation is used to separate CO2 from N2 (cf. Fig. 1.6). Thus,
the remaining flue gas species must be previously removed [16].
Fig. 1.6 – Cryogenic distillation process for CO2 separation. Reprinted from Separation Science and Technology, 40, D. Aaron, C. Tsouris, Separation of CO2 from flue gas: a review, 321-348, Copyright (2005), with permission from Taylor & Francis.
As depicted in Fig. 1.6, while CO2 is being liquefied at the bottom of the
energy consumption necessary to maintain the cool temperature (CO2 triple
point is 216.55 K at 5.185 atm), making this technology costly and thus less interesting than other options available [16].
1.1.1.4 Adsorption
Adsorption processes showed already their effectiveness in the separation of dilute streams [3]. Different categories of materials can be used for CO2
adsorption depending on the operating temperature as shown in Fig. 1.7.
Fig. 1.7 – CO2 adsorbent materials options as a function of the temperature [24].
Zeolites, activated carbons and organic-inorganic hybrids are limited to temperatures up to 400 K. Recently, metal-organic frameworks (MOF’s) have attracted the attention for CO2 capture. This type of sorbents are made of
transition metal ions and organic linkers resulting in highly organized and porous structures with high surface areas, but their performance towards CO2 capture
is also substantially detrimentally affected by the presence of water vapour [25, 26].
Hydrotalcites are cheap materials that can be used at temperatures between 473 and 673 K, a range typically found in both post-combustion and pre-combustion streams. Although hydrotalcites use at temperatures above 673 K has also been reported [27], lithium zirconates and calcium oxides are options more suited for CO2 capture at high temperatures (673-873 K).
Exhibiting a reasonably good adsorption capacity and stability, hydrotalcites are easily regenerated by temperature or pressure swing [25, 28]. Moreover, water vapour benefits adsorption because it promotes the reconstruction of their layered structure (see Fig. 1.8), a characteristic of these materials known as memory effect [29, 30]. This is a distinctive feature of these materials compared to other adsorbents, making them suitable for CO2 capture
in processes were water vapour is present (e.g. flue gas from fossil fuels combustion or in sorption enhanced processes for H2 production (i.e.
pre-combustion capture)).
Fig. 1.8 – Illustration showing the layered structure of a hydrotalcite. Reprinted with
permission from Chemistry of Materials, 16, N.D. Hutson, S.A. Speakman, E.A. Payzant, Structural effects on the high temperature adsorption of CO2 on a synthetic hydrotalcite. Copyright (2004) American Chemical Society.
Studies addressing some aspects that influence the hydrotalcite thermal stability, CO2 adsorption/desorption kinetics and equilibrium such as the
Mg2+/Al3+ ratio, the substitution of the compensating anion, the calcination
1.1.2 Options for CO
2conversion
Some reviews provide a comprehensive insight about emerging technologies for CO2 recycling (e.g. [4, 34]). Since CO2 molecule has low
reactivity, its conversion requires high-energy reaction “partners” (e.g. H2). For
this reason, although some existing technologies for CO2 conversion are
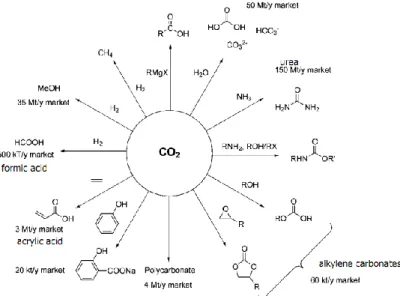
well-established (e.g. urea, methanol or methane production), the development of innovative routes with industrial potential will be surely closely linked to the design of novel catalysts, particularly for methanol synthesis [2]. Fig. 1.9 shows the options for CO2 conversion into chemical commodities along with the
corresponding market volume.
Fig. 1.9 – CO2 conversion options into chemicals and market volume. Reproduced from Ref. [35] with permission from the Royal Society of Chemistry.
Among the options presented in Fig. 1.9, the use of CO2 as precursor in
organic carboxylation reactions or in reduction reactions are the most promising routes. In organic carboxylation reactions, CO2 is used for the production of
carbonates, acrylates, carboxylic acids and polymeric materials [36]. For instance, polyurethane contains as much as 40 wt. % of CO2 and if used as an
insulating material (e.g. in buildings), it is claimed that can avoid up to 70 kg of CO2 emissions for every kilogram of fixated CO2 [4]. However, it is claimed that
the plastics market is not large enough in order to restrain CO2 emissions as
needed [4].
Using CO2 to produce algae is another open topic in the literature, although
it has been reported that the production costs of algal biomass are still too high to cultivate algae for biomass-to-energy applications and that, for now, the balance appears unfavourable when compared to fossil fuel alternatives [2, 4].
On the other hand, CO2 reduction to produce methanol, methane, ethanol,
formic acid, syngas and dimethyl ether opens gigaton-level applications for CO2
utilization [4, 37]. However, these reactions require H2 which is widely produced
by steam methane reforming process [38]. For this reason, H2 production should
use renewable resources, or electrons as reducing agent in electrochemical applications, so that these CO2 recycling options can be sustainable from the
global carbon footprint point of view (cf. Fig. 1.10).
Fig. 1.10 – Renewable power and CO2 storage routes. Reprinted from Renewable and Sustainable Energy Reviews, 69, M. Bailera, P. Lisbona, L. M Romeo, S. Espatolero, Power to Gas projects review: lab, pilot and demo plants for storing renewable energy
1.1.3 The Power-to-Gas concept
The “Power-to-Gas” (PtG) concept is based on the conversion of surplus electricity obtained from a renewable source (sun, wind, etc.) into a gas easily transported and stored. The conversion to CH4 benefits from the existence of a
well-established natural gas infrastructure into where methane can be injected, enabling the integration/optimization of power and gas grids; this allows the stabilization of the power grid driven by electricity consumption through the reconversion of the energy carrier produced, in this case methane [39].
The PtG concept can thus be subdivided in 2 domains: 1) Energetic, aiming to improve renewable energy technologies/processes and 2) Environmental, since promoting the efficiency of renewables and CO2 capture
and utilization, it tackles climate changes resulting from CO2 emissions and
contributes for reducing the carbon footprint. Since the current energy infrastructure relying on fossil fuels is unlikely to change in the forthcoming years, the production of valuable CH4 from waste CO2 can thus be an interesting
carbon management solution.
From the technological viewpoint, the process consists on the production of CH4 from the catalytic reaction between CO2 and H2 through the methanation
(or Sabatier) reaction (Eq. (1.3)).
-1
2 2 4 2 298 K
CO + 4H CH + 2H O H = - 165 kJ mol (1.3)
The surplus renewable electricity is used for H2O electrolysis (Eq. (1.4))
to obtain “green” H2 necessary for the methanation.
-1 2 2 2 298 K 1 H O H + O = 285.8 kJ mol 2 H (1.4)
During electrolysis, the application of an electric potential to two electrodes leads to the splitting of H2O molecule into hydrogen and oxygen at
the cathode and anode, respectively. The electrolysers can be classified regarding to the used electrolyte as: i) alkaline water electrolysis (AEL), ii) proton exchange membrane electrolysis (PEM) and iii) solid oxide electrolysis (SOEC), also known as high-temperature water electrolysis [40]. Currently, AEL is the cheapest and most reliable technology, PEM the most promising (in the near future) for transient operation and SOEC is still in the development phase [41].
With respect to CO2 sources, several processes may provide the
necessary feedstock: coal or biomass gasification (for syngas production), biomass anaerobic fermentation (for biogas production), or flue gas streams of varied industrial processes (e.g. coal and natural gas power plants, refineries, cement and steel industries, etc.), requiring however its separation from other coexisting species (e.g. N2, H2O, O2, etc.) prior to methanation.
CO2 purification requirements may differ substantially depending on the
carbon source considered, which has direct influence on PtG process configuration and flexibility.
In the European context, due to the increasing share of renewable energy across the electricity mix, the demand for balancing the electricity supply and the demand over spatial and temporal distances is increasing, constituting the major drivers towards the implementation of PtG processes [42].
The largest PtG plant worldwide is the Audi e-gas plant in Wertle, Germany, where 3 AEL (total electric power of 6 MW) are used to produce hydrogen, whereas carbon dioxide comes from a biogas plant [41]. The substitute natural gas (SNG) production capacity of this plant is, in average, around 1.4x10⁶ m3/year [43]. A picture of the Audi e-gas plant is shown in Fig.
Fig. 1.11 – Audi e-gas plant in Wertle (Germany). Reproduced from Ref. [44]. © Audi
AG.
Another demonstration activity in Germany is the KIC-Project, DemoSNG, where the methanator is fed with a volumetric feed flow rate of 10 Nm3/h [45].
The pilot plant is enclosed in a standard shipping container and is currently under operation in a biomass gasification plant located in Köping, Sweden.
In Denmark, the BioCatProject developed by Eletrochaea uses biological methanation as a part of the Power-to-Gas process chain. The plant uses an advanced version of Hydrogenics’ S1000 alkaline electrolyser to produce H2 that
is fed to the biological methanation system together with CO2 from: raw biogas
from an adjacent anaerobic digester with a composition of approximately 60% CH4 and 40% CO2, or a pure stream of CO2 supplied by an on-site biogas
upgrading system [46]. The plant is located at the BIOFOS Avedøre wastewater treatment plant near Copenhagen.
A full list of Power-to-Gas projects in the lab, pilot and demonstration stages was recently presented in the review by Bailera et al. [47], showing that most activities take place in Europe, particularly because of the support of governments from Germany, Denmark and Switzerland.
1.2 Overview of the Portuguese energy sector
1.2.1 Energy dependence
The energy dependence of a country is an indicator that expresses the extent to which an economy relies upon imports to meet its energy needs. The indicator is calculated as net imports of primary energy (IMP-EXP) divided by the sum of gross inland energy consumption (GIC) plus international maritime bunkers (IMB), which are quantities of fuels delivered to ships of all flags that are engaged in international navigation (cf. Eq. (1.5)) [48].
100 IMP EXP Energy Dependence GIC IMB (1.5)
Hence, a country that exports more primary energy than imports has a negative energy dependence or, in a simpler way, it is said to be energetically independent. The Portuguese energy dependence and of the Euro-economic area (EU-19) and European Union countries (EU-28) are shown in Fig. 1.12.
Fig. 1.12 – Portuguese energy dependence: a) along recent years and b) comparison
countries has a negative energy dependence (cf. Fig. 1.12b), all depending on primary energy imports to satisfy the energetic needs.
The normalized consumption of primary energy (CPE) per type of source in Portugal is depicted in Fig. 1.13a, for the period 2000-2015. The country situation is compared with those from EU-19 and EU-28 group countries for the year 2015 in Fig. 1.13b.
The National Energy Strategy approved by the Portuguese government in 2005 settled strategic policies such as the energy market liberalization, the promotion of renewable energies and technologies with improved efficiencies [49]. Consequently, in the following decade the oil share remarkably declined (i.e. 14.6 %), being replaced by natural gas and renewable energies, whose values increased 4 % and 9 %, respectively, while the coal share practically remained constant in the same period (rise of only 1.6 %) (cf. Fig. 1.13a). Still, oil, natural gas and coal together represented 78 % of the consumed primary energy in 2015, a value slightly above EU-19 (72 %) and EU-28 (73 %) group countries, whose patterns are identical (cf. Fig. 1.13b). Notably, the remaining primary energy consumed was exclusively based on renewable energies (22 %), which turned Portugal the country with 5th highest share of renewables amongst
EU-28 countries [50]. If only the consumption of primary energy for electricity generation is considered, then the share of renewables is even higher; in 2015, 44.6 % of all electricity produced in Portugal was obtained from renewable resources [51].
Nuclear has almost the same weight as renewable energies (ca. 13-15 %) in EU-19 and EU-28 groups, although it is absent in some members like Portugal.
Fig. 1.13 – Normalized primary energy consumption per type of source in Portugal: a)
from 2000 to 2015 and b) comparison with EU groups in 2015. Author calculations based on data taken from Eurostat online database [48] and excluding the negligible contribution of non-renewable waste sources.
A description of the current situation regarding fossil fuels and renewable energy contributions to the Portuguese energy sector is given in sections 1.2.2 and 1.2.3, respectively, with particular emphasis on renewable power production, as it is one of the main building blocks of Power-to-Gas technologies.
1.2.2 Energy from fossil fuels
1.2.2.1 Oil
Portugal does not have indigenous oil reserves although regular onshore and offshore exploration activities have been carried out since 1940. Therefore, all the oil consumed by the country is imported. Table 1.3 lists the top-5 supplier countries from 2014 to 2016.
Table 1.3 – Top-5 oil suppliers and corresponding share (based on data taken from [52]).
Top-5 2014 2015 2016
1st Angola (26.1 %) Angola (22.9 %) Angola (24.9 %)
2nd Saudi Arabia (12.6 %) Saudi Arabia (14.2 %) Russia (19.7 %) 3rd Algeria (9.9 %) Kazakhstan (10.6 %) Azerbaijan (11.1 %)
4th Kazakhstan (9.7 %) Algeria (9.5 %) Saudi Arabia (10.8 %)
5th Azerbaijan (9.2 %) Azerbaijan (9.0 %) Kazakhstan (9.3 %)
Year 2000 2005 2010 2015 C PE i / C PE tot al x 100 0 20 40 60 80 100 a) b)
EU-28 EU-19 Portugal
C PE i / C PE tot al x 100 0 20 40 60 80 100 Oil Natural gas Coal Renewables Nuclear
In the listed years, Portugal imported oil from 13 to 15 countries and the top-5 oil suppliers were responsible for around 66-76 % of the total imported oil. Angola is the major oil supplier with a contribution of ca. 25 %. Diversification of oil suppliers along the years has contributed to assure reliable and secure access to energy resources [53].
Final consumption of oil by activity sector is shown in Fig. 1.14. It shows that the transportation sector is responsible for the largest share of final oil consumption (ca. 75-79 %). The use of oil by all sectors declined in the 5-year period, except the Agriculture/Forestry that remained practicaly constant. Within the Industry sector, the non-metallic minerals industries (e.g. cement, glass, etc.) are responsible for ca. 50-60 % of oil consumed by the industry sector.
Fig. 1.14 – Evolution of oil products final energy consumption in Portugal by activity
sectors from 2010 to 2015 (data taken from [54]).
1.2.2.2 Coal
After national coal production has ceased in 1994, Portugal dependence on imported coal to secure its energy needs increased. Portugal imported 4.5 Mt of coal from Colombia (88.1 %), United States (6.6 %), South Africa (3.5 %) and
Ukraine (1.8%) in 2014 [50]. Coal consumed in Portugal is of the bituminous type and is used essentially for electricity generation in two coal-fired power plants located in Sines (1250 MW) and Pego (620 MW). These plants act as a backup system guaranteeing that power demand is fulfilled in periods of low renewable power production. Coal consumption is particularly dependent on hydrological conditions, namely when hydropower output is compromised in drought periods.
The remaining imported coal that is used for final energy consumption is negligible when compared to the quantity used for electricity production. For instance, in 2015, the quantity of coal used for electricity and for final energy consumption was 3246 ktoe vs. 12 ktoe (136 PJ vs. 502 TJ), respectively. Only the industry sector consumes coal for final energy purposes, namely the iron and steel, chemical/petrochemical and non-metallic minerals industries (e.g. cement industry), as shown in Fig. 1.15.
Fig. 1.15 – Coal use for final energy consumption by industry sub-sectors from 2010 to
2015 [54].
1.2.2.3 Natural Gas
Portugal absence of natural gas resources requires that the country needs Year 2010 2011 2012 2013 2014 2015 Fin al consum pt ion / kto e 0 10 20 30 40 Non-metallic minerals Iron & Steel
shows natural gas import origins and corresponding volumes regarding years 2014 and 2015.
Table 1.4 – Natural gas imports (106 m3) in the years 2014 and 2015 [55].
Origin 2014 2015
Natural gas (pipeline) 2736 3002
Algeria 2196 2111
Spain 535 891
Not specified 5
Liquefied natural gas (ships) 1523 1687
Algeria 102 210
Qatar 687 224
Nigeria 352 1166
Norway 80 80
Spain* 6 7
Trinidad and Tobago 223
Not specified 73
TOTAL 4259 4777
* LNG imported using tanker trucks.
Around 62-64 % of supplies were received through pipeline, while the remaining part, in the liquefied state, was transported to Portugal in ships that unload at the liquefied natural gas (LNG) terminal of Sines port, on the southern part of Portugal. Only a negligible quantity (6-7x10⁶ m3) was imported, using
tanker trucks, exclusively from Spain. The most important supplier is Algeria, with a share ranging 49-54 % in the presented years, while Qatar and Nigeria were the major suppliers of LNG.
Final energy consumption of natural gas by activity sector is shown in Fig. 1.16. The Industry sector accounts for the largest amount of natural gas consumption (67-74 %), followed by Residential (16-19 %) and Services (13-14 %) sectors. The use of natural gas in Agriculture/Forest and Transportation sectors is negligible and both sectors represent only ca. 1 % of the total final consumption. Energy for transportation is secured essentially by oil products (as shown in section 1.2.2.1) and natural gas represents a negligible quantity; for instance, in 2015, the quantity of oil and natural gas consumed for transportation were 6245 ktoe vs. 13 ktoe, respectively.
Fig. 1.16 - Natural gas for final energy consumption in Portugal by activity sectors from
2010 to 2015 (data taken from [54]).
Table 1.5 lists the natural gas consumption by the different industrial sectors during 2005, 2014 and 2015.
Table 1.5 – Final energy consumption (ktoe) of natural gas by the Portuguese Industry
(data taken from [54]).
Industry 2005 2014 2015 Δ
(2015/2005)
Paper, Pulp, and Print 38.1 90.2 111.6 2.93
Construction 5.8 13.1 14.5 2.48
Chemical and Petrochemical industry 64.4 142.1 152.7 2.37
Food and Tobacco 66.5 124.6 147.2 2.21
Non-ferrous metal industry 7.6 12.9 16.0 2.09
Machinery 21.3 32.6 36.0 1.69
Iron & steel industry 41.4 47.4 51.1 1.23
Textile and Leather 128.6 131.4 131.9 1.03
Non-metallic Minerals (e.g. cement) 516.6 426.3 441.6 0.85
Wood and Wood Products 9.7 9.0 7.8 0.81
Mining and Quarrying 6.3 5.1 4.6 0.74
Transport Equipment 28.8 14.9 16.6 0.58
Non-specified (Industry) 20.9 7.2 5.8 0.28
The non-metallic minerals sector is the most relevant consumer of natural gas amongst the industries listed in Table 1.5. Its consumption is practically the same as the sum of the 2nd, 3rd and 4th industrial sectors with higher natural gas
consumption. Table 1.5 highlights the growing importance of natural gas over time and across several industrial activities. Natural gas consumption significantly increased since 2005 in almost every industrial activity (see relative variation in last column). Amongst them, due to their weight in current natural gas consumption, it is noteworthy the remarkable demand increase by the Paper, Pulp and Print (2.93), Chemical and Petrochemical (2.37) and Food and Tobacco (2.21) industries.
Globally, the natural gas demand increased 19 % in the 2005-2015 decade, which reflects its growing importance in almost every activities of the Portuguese industry sector.
1.2.3 Energy from renewables
The Renewable Energy Roadmap 21 sets a share for renewables dissemination in the overall European energy mix of 20 % by 2020 [56]. Some countries, where Portugal is included, have already reached or even surpassed this target [41, 51]. The strategic effort to replace fossil fuels by renewable energies has made Portugal to become one of Europe’s leaders in terms of use of renewable energy sources (RES) [50]. Table 1.6 lists the amount (in ktoe) of renewable energy produced in Portugal in the 2005-2015 decade.
Since 2006 that Portugal produces biodiesel which is incorporated almost completely in diesel and only a small fraction (ca. 1 %) is directly sold to the market. Soybean and, particularly, colza oils are the most used raw materials [57].
Table 1.6 – Portuguese annual production of renewable energy (ktoe) from 2005 to 2015 [51]. Renewable energy type 2005 2007 2009 2011 2013 2015 Δ (2015/2005) Biofuels 0 162 226 330 274 321 - Electricity1 599 1265 1456 1872 2369 1927 3.2 Biomass2 2773 2891 3019 2571 2812 2781 1.0 Other renewables3 20 23 36 61 74 82 4.1 Total 3392 4342 4737 4835 5530 5110 1.5
More than a half of renewable energy produced in Portugal comes from biomass, although that share declined from 82 % to 54 %, when comparing the values of 2005 and 2015, respectively. The amount of biomass-based energy produced remained practically constant along the 2005-2015 decade, while the production of electricity increased 3.2 times, reaching a share of 38 % of the total renewable energy produced in 2015 (cf. Table 1.6). It is note to worth that electricity values shown in Table 1.6 consider only hydro, wind, photovoltaic and geothermal contributions, although an important share of biomass is also used for electricity generation in thermoelectric and co-generation plants.
Since renewable power is one of the main building blocks of the Power-to-Gas concept, it will be specifically addressed in more detail below. The current status of energy production from biofuels and biomass can be found elsewhere (e.g. [50]).
The investment made on the different RES for power production is highlighted through the analysis of the installed capacity (MW) values listed in Table 1.7. The most established RES’s for electricity production in Portugal are hydro and wind, both totaling 90 % of the installed capacity. Biomass is the third RES with higher installed capacity, followed closely by photovoltaic, which remarkably increased 150 times in the 2005-2015 decade. During this period,
wind energy installed capacity increased 4.7 times and was by far the type of RES with the highest absolute variation (i.e. 3971 MW).
Table 1.7 – RES installed capacity (MW) for electricity production and corresponding
variation in the 2005-2015 decade [51, 58].
RES 2005 2007 2009 2011 2013 2015 Δ (2015/2005) Geothermal 18 29 29 29 29 29 1.6 Photovoltaic 3 15 110 175 299 451 150.3 Biomass 429 449 518 712 718 726 1.7 Wind 1063 1699 3564 4378 4731 5034 4.7 Hydro 4816 4853 4883 5330 5533 6053 1.3 Total 6329 7045 9104 10624 11310 12293 1.9
Among biomass, it should be mentioned the evolution of biogas production, whose installed capacity increased from 8 MW (in 2005) to 85 MW (in 2015), while the capacity for energy generation from urban solid wastes only increased 3 MW, reaching a total capacity of 89 MW in 2015.
The exploitation of the installed capacity to produce renewable power from the different RES is provided in Table 1.8.
Table 1.8 – Annual renewable power production (GWh) [51, 58].
RES 2005 2007 2009 2011 2013 2015 Δ (2015/2005) Geothermal 71 201 184 210 197 204 2.9 Photovoltaic 3 24 160 282 479 799 266.3 Biomass 1651 1883 2086 2924 3052 3104 1.9 Wind 1773 4036 7577 9162 12015 11608 6.5 Hydro 5118 10449 9009 12114 14868 9800 1.9 Total 8616 16593 19016 24692 30610 25514 3.0
The values listed in Table 1.8 shows that renewable power production has considerably increased in the 2005-2015 decade for all RES, as discussed in the following sections.
1.2.3.1 Geothermal
Among the RES, high temperature geothermal resources are confined to the Azores archipelago where this kind of energy plays an important role. Two geothermal power plants in operation at S. Miguel island, corresponding to a global installed capacity of 23 MW, are responsible for the production of 42 % of the consumed electricity (i.e. around 22 % of the archipelago total demand). Plans to increase the installed capacity up to 28.5 MW until 2019 have been reported [59]. Fig. 1.17 shows the geothermal plant in Ribeira Grande.
The IEA reported that enhanced geothermal systems technology, which uses thermal energy from high-temperature rocks (dry rocks) located at great depths, may be suitable to explore the potential geothermal resources in mainland and be tested in the future [50]. Still, Portugal is the 5th country among
IEA-29 members with the highest share of geothermal energy used for power production [50].
Fig. 1.17 – Geothermal plant (13 MW) in Ribeira Grande (S. Miguel island, Azores) [60].
1.2.3.2 Photovoltaic
yearly solar radiation in Europe after Cyprus, particularly in Alentejo region, in the south of the territory, where the country has a current installed capacity of 162 MW (out of a total of 467 MW) [51, 61]. Moura photovoltaic plant (Fig. 1.18) is in fact one of the biggest in world with an installed capacity of 46 MW.
Fig. 1.18 – Photovoltaic plant (46 MW) in Moura (Alentejo, south of Portugal) [62].
It is expected that solar energy will play an important role in decentralised power production. A mini-generation programme created in 2011 has a target to install approximately 250 MW of new capacity by 2020 in the country [50].
1.2.3.3 Biomass
Regarding biomass, the most common resources available in Portugal are wood residues, animal waste and municipal solid waste [61]. It was estimated that the country’s total biomass potential is 42.5 TWh/year, being municipal solid wastes the main resource (17.0 TWh/year) [61]. Based on the estimated potential, it was also reported that the use of municipal solid wastes, animal manure and waste waters are still underexploited [61]. In 2015, 586 GWh of power was generated from biogas and urban solid wastes (ca. 294 GWh each), together representing 19 % of the total power produced from biomass (i.e. 3.10 TWh).
Power production from biomass is more developed in the center region of the country, representing 62 % of the total power produced from biomass in 2015. Fig. 1.19 shows the largest biomass power plant of the country (30 MW) located in Figueira da Foz.
Fig. 1.19 – Celbi biomass (forest residues) power plant (30 MW) located in Figueira da
Foz (center of Portugal) [63].
1.2.3.4 Hydropower
Hydropower production takes place in 184 hydropower plants, considering both large (≥ 10 MW) and small plants (<10 MW) [64]. Portugal mainland most important river basins are: Lima, Cávado, Mondego, Tejo, Guadiana and, particularly, Douro, which is responsible for more than a half of the hydropower generated in the country [51]. Portugal has storage, run-of-the-river and pumped-storage type hydropower plants. Storage plants accumulate large quantities of water that can be used on the driest months, while run-of-river may include a small storage capacity, but generally the turbines are in operation depending on the river flow. Pumped-storage plants are conventional plants that were modified to include a system for pumping water from a lower elevation reservoir to a higher elevation, allowing to store energy in the form of
type of plants has recently gained a renewed attention as a way to store off-peak electricity produced by renewable resources such as wind or photovoltaic. Portugal has a pump-storage installed capacity of 2.44 GW [65].
Table 1.9 lists hydropower generation per type of plant and river basin in the year of 2015. Up to the author’s knowledge, the values of power production through pumped-storage plants per river basin are not publicly available, but a global production of 1.16 TWh in 2015 was reported by Redes Energéticas Nacionais (REN) [65].
Table 1.9 – Hydropower generation (GWh) by type of plant and river basin in 2015 [51].
River basin Storage Run-of-River Total %
Lima 484 5 489 5.0 Cávado 1180 29 1209 12.3 Douro 366 5422 5788 59.1 Mondego 322 88 410 4.2 Tejo 415 320 735 7.5 Guadiana 812 0 812 8.3 Others 0 355 355 3.6 Total 3581 6219 9800 100
Hydropower production in 2015 was affected by the hydrological conditions and the amount of generated power was considerably lower than typical values found, representing only 60 % of the power produced in 2014. Still, Table 1.9 highlights the importance to the global hydropower production of storage and run-of-river plants located in Cávado and Douro river basins, respectively. Fig. 1.20 and Fig. 1.21 shows the biggest plants in Cávado and Douro River, respectively.
Fig. 1.20 – Photograph of Caniçada plant (storage) in Cávado river (63 MW) [63].
Fig. 1.21 – Photograph of Miranda plant (run-of-river) in Douro river (369 MW) [63].
1.2.3.5 Wind
Portugal had 255 wind parks with 2604 turbines in operation in 2015, corresponding to a total installed capacity of 5034 MW [51]. Fig. 1.22 shows how the installed capacity, wind power production and annual equivalent hours at full capacity (HFC) were distributed countrywide in 2015.
Fig. 1.22 – Wind power installed capacity, generation and annual equivalent hours at full
capacity (HFC) for year 2015 (adapted from [51]).
The HFC is determined dividing the generated output (MWh) by the installed capacity (MW), providing a way to compare the performance of wind turbines at different locations.
Fig. 1.22 highlights that wind power production is massively obtained in the Center region, followed by the North, together representing 87% of the global production [51]. Globally, wind power was generated in 2305 equivalent hours
at full capacity, being the North, Azores and Madeira the only regions with an HFC lower than the global.
The performance of wind turbines can also be expressed in terms of a capacity factor, where the number of equivalent hours at full load is normalized by the number of hours available in a certain period, allowing to assess the amount of power that was produced to the maximum possible. Table 1.10 lists the capacity factor of each region for an ideal availability of 8760 hours (i.e. hours available in one year and without excluding shutdown periods, for instance, for maintenance).
Table 1.10 – Annual wind power capacity factor obtained in different regions of Portugal in 2015 (author calculations based on data taken from [51]).
Region Capacity factor
Center 0.44 Algarve 0.30 Alentejo 0.30 Lisbon 0.29 North 0.26 Azores 0.25 Madeira 0.19
The annual capacity factor ranged from 0.19 (Madeira) up to 0.44 (Center), while the remaining regions had a value between 0.25 and 0.30. However, it is noteworthy to mention that the capacity factor can be considerably different depending on the time frame considered (year, month, etc.). Silva et al. [66] used historic wind power generation time series (up to 5 years) and reported that the capacity factor in Portugal can be 1.5 times higher in winter than in summer. The analysis on a hourly basis also showed that wind generation is higher during base-load and off-peak periods. Unfortunately, the amount of wind power that was lost during these periods was not reported.
1.2.4 Prospects for Power-to-Methane
1.2.4.1 Surplus renewable power
The IEA recently reported that instantaneous and daily renewable electricity output in Portugal regularly exceeds national demand and that the surpluses are either used in pumped-storage plants or exported [50].
Table 1.11 lists the amount of power that was consumed and produced in the country through pumped-storage in the period between 2010 and 2015.
Table 1.11 – Pumped-storage power consumption and production (GWh) (author calculations based on data taken from [54]).
Pumped-storage
power (GWh) 2010 2011 2012 2013 2014 2015
Consumed 512 737 1331 1459 1081 1460
Produced 399 575 1038 1138 843 1139
Table 1.11 shows that the amount of surplus power that was consumed in pumped-storage plants increased 2.85 times in 2015 compared to the 2010 value; the storage round-trip efficiency is 78 %. However, it should be recalled that pumped-storage plants represent huge capital investments and have associated several environmental impacts that constitute important barriers towards their adoption [67]. Besides, the storage capacity declines in periods of high rainfall and that may compromise the ability to store all the exceeding power being generated.
Another option is to export the surpluses to Spain. However, it has been reported that when feed-in tariff supported technologies (like wind) generate moments with high exports, Portugal provides cheap electricity to Spain, but covers its high production costs internally, resulting in net costs to the Portuguese Electricity System [68]. The feed-in tariff, a mechanism used by countries to foster the diffusion of renewables, is always paid to power producers independently of the power generated being used in Portugal or outside. Moreover, the tariff was guaranteed to power producers for a 20-year period, the longest reported among several European countries [68]. Therefore, it was
![Fig. 1.7 – CO 2 adsorbent materials options as a function of the temperature [24].](https://thumb-eu.123doks.com/thumbv2/123dok_br/15190739.1016851/30.748.184.564.393.717/fig-adsorbent-materials-options-function-temperature.webp)
![Fig. 1.14 – Evolution of oil products final energy consumption in Portugal by activity sectors from 2010 to 2015 (data taken from [54])](https://thumb-eu.123doks.com/thumbv2/123dok_br/15190739.1016851/40.748.185.558.468.747/evolution-products-final-energy-consumption-portugal-activity-sectors.webp)
![Fig. 1.15 – Coal use for final energy consumption by industry sub-sectors from 2010 to 2015 [54]](https://thumb-eu.123doks.com/thumbv2/123dok_br/15190739.1016851/41.748.173.580.523.799/fig-coal-use-final-energy-consumption-industry-sectors.webp)
![Fig. 1.16 - Natural gas for final energy consumption in Portugal by activity sectors from 2010 to 2015 (data taken from [54])](https://thumb-eu.123doks.com/thumbv2/123dok_br/15190739.1016851/43.748.190.554.153.434/natural-final-energy-consumption-portugal-activity-sectors-taken.webp)
![Fig. 1.22 – Wind power installed capacity, generation and annual equivalent hours at full capacity (HFC) for year 2015 (adapted from [51])](https://thumb-eu.123doks.com/thumbv2/123dok_br/15190739.1016851/52.748.172.617.122.736/wind-installed-capacity-generation-annual-equivalent-capacity-adapted.webp)
![Fig. 1.23 – CO 2 emissions evolution resulting from energy production and industrial processes and product use (adapted from [69])](https://thumb-eu.123doks.com/thumbv2/123dok_br/15190739.1016851/56.748.185.550.152.434/emissions-evolution-resulting-production-industrial-processes-product-adapted.webp)
![Fig. 1.27 – Two aerial views of the LNG reception, storage and regasification facilities at Sines terminal [70]](https://thumb-eu.123doks.com/thumbv2/123dok_br/15190739.1016851/61.748.102.651.461.685/aerial-views-reception-storage-regasification-facilities-sines-terminal.webp)