PRODUCTION & MANUFACTURING | RESEARCH ARTICLE
Applying design of experiments to a compression
refrigeration cycle
Nuno Ricardo Costa1,2* and João Garcia1
Abstract: Refrigeration cycles are used in a large diversity of industrial and
domestic (residential and non-residential) equipment and their efficiency depend
on several variables. To better understanding of how controllable variables impact
on a compression refrigeration cycle efficiency, statistically designed experiments
were conducted and data were analyzed. A quadratic polynomial model was fitted
to Coefficient of Performance and variable settings to maximize cycle efficiency
identified. Results give confidence to use the illustrated approach for refrigeration
cycle design and operation improvement purposes.
Subjects: Heat Transfer; Thermodynamics; Heating Ventilation & Air Conditioning; Energy & Fuels; Engineering Productivity; Technology
Keywords: condensing pressure; COP; evaporating pressure; multiresponse; modeling; thermodynamic
1. Introduction
Without proper characterization of process and product, a considerable amount of guesswork about which input variables (control factors) have a significant effect on the quality characteristics (dependent variable or response) of interest will typically occur. Changing a single control factor *Corresponding author: Nuno Ricardo
Costa, Escola Superior de Tecnologia de Setúbal, Campus do IPS, Estefanilha, 2910-761 Setúbal, Portugal; Faculdade de Ciências e Tecnologia, UNIDEMI/ DEMI, Universidade Nova de Lisboa, 2829-516 Caparica, Portugal E-mail: [email protected] Reviewing editor:
Zude Zhou, Wuhan University of Technology, China
Additional information is available at the end of the article
ABOUT THE AUTHORS
Nuno Costa holds a PhD in Industrial Engineering (FCTUNL, Portugal) and is a professor at Instituto Politécnico de Setúbal, ESTSetubal. He is researcher at UNIDEMI (http://unidemi.com) and holds four international awards. His works have been presented in international events and published in top journals. He has also published book chapters and acted as reviewer for several journals, and has experience in the implementation of ISO 9001 Systems. His research interests include Response Surface Methodology; Lean Six Sigma; Statistical Quality Control; and Quality and Operations Management.
João Garcia is a professor at the Mechanical Engineering Department of Escola Superior de Tecnologia de Setúbal since November 1996. He is recognized by Portuguese Engineers Council as expert in Refrigeration and has acted as expert for ADENE in air quality certification systems. He worked for 10 years as a refrigeration and HVAC systems designer and consultant, and has collaborated in various international R&D projects.
PUBLIC INTEREST STATEMENT
Refrigeration cycles are used in a large diversity of industrial and domestic (residential and non-residential) equipment and their efficiency depend on several variables. To better understanding of how controllable variables impact on a compression refrigeration cycle efficiency, statistically designed experiments were conducted and data were analyzed. A quadratic polynomial model was fitted to Coefficient of Performance and variable settings to maximize cycle efficiency identified. Results give confidence to use the illustrated approach for refrigeration cycle design and operation improvement purposes.
Received: 02 September 2014 Accepted: 22 November 2014 Published: 08 January 2015
while keeping the others fixed is an often-used practice, though it is strongly discouraged. The one-factor-at-a-time approach offers advantages only in exceptional conditions (Frey & Wang, 2006) so it is recommended to use an approach supported by statistical and mathematical techniques that has provided unequivocally evidence of its usefulness.
Experimental design and data analysis is an effective and commonly used approach in scientific investigations and technological applications in a wide variety of science fields, including in mechanical, chemical, and biotechnological engineering. Applications in product design and devel-opment comprise aircraft engines (Tappeta, Nagendra, & Renaud, 1999), bike-frames (Jeang, Liang, & Chung, 2008), copolymers (Ilbay & Çelik, 2009), electric motors (Gijo & Scaria, 2012), desonide creams (Lopes, Sarraguça, Prior, & Lopes, 2012), medical devices, and technological processes (Dixon, Eatock, Meenan, & Morgan, 2006; Steinberg & Bursztyn, 2010; Vlachogiannis, 2003), to cite only a few. In thermodynamic cycles, especially in refrigeration cycles, applications were not found, so this approach is illustrated here to investigate the called one stage refrigeration compression cycle (hereafter denoted as RC). This cycle has been used in a large diversity of domestic and indus-trial (residential and non-residential) equipment and explored from a thermodynamic point of view (Anand, Gupta, & Tyagi, 2013; Koelet, 1992; Rasmussen, 2012; Rasmussen & Shenoy, 2012; Tassou, Lewis, Ge, Hadawey, & Chaer, 2010), namely due to the recent refrigeration fluid restrictions related with environment protection as well as to the necessity of improvements in energy efficiency and energy savings (Bansal, Vineyard, & Abdelaziz, 2012; Palm, 2008). The objective here was to better understanding of how the temperature and the water mass flow rate in both evaporator and con-denser impacts on RC and maximizing the cycle efficiency, because high-efficiency cycles are char-acterized by lower energy consumption and better refrigeration effects.
The remainder of the manuscript is organized as follows: Section 2 presents the experimental installation, refrigeration cycle principle, and Coefficient of Performance metric; experimental design, data analysis, and results are made in Sections 3 and 4, respectively; and conclusions are presented in Section 5.
2. RC—Experimental installation
The one stage RC (code: R632/25019) used in this study is a didactic unit produced by P.A. Hilton Ltd (see Figure 1). It includes a hermetic compressor (Aspera NEK6214Z), a condenser constructed from a thick-walled glass cylinder with machined brass end plates and a coil of copper tube inside (through which heating water flows), an evaporator constructed from a thick-walled glass cylinder with machined brass end plates and a coil of copper tube inside (through which cooling water flows), and an expansion valve (a float operated needle valve situated in the bottom of the con-denser). The refrigeration fluid is R141b and integrated instrumentation enables to measure the condenser and evaporator pressures as well as temperatures in addition to water temperatures and flow rates.
Figure 1. Refrigeration cycle.
Electric energy analyser
The description of the RC can be summarized as follows:
The hermetic compressor maintains a low pressure in the evaporator and this causes the refrigerant to evaporate at a low temperature, extracting (sensible) heat from the water and reducing water’s temperature. The low-pressure vapor formed in the evaporator is drawn into the compressor where its pressure is increased. The high-pressure fluid is then condensed and heat is transferred to the water that flows in the condenser. The high-pressure fluid collects in the bottom of the condenser and its level is controlled by a float operated expansion valve, which reaches an equilibrium position and the fluid discharged to the evaporator at the same rate as it is formed. When the warm fluid at high-pressure passes through the valve its pressure decreases to evaporator pressure and its temperature falls to the saturation temperature. On entering the evaporator, the low-pressure fluid and vapor separate themselves. The fluid is reevaporated, while the vapor mixes with the other vapor and passes to the compressor.
Two auxiliary apparatus were built for heating and cooling water in order to set the temperature in the inlet and outlet of both the evaporator and condenser at planned values. Hot water was produced in a gas burner, stored in a thermo-accumulator tank (SOLCAP-200 litres) to stabilize the temperature at specified values, and then pumped to the condenser (see Figure 2). Cold water was obtained by introducing ice water in a tank where current water was stored, and then pumped to the evaporator at desired temperature (see Figure 3).
Figure 2. Heating water system.
Thermo accumulator tank
Figure 3. Cooling water system.
Cold water tank
Water pump
2.1. Refrigeration cycle: Coefficient of Performance
Refrigeration cycles are used in a wide variety of fields, for example, in food and pharmaceutical industries for product refrigeration and conservation, in health services to keep some medicines at low temperature, and in domestic and public rooms as air conditioner systems. To assess RC efficiency is required to know the refrigeration and electric powers. Electric power is the rate of energy consumption per time supplied to the compressor, which was measured with an analyzer Chauvin Arnoux (Qualistar plus CA 8335 - see Figure 1). Refrigeration power is a measure of the heat-extraction capacity of refrigeration equipments and is calculated by applying the first law of thermodynamics to open stationary systems, which states that the total energy of the system remains constant. Thus, in RC and under the assumption that heat losses in evaporator are negligible and the process is stationary, the energy received by refrigeration fluid from the water in the evaporator is equal to the energy transferred (released) by water to the refrigeration fluid.
Considering the schematic representation of inputs and outputs (energy and mass balance) in the evaporator (region delimited by the dash line) shown in Figure 4, refrigeration power
( ̇
Q
evap)
can bedefined as
Notation and variable units are as follows:
̇Q
evap—Refrigeration power (W);m
̇
water—Water mass flow rate in evaporator (kg/s); Cpwater—Specific heat of water at constant pressure (4.18 kJ/kgK); Tevap—Inlet water temperature in the evap-orator (°C); Toutevap—Outlet water temperature in the evaporator (°C).
The ratio between the Refrigeration
( ̇
Q
evap)
and Electric( ̇
W
elect)
powers is a metric used currentlyto assess the refrigeration cycles efficiency (Dabas, Dodeja, Kumar, & Kasana, 2011; Dincer, 2004; Mackensen, Klein, & Reindl, 2002; Pfister, 2004). This metric is called Coefficient of Performance (COP) and is defined as
The higher the COP value is, the better cycle efficiency will be, which can be achieved by reducing energy consumption and increasing the refrigeration power (Dincer, 2004). COP values of com-pression refrigeration cycles used in domestic and industrial refrigeration vary from 1 up to 3 (Bjork, 2012). For small didactic cycles like this one used in the study reported here, the expected COP value will be equal to or slightly higher than 1. These units have demonstration and didactic purposes so its components do not have the best technical characteristics. For instance, the evaporator and condenser are made in glass, with very low heat transmission capacity, and the power of the compressor is not as high as that of compressors used in industrial or domestic equipment. As a result, refrigeration power and cycle performance values are not as high as desired.
(1)
̇Q
evap= ̇
m
waterCp
water(
Tout
evap−
T
evap)
(2)
COP =
̇Q
evaṗ
W
electFigure 4. Evaporator: control volume.
3. Design of experiments
Design and conduct experiments are not trivial tasks, though various authors have presented guidelines to help researchers and practitioners in planning, conducting, and analyzing data of experimental studies (Bisgaard, 1999; Coleman & Montgomery, 1993; Costa, Pires, & Ribeiro, 2006; Freeman, Ryan, Kensler, Dickinson, & Vining, 2013; Simpson, Listak, & Hutto, 2013; Tanco, Costa, & Viles, 2009). A careful management of statistical and non-statistical issues is crucial to successful case studies. For instance, experimental design selection is a critical activity, because using an inappropriate experimental design is sure to compromise study conclusions. To avoid spending time and effort running inappropriate experiments, Tanco et al. (2009) focused on experimental design selection, highlighting various key points and providing guidelines to help practitioners in selecting experimental designs that were validated based on examples from the literature.
To explore the relationship between dependent variable (COP) and four independent variables (or control factors) of the didactic unit that impact on RC efficiency, namely the inlet water temperature in condenser (Tcond), inlet water temperature in evaporator (Tevap), water mass flow in the evaporator
( ̇
m
evap)
, and water mass flow in condenser( ̇
m
cond)
, a face-centered design (FCD)was selected. This experimental design consists of a two-level full factorial design (24 = 16
experi-ments), eight star points and four center points, which allow to estimate linear and non-linear terms that can be used for modeling the COP variable (response). The four center points are enough to produce the required design variance stability because the region delimited by factors range repre-sents both the region of interest and the region of operability. Supported on authors’ expertise, preliminary experimental results (trial runs), and to simulate as much as possible real-life operating conditions of RC, factor levels (in coded and non-coded values) were set as displayed in Table 1. Experimental design (Matrix of experiments) is displayed in Table 2. Further information about FCD and other designs can be found in classical books about Design of Experiments or Response Surface Methodology (Box, Hunter, & Hunter, 2005; Khuri & Mukhopadhyay, 2010; Myers, Montgomery, & Anderson-Cook, 2009).
4. Data analysis and results
The designed experiments were run in the thermodynamic laboratory of Setubal Polytechnic Institute— ESTSetubal, without any order (randomly), and the response results are displayed in Table 2. This data were analyzed using the software package STATISTICA® and a second-order model fitted to COP based
on analysis of variance (ANOVA) results. The estimated regression coefficients are displayed in Table 3, and the model fitted to COP, after sent to the ANOVA error term some non-significant variables/ interactions, is as follows:
where
x
i(−1 ≤ x
i≤
1 for i = 1, … ,4)
denotes the coded label of the ith independent variable.This model shows good descriptive ability (R2 = 0.934; Adjusted R2 = 0.915; MS Residual = 0.005),
and graphical residual analysis presented in Figures 5–7 does not provide evidences of ANOVA assumptions (residuals Normality, Independence, and Homoscedasticity) violation. It includes statistically significant linear and quadratic terms, namely an interaction term, and one can see that x3 (Tevap) is the most important one to maximize COP, and has the biggest coefficient has the biggest coefficient (0.2539). In practice, the greater Tevap value is, the higher cycle efficiency (COP value) will
̂
𝜇 =
0.8767 + 0.2539 x
3+
0.0791 x
4+0.0745 x
2 1+0.0776 x
2 2−0.1675 x
2 3−0.0305 x
1x
4Table 1. Variable settings
Level Coded value Tcond (°C) ̇mcond (g/s) Tevap (°C) ̇mevap (g/s)
Figure 5. Normal probability plot. -2.5 -2.0 -1.5 -1.0 -0.5 0.0 0.5 1.0 1.5 2.0 2.5 3.0
Expected Normal Valu
e .01 .05 .15 .35 .55 .75 .95 .99
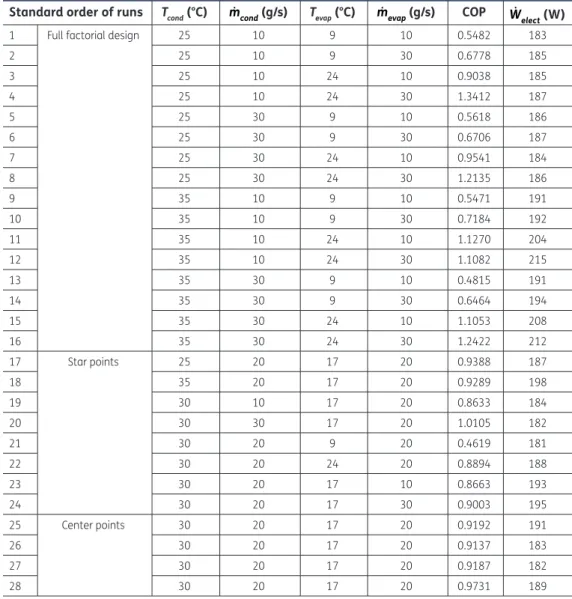
Table 2. Matrix of experiments and results
Standard order of runs Tcond (°C) ̇mcond (g/s) Tevap (°C) ̇mevap (g/s) COP Ẇelect (W)
1 Full factorial design 25 10 9 10 0.5482 183
2 25 10 9 30 0.6778 185 3 25 10 24 10 0.9038 185 4 25 10 24 30 1.3412 187 5 25 30 9 10 0.5618 186 6 25 30 9 30 0.6706 187 7 25 30 24 10 0.9541 184 8 25 30 24 30 1.2135 186 9 35 10 9 10 0.5471 191 10 35 10 9 30 0.7184 192 11 35 10 24 10 1.1270 204 12 35 10 24 30 1.1082 215 13 35 30 9 10 0.4815 191 14 35 30 9 30 0.6464 194 15 35 30 24 10 1.1053 208 16 35 30 24 30 1.2422 212 17 Star points 25 20 17 20 0.9388 187 18 35 20 17 20 0.9289 198 19 30 10 17 20 0.8633 184 20 30 30 17 20 1.0105 182 21 30 20 9 20 0.4619 181 22 30 20 24 20 0.8894 188 23 30 20 17 10 0.8663 193 24 30 20 17 30 0.9003 195 25 Center points 30 20 17 20 0.9192 191 26 30 20 17 20 0.9137 183 27 30 20 17 20 0.9187 182 28 30 20 17 20 0.9731 189
Downloaded by [81.84.241.97] at 03:04 05 March 2015
be, though the quadratic effect of Tevap
(
x
23
)
has a negative influence on COP value since its coefficient is lower than zero. The interaction term x1x4 (Tcond ×m
̇
evap) is significant, but its coefficient is smaller, in absolute value, than all the other coefficients of the model fitted to COP. These experimental results are in accordance with the theoretical knowledge, since it is known that evaporator temperature has significant impact on COP (Kilicarslan & Mülle, 2004).To achieve the highest COP value and respective optimal coded values xi, Solver optimization tool available in Excel® was used. The achieved COP value, slightly higher than 1 (COP = 1.23) for x
i = (−1, 1, 0.76, 1), is not surprising, taking into account the installation used here (Bjork, 2012). The performance of current refrigeration systems is, in fact, higher since they integrate components of higher quality (with better technical characteristics). The achieved COP value is low from a theoretical point of view. However, this does not mean that experimental methodology and study results are of no interest or unhelpful. One can’t ignore that small didactic units are not designed or developed with efficiency purposes. They are a valuable teaching aid for students, from craft and technician
Figure 6. Residuals vs. predicted values. 0.4 0.5 0.6 0.7 0.8 0.9 1.0 1.1 1.2 1.3 Predicted Values -0.3 -0.2 -0.1 0.0 0.1 0.2 Raw Residuals
Figure 7. Residuals vs. run order. -5 0 5 10 15 20 25 30 35 Case Number -0.3 -0.2 -0.1 0.0 0.1 0.2 Raw Residuals
Downloaded by [81.84.241.97] at 03:04 05 March 2015
To validate the COP value obtained from the optimization process (COP = 1.23), two confirmatory experiments with variable settings at optimal values were run. Experimental runs and results are displayed in Table 4, and one can see that COP values are in agreement with those achieved from the optimization of model fitted to COP. Thus, one can argue that experimental methodology illustrated here was helpful to better understand the influence of selected control factors on refrigeration cycle performance.
5. Conclusions
Statistically designed experiments were performed and results analyzed with the objective of maximizing the efficiency of a compression refrigeration cycle, using a small didactic installation. A second-order model was fitted to Coefficient of Performance and considerable benefits result from it. Besides it expresses the functional relationship between design variables and the response, the model provides an estimate of the response at any point within the experimental region, which is useful for refrigeration cycle design and operation improvement purposes. Results show that, except for the inlet water temperature in the condenser, which must be set at low level, the remaining variables must be set at high level or close of it to maximize the cycle performance. Confirmatory experiments corroborated these results.
The design and analysis of experiments to investigate refrigeration cycles is a novel approach in thermodynamics and results give confidence to use this approach for refrigeration cycle design and operation improvement purposes. Therefore, as future research, we plan to apply this methodology in domestic and industrial equipment as well as in other thermodynamic cycles. Simultaneous
opti-Table 4. Confirmatory experiments
Tcond (°C) ̇mcond (g/s) Tevap (°C) ̇mevap (g/s) COP Ẇelect (W)
25 30 22.5 30 1.13 188
25 30 22.5 30 1.10 183
Table 3. Estimated regression coefficients
Term Coeff. Std. Error t(13) p
Mean/Interc. 0.8751 0.0285 30.696 0.000 x1 Tcond 0.0052 0.0194 0.267 0.794 (x2 1) Tcond × Tcond 0.0691 0.0512 1.350 0.200 x2 ṁWcond 0.0028 0.0194 0.142 0.889 (x2 2) ṁcond × ṁcond 0.0722 0.0512 1.409 0.182 x3 Tevap 0.2539 0.0194 13.097 0.000 (x2 3) Tevap × Tevap −0.1729 0.0515 −3.360 0.005 x4 ṁevap 0.0790 0.0194 4.073 0.001 x2 4 ṁevap × ṁevap 0.0186 0.0512 0.363 0.722 x1x2 Tcond × ṁcond 0.0028 0.0206 0.138 0.892 x1x3 Tcond × Tevap 0.0146 0.0206 0.710 0.490 x1x4 Tcond × ṁevap −0.0301 0.0206 −1.461 0.168 x2x3 ṁcond × Tevap 0.0110 0.0206 0.534 0.602 x2x4 ṁcond × ṁevap −0.0031 0.0206 −0.151 0.883 x3x4 Tevap × ṁevap 0.0145 0.0206 0.705 0.493
Notes: R2 = 0.941; Adj R2 = 0.877; MS Residual = 0.007.
Acknowledgments
The authors thank to IPS-ESTSetubal for allowing us to use the didactic refrigeration cycle and all the other necessary instrumentation as well as to the Mr Vitor Pinho for his relevant contribution in the experimental part of this study. We are also grateful to the two reviewers for their contribution to the improvement of this manuscript. Funding
The authors received no direct funding for this research. Author details
Nuno Ricardo Costa1,2
E-mail: [email protected]
ORCID ID: http://orcid.org/0000-0001-6039-8143 João Garcia1
E-mail: [email protected]
1 Escola Superior de Tecnologia de Setúbal, Campus do IPS,
Estefanilha, 2910-761 Setúbal, Portugal.
2 Faculdade de Ciências e Tecnologia, UNIDEMI/DEMI,
Universidade Nova de Lisboa, 2829-516 Caparica, Portugal. Citation information
Cite this article as: Applying design of experiments to a compression refrigeration cycle, N. Ricardo Costa & J. Garcia, Cogent Engineering (2015), 2: 992216. References
Anand, S., Gupta, A., & Tyagi, S. (2013). Simulation studies of refrigeration cycles: A review. Renewable and Sustainable Energy Reviews, 17, 260–277. http://dx.doi.org/10.1016/j. rser.2012.09.021
Bansal, P., Vineyard, E., & Abdelaziz, O. (2012). Status of not-in-kind refrigeration technologies for household space conditioning, water heating and food refrigeration. International Journal of Sustainable Built Environment, 1, 85–101. http://dx.doi.org/10.1016/j.ijsbe.2012.07.003 Bisgaard, S. (1999). Quality quandaries. Quality Engineering, 11,
645–649. http://dx.doi.org/10.1080/08982119908919285 Bjork, E. 2012. Energy efficiency improvements in household
refrigeration cooling systems (PhD thesis). Royal Institute of Technology, UK.
Box, G., Hunter, J., & Hunter, W. (2005). Statistics for
experimenters: Design, innovation, and discovery (2nd ed.). Hoboken, NJ: John Wiley & Sons.
Coleman, D., & Montgomery, D. (1993). A systematic approach to planning for a designed industrial experiment. Technometrics, 35, 1–12.
http://dx.doi.org/10.1080/00401706.1993.10484984 Costa, N., Pires, A., & Ribeiro, C. (2006). Guidelines
to help practitioners of design of experiments. The TQM Magazine, 18, 386–399. http://dx.doi. org/10.1108/09544780610671057
Dabas, J., Dodeja, A., Kumar, S., & Kasana, S. (2011). Performance characteristics of vapour compression refrigeration system under real transient conditions. International Journal of Advancements in Technology, 2, 584–593.
Dincer, I. (2004). Refrigeration systems and application. London: John Wiley & Sons Ltd.
Dixon, D., Eatock, D., Meenan, B., & Morgan, M. (2006). Application of Design of Experiment (DOE) Techniques to Process Validation in Medical Device Manufacture. Journal of Validation Technology, 12, 92–100.
Freeman, L., Ryan, A., Kensler, J., Dickinson, R., & Vining, G. (2013). A tutorial on the planning of experiments. Quality
Technometrics, 48, 418–431.
http://dx.doi.org/10.1198/004017006000000075 Gijo, E., & Scaria, J. (2012). Product design by application
of Taguchi’s robust engineering using computer simulation. International Journal of Computer Integrated Manufacturing, 25, 761–773. http://dx.doi.org/10.1080/09 51192X.2012.665186
Ilbay, I., & Çelik, N. (2009). A statistical and experimental investigation on product design for copolymer based multichannel polyester draw textured yarns. Journal of Textile and Apparel, 19, 291–298.
Jeang, A., Liang, F., & Chung, C. (2008). Robust product development for multiple quality characteristics using computer experiments and an optimization technique. International Journal of Production Research, 46, 3415–3439. http://dx.doi. org/10.1080/00207540601139963
Khuri, A., & Mukhopadhyay, S. (2010). Response surface methodology. Wiley Interdisciplinary Reviews: Computational Statistics, 2, 128–149. http://dx.doi. org/10.1002/wics.v2:2
Kilicarslan, A., Mülle, N. (2004, July 14–16). COPs of R718 in comparison with other modern refrigerants. In First Cappadocia International Mechanical Engineering Symposium, Cappadocia, Turkey.
Koelet, P. (1992). Industrial refrigeration—Principles, design and applications. London: MacMillan Press.
Lopes, S., Sarraguça, J., Prior, J., & Lopes, J. (2012). Development of an HPLC assay methodology for a desonide cream with chemometrics assisted optimization. Analytical Letters, 45, 1390–1400. http://dx.doi.org/10.1080/00032719.201 2.675494
Mackensen, A., Klein, S., Reindl, D. (2002). Characterization of refrigeration system compressor performance. In International Refrigeration and Air Conditioning Conference, Paper 567. Retrieved from http://docs.lib. purdue.edu/iracc/567
Myers, R., Montgomery, D., & Anderson-Cook, C. (2009). Response surface methodology: Process and product optimization using designed experiments (3rd ed.). Hoboken, NJ: John Wiley & Sons.
Palm, B. (2008). Hydrocarbons as refrigerants in small heat pump and refrigeration systems—A review. International Journal of Refrigeration, 31, 552–563. http://dx.doi. org/10.1016/j.ijrefrig.2007.11.016
Pfister, S. (2004). Transient modeling of vapor compression refrigeration systems using measured compressor COP. In International Refrigeration and Air Conditioning Conference, Paper 653. Retrieved from http://docs.lib. purdue.edu/iracc/653.
Rasmussen, B. (2012). Dynamic modeling for vapor compression systems—Part I: Literature review. HVAC&R Research, 18, 934–955.
Rasmussen, B., & Shenoy, B. (2012). Dynamic modeling for vapor compression systems—Part II: Simulation tutorial. HVAC&R Research, 18, 956–973.
Simpson, J., Listak, C., & Hutto, G. (2013). Guidelines for planning and evidence for assessing a well-designed experiment. Quality Engineering, 25, 333–355. http://dx.doi.org/10.1080/08982112.2013.803574 Steinberg, D., & Bursztyn, D. (2010). Response surface
methodology in biotechnology. Quality Engineering, 22, 78–87. http://dx.doi.org/10.1080/08982110903510388 Tanco, M., Viles, E., Ilzarbe, L., & Alvarez, M. (2009).
Implementation of design of experiments projects in industry. Applied Stochastic Models & Data Analysis, 25, 478–505.
© 2015 The Author(s). This open access article is distributed under a Creative Commons Attribution (CC-BY) 3.0 license. You are free to:
Share — copy and redistribute the material in any medium or format
Adapt — remix, transform, and build upon the material for any purpose, even commercially. The licensor cannot revoke these freedoms as long as you follow the license terms. Under the following terms:
Attribution — You must give appropriate credit, provide a link to the license, and indicate if changes were made. You may do so in any reasonable manner, but not in any way that suggests the licensor endorses you or your use. No additional restrictions
You may not apply legal terms or technological measures that legally restrict others from doing anything the license permits. Cogent Engineering (ISSN: 2331-1916) is published by Cogent OA, part of Taylor & Francis Group.
Publishing with Cogent OA ensures:
• Immediate, universal access to your article on publication
• High visibility and discoverability via the Cogent OA website as well as Taylor & Francis Online • Download and citation statistics for your article
• Rapid online publication
• Input from, and dialog with, expert editors and editorial boards • Retention of full copyright of your article
• Guaranteed legacy preservation of your article
• Discounts and waivers for authors in developing regions
Submit your manuscript to a Cogent OA journal at www.CogentOA.com Tappeta, R., Nagendra, S., & Renaud, J. (1999).
A multidisciplinary design optimization approach for high temperature aircraft engine components. Structural Optimization, 18, 134–145.
http://dx.doi.org/10.1007/BF01195988 Tassou, S., Lewis, J., Ge, Y., Hadawey, A., & Chaer, I.
(2010). A review of emerging technologies for food refrigeration applications. Applied Thermal
Engineering, 30, 263–276. http://dx.doi.org/10.1016/j. applthermaleng.2009.09.001
Vlachogiannis, J. (2003). Taguchi's technique: An effective method for improving X-ray medical radiographic screen performance. Proceedings of the Institution of Mechanical Engineers, Part H: Journal of Engineering in Medicine, 217, 375–384. http://dx.doi. org/10.1243/095441103770802540


![Figure 7. Residuals vs. run order. -5 0 5 10 15 20 25 30 35 Case Number-0.3-0.2-0.10.00.10.2Raw ResidualsDownloaded by [81.84.241.97] at 03:04 05 March 2015](https://thumb-eu.123doks.com/thumbv2/123dok_br/15001068.1009898/7.914.265.664.144.777/figure-residuals-order-case-number-raw-residualsdownloaded-march.webp)

