Proceedings
In association with:
Photo by: Tivolihotels
PORTUGUESE
FINANCE NETWORK
Edited by:
Luís Coelho and Rúben Peixinho
© 2014 8th Portuguese Finance Network Conference
and the respective authors of each chapter.
Proceedings of the
8
thPortuguese Finance Network Conference
9 789789 892044
Organizing Committee Welcome
Past PFN conferences Keynote speaker
School of Economics - University of the Algarve Venue
Scientific Committee PFN best paper awards Conference program
Conference papers showcase
Table of Contents
Portuguese Finance Network
5 8 11 6 9 15 7 10 16 17
ORGANIZING COMMITTEE
School of Economics - University of the Algarve Campus de Gambelas, Edifício 9
8005-139 Faro Portugal
Program Co-Chairs of the PFN 2014 Conference:
Luís Miguel Serra Coelho Rúben Miguel Torcato Peixinho
A Comparative Analysis
of Ex Ante Credit
Spreads: Structured
Finance versus Straight
Debt Finance
...
...
João M. Pinto
School of Economics and Management
Catholic University of Portugal – Porto
Email: [email protected] Address: Rua Diogo Botelho, 1327 4169-005 PORTO
PORTUGAL
Telephone: (00351) 226 196 260 | (00351) 935 847 770
Manuel O. Marques
Faculty of Economics and Management
University of Porto
Email: [email protected] Address: Rua Dr. Roberto Frias 4200-464 PORTO
PORTUGAL
Telephone: (00351) 225 571 100
William L. Megginson
Michael F. Price College of Business
The University of Oklahoma
Email: [email protected] Address: King Fahd University of Petroleum & Minerals
Dhahran, Saudi Arabia 307 W Brooks, 205A Adams Hall Norman, OK 73019, United States
Telephone: (405) 325-2058
The authors thank Álvaro Nascimento, Brian Maia-Tanner, Gordon Roberts, Jorge Alcover, João Santos, Luís Pacheco, Mário Coutinho dos Santos, Miguel Ferreira, Paulo Alves, Pedro Duarte Silva, Ricardo Cruz, Ricardo Cunha, Stefanie Kleimeier, Stefano Gatti, and seminar participants at the 2011 FMA Doctoral Student Consortium for helpful comments on earlier drafts. We are especially grateful to Goldman Sachs for providing us with access to DCM Analytics database and to the Catholic University of Portugal, Porto for providing us with access to Dealscan database.
Structured finance (SF) – project finance (PF) loans and asset securitization (AS) bonds – and straight debt finance (SDF) – corporate bonds (CB) – transactions are priced in segmented capital markets. Credit spreads are higher for PF loans than they are for AS and CB issues. SF and SDF credit spreads are directly related to default and currency risks, while the slope of the yield curve impacts negatively the credit spreads. The loan to value ratio proves positively related to PF loans and negatively related to AS bonds, while the number of banks has a negative impact on the credit spread for AS and CB issues. PF loan credit spreads and fees are shown to be complements rather than supplements. Borrowers from the U.K. raise funds in PF and CB markets at a higher credit spread and the impact of country risk on the credit spread is positive for PF and CB issues. The 2007/2008 financial crisis have imposed a significant impact on credit spreads. The average credit spread has increased 329.1 bps for PF loans, 206.5 bps for AS bonds, and 220.3 bps for CB issues during the crisis period. Finally, a robust hump-shaped relationship between credit spread and maturity is found for PF loans while a linear positive relationship remains strongly significant for CB.
KEywords:
loan and bond pricing, structured finance, straight debt
finance, project finance, asset securitization, corporate bonds,
financial crisis, term structure of credit spreads.
A COMPARATIVE ANALYSIS OF EX ANTE CREDIT SPREADS: STRUCTURED
FINANCE VERSUS STRAIGHT DEBT FINANCE
1. Introduction
In general, debt capital markets are roughly composed of two major types of financial instruments or transactions: straight debt finance and structured finance transactions. Structured finance refers to the
design of financial products or instruments based on the use of flexible tools to meet, as closely as possible, the requirements of the originator or owner of an asset (or pool of assets) and the needs of investors. Thus, structured finance encompasses all financial arrangements helping to efficiently (re)finance a specified pool of assets beyond the scope of on-balance sheet financing products or instruments.1 According to Caselli and Gatti (2005) and Fabozzi, et al. (2006) asset securitization, project finance, structured lease and leveraged corporate acquisition activities (mostly LBOs), are all different forms of structured finance.
We can highlight two core economic benefits provided by structured finance. The first relates to the fact that structured finance enables the financing of a specific asset class when established forms of external finance are unavailable for a particular financing need. The second economic benefit is the reduction in the cost of funding.2 If the benefits of the reduced cost of funding are greater than the cost of the credit enhancement mechanisms, making use of a structured basis – a transaction that is specifically structured using an SPV and is secured by ring-fencing assets producing cash flows solely for supporting the transaction – is advantageous for sponsors.
Although the academic literature analyzing the credit spread of corporate bonds (CB) – used as a proxy for straight debt finance (SDF) transactions – is vast and growing, research on structured finance (SF) bonds and loans credit spread is scant. We rely on asset securitization (AS) bonds and project finance (PF) loans as proxies for SF transactions. Empirical studies on the price determinants of PF loans and AS bonds are very limited, but a few can still be found.
1 This definition stems from the literature, as well as from the evidence which emerges from the observation of the
practices of international and domestic intermediaries that compete in structured finance business area. Interesting studies on both theoretical and empirical literature in relation to structured finance include Caselli and Gatti (2005), Davis (2005), Fabozzi et al. (2006), Jobst (2007), Cherubini and Della Lunga (2007), Fabozzi and Kothari (2007), and Criado and Rixtel (2008).
2 Caselli and Gatti (2005), Fabozzi, et al. (2006), and Tavakoli (2008), among others, point out the reduction of
funding costs as one of the major economic motivations of structured finance transactions. The same intuition is presented by Davidson et al. (2003), Roever and Fabozzi (2003), Fabozzi, et al. (2006), Jost (2006), and Fabozzi and Kothari (2007) for asset securitization. According to Esty (2003) and Gatti (2005), the use of project finance may enable sponsors to obtain a reduction in the net cost of financing.
Kleimeier and Megginson (2000) compare the spread and the common pricing factors of PF loans with other syndicated loans and show that PF loans are significantly different from any other types of syndicated loans, with longer maturities, more frequent third-party guarantees, and lower spreads. They also conclude that a third-party guarantee significantly reduces PF loan spreads, while PF loan pricing is not a positive function of maturity and loan size. In turn, Sorge and Gadanecz (2008) compare the term structure of ex ante PF credit spreads with non-PF loans and bonds and detect that, whereas credit spreads for both investment-grade and speculative-grade bonds other than PF are a positive linear function of maturity, in PF loans the term structure of credit spreads is ‘hump-shaped’. Further evidence on pricing of PF loans is provided by Corielli, et al. (2010), who demonstrate that lenders rely upon the network of nonfinancial contracts as a mechanism to control agency costs and project risks. Blanc-Brude and Strange (2007) argue that, in a PF transaction, lenders should price any risk that is not explicitly managed through contracts. Syndication is also presented as playing a role in driving the credit spreads in PF loans. Esty and Megginson (2000, 2003) show a positive relationship between syndicate size (and concentration) and loan pricing. On the contrary, Kleimeier and Megginson (2000) and Sorge and Gadanecz (2008) report that the presence of larger syndicates reduces credit spreads. With respect to AS, Vink and Thibeault (2008) examine how common pricing factors compare for ABS, MBS and CDO. They find that not only the common pricing factors differ significantly between the main classes of issues but also that ABS, MBS and CDO are influenced differently by common pricing factors.
To our knowledge, no full-scale empirical study of SF in Western Europe has yet been published, namely studying the impact of the 2007/2008 crisis and the subsequent European sovereign debt crisis, on the credit spread of loans and bonds. Despite its use on a worldwide basis and several decades of history, a number of key issues regarding the specific risk determinants of SF, vis-a-vis SDF, remain largely unresolved. In particular, recent research has suggested that PF loans might be fundamentally different from other syndicated loans and bond issues [e.g., Kleimeier and Megginson (2000), Hainz and Kleimeier (2003), and Sorge and Gadanecz (2008)]. We believe our study is the first to investigate how credit spread and common pricing factors compare between SF and SDF transactions. A sample of loans – 2,859 PF loans – and bonds – 599 AS bonds and 20,977 CB – issued by Western European borrowers between January 1st, 2000 and December 31st, 2011 has been used in the study. PF and AS transactions typically consist of several tranches funding the same SPV. Therefore, the unit of observation is a single issue or a single loan tranche.
If SF transactions allow the reduction of funding costs when compared with traditional sources of funds, then the rates charged on SF transactions should be lower than the rates charged on SDF transactions. Due to the difference in underlying risks, the relevant pricing factors for these two types of debt instruments should also differ. This raises three questions: (1) How common pricing factors compare
between SF and SDF transactions (or tranches)? (2) Is the credit spread on SF transactions (or tranches) significantly different to the credit spread on SDF transactions (or tranches)? And (3) to what extent are SF and SDF transactions (or tranches) priced by common factors? These questions lead us to test three
hypotheses. First, we intend to argue that not only the credit spread but even the common pricing factors differ significantly between SF and SDF transactions. The third hypothesis states that the credit spreads associated with SF and SDF transactions are influenced differently by common pricing factors.
Additionally, the 2007/2008 financial crisis played a significant role in the failure of numerous businesses, due to a decline in consumer wealth, and a downturn in economic activity, contributing to the European sovereign debt crisis. This fact raises one final question: Is the credit spread on SF transactions
(or tranches) significantly affected by the 2007/2008 financial crisis? We aim thus testing a fourth
hypothesis with the purpose of studying the impact of the global financial crisis and the subsequent European sovereign debt crisis on SF credit spreads and pricing factors in Western Europe. We therefore examine whether the credit spread changes across time, by considering a pre-crisis period from January 1st, 2000 through to September 14th, 2008, and a crisis period from September 15th, 2008 through to December 31st, 2011.
The relative pricing of SF versus SDF issues is one of the most important findings presented in our univariate analysis. Average credit spreads are statistically and significantly higher for PF loans (198.3 bps) than they are for AS bonds (148.9 bps) and CB (157.6 bps). On the contrary, average credit spreads for AS and CB issues do not differ significantly. We also find that most of the common pricing characteristics differ significantly, not only between SF and SDF issues but also among SF transactions. All pair-wise comparisons indicate statistically significant differences in value, with the exception of credit spread, tranche size, and currency risk between AS and CB issues. The financial crisis does have a significant impact on SF and SDF credit spreads. The evidence strongly supports the assumption that the average credit spread is statistically and significantly higher for PF loans (329.1 bps versus 136.9 bps), AS bonds (206.5 bps versus 143.5 bps), and CB (220.3 bps versus 125.5) during the crisis period. Additionally, the 2007/2008 financial crisis and the subsequent European sovereign debt crisis have a substantial impact on the common pricing factors of loan and bond transactions. We corroborate these findings in our regression analysis, after controlling for other microeconomic and macroeconomic pricing factors.
We conclude that PF, AS, and CB issues are not priced in a single integrated market. Rejecting our third hypothesis also means that we cannot estimate the full sample of loans and bonds in a single regression. Hence, we examine the determinants of credit spreads for each type of issue using an OLS regression framework. Although some variable coefficients have the expected features, others are not in line with the theoretical and the empirical literature. For instance, although currency risk coefficients for
AS and CB issues have the expected features, our findings for PF loans are different from those presented in the empirical literature [Kleimeier and Megginson (2000)] – currency risk dummy variable has a positive impact on the credit spread.
Given the controversy in the literature regarding the term structure of credit spreads for speculative-grade issuers and even the empirical puzzle of the term structure of PF loans, we also analyze the term structure of credit spreads for SF transactions compared to SDF transactions. We identify several economic rationales that might explain why we should expect a different shape for the term structure of credit spreads for SF vis-a-vis SDF transactions. For PF loans, a robust hump-shaped relationship between credit spread and maturity is found. A linear positive relationship between credit spread and maturity remains strongly significant for CB issues while it appears insignificant for AS bonds.
This paper is organized as follows. Section 2 details the research questions and presents the methodology. It also describes the Dealscan and DCM Analytics databases used in this study. The basic characteristics for the full and high-information samples of SF versus SDF transactions are also presented here. In section 3, the financial characteristics of SF issues are compared with the sample of SDF bonds. We also study the impact of the financial crisis on credit spreads and pricing factors. Section 4 examines the extent to which SF and SDF transactions are priced by common factors. We begin by presenting the methodology and discussing the sets of micro and macro variables and their expected impact on the credit spread. Next, we present the regression analyses results. Section 5 examines the economics underlying the term structure of SF and SDF credit spreads. Section 6 concludes the study.
2. Hypotheses and Data Description
2.1. Hypotheses and Methodology
The four questions raised in the previous section help us to develop the following hypotheses with respect to SF credit spreads:3
Hypothesis 1: The pricing factors of SF credit spreads do not differ significantly in relevance from the pricing factors of SDF credit spreads.
Hypothesis 2: The credit spread on SF is lower than or equal to the credit spread on SDF.
Hypothesis 3: The impact of pricing factors on credit spread do not differ significantly between SF and SDF transactions.
Hypothesis 4: After controlling for macroeconomic conditions and loan characteristics, the 2007/2008 financial crisis does not have a significant impact on SF credit spreads.
3 We use the issuance credit spread (or the tranche spread at closing). Kleimeier and Megginson (2000),
Blanc-Brude and Strange (2007), Vink and Thibeault (2008), Sorge and Gadanecz (2008), and Gatti, et al. (2013) among others, use the same variable.
The purpose of testing the first and second hypotheses is to provide extensive insight into the common characteristics and pricing factors associated with SF and SDF financial instruments and to elaborate on any substantial differences between them. In testing Hypotheses 1 and 2 we use a parametric test (Student’s t-test) for continuous variables and a non-parametric test (Fisher's exact test) for dummy variables, to compare whether the distribution of the reported values for SF and SDF tranches are significantly different.
The third hypothesis states that various different variables determine the credit spread, and it may well happen that the impact of these variables on the credit spread is different between SF and SDF transactions. Furthermore, the degree of impact on the spread could differ from one financial instrument class to another. In testing Hypothesis 3, a structural change test is used. To implement the Chow test [Chow (1960)] we first run one ordinary least squares regression on the common pricing variables (independent variables) and the credit spread (dependent variable), under the assumption that all types of issues (PF loans, AS bonds and CB issues) have the same explanatory variables. Then, coefficients from separate regressions are obtained from each type of issue, and we run thus three regressions: one for PF loans, one for AS bonds, and one for CB. Based on the residual sum of changes of each regression, an F-test of structural change is computed (also called a Chow F-test). Finally, Hypothesis 3 will be rejected if the computed F value exceeds the critical value, and will be accepted if the F value remains smaller than its critical level. Should Hypothesis 3 be accepted, examining the coefficients will allow us to determine loan pricing factors for AS, PF, and CB issues; i.e., a regression test will be run on one sample only to determine the pricing variables. If it is the case that Hypothesis 3 is rejected, regressions on AS, PF, and CB will be run to examine the relationship between the pricing variables and the credit spread for each type of debt issue, separately, for comparison.
The purpose of answering the fourth question is to provide extensive insight into the impact of the financial crisis and the subsequent European sovereign debt crisis on SF (and SDF) credit spreads. This is of further relevance once there is a broad consensus about the important role played by SF transactions, especially asset securitization, in the development and propagation of the 2007/2008 financial crisis.4 As IMF (2008a) suggests, “… the proliferation of new complex structured finance products, markets, and
business models exposed the financial system to a funding disruption and breakdown in confidence” and
that particular products “… exacerbated the depth and duration of the crisis by adding uncertainty
relating to their valuation as the underlying fundamentals deteriorated.” Considering this, since the
second half of 2008 a flight to quality might have left many investors and intermediaries in the Western European countries credit-rationed. Hence, SF borrowers and lenders might have also changed their
4 See, among others, IMF (2008b), Benmelech and Dlugosz (2009), Brunnermeier (2009), and Demyanyk and Van
attitude towards SF in terms of pricing and compensation. We are therefore examining whether the credit spreads change over time, by considering a pre-crisis period from January 1, 2000 through to September 14, 2008, and a crisis period from September 15, 2008 (Lehman Brothers' bankruptcy filing date) through to December 31, 2011.
2.2. Data Description
Our sample consists of individual loans and bond offers extracted from DealScan and DCM Analytics databases, respectively. DCM Analytics database (formerly Bondware database) is compiled by Dealogic and offers comprehensive information of debt securities issued on the debt capital markets. DealScan database is provided by Thomson Reuters LPC, a market information provider of individual deal information on the global syndicated loan markets. Information is available on the micro characteristics of the loan and bond offers (e.g., transaction and tranche size, maturity, currency, pricing, rating, type of interest rate) and of the borrowers (e.g., name, nationality, industry sector). The reason for using two databases is that we require information about the pricing characteristics of SF and SDF transactions. In fact, while DCM Analytics provides very detailed information regarding CB (used as a proxy for SDF transactions) and AS, Dealscan has particularly rich data about PF loans. We use AS and PF transactions as proxies for SF instruments.5
These databases contain detailed historical information on virtually the entire population of bond securities (DCM Analytics) and syndicated loans (DealScan) issued in the international capital markets from January 1st, 2000 through to December 31st, 2011. Although the database extracted from DCM Analytics contains information on several types of bonds, we include only those with a deal type code of “corporate bond-investment-grade”, “corporate bond-high yield”, “asset-backed security”, and “mortgage-backed security”.6
Bond tranches classified either as fixed rate bonds, with coupon rate information, or variable rate bonds, with both spread and index information were included in the data. For variable rate bonds, only those quoted on the following indices were included: Euribor, Euro Libor, USD Libor, and GBP Libor. While Dealscan database contains historical information about syndicated loans and related banking instruments, we examine only loans with a deal specific purpose code of “project finance”. We also require, for both databases, that the Borrower/Issuer country belongs to Western
5 As pointed out in section 1, one can identify four types of SF instruments: PF, AS, structured leasing (SL), and
leveraged acquisitions (mainly LBOs). We rely on PF and AS as SF instruments because: (i) there is no public information on SL transactions; and (ii) LBOs can be implemented without an SPV to facilitate the transaction, which is a key element of SF transactions.
6 We exclude bond issues which have a deal type code of ‘Medium-Term Note’, ‘Non-Us Agency’, ‘Covered
Bonds’, and ‘Collateralized-Debt Obligation’. Perpetual bonds and bonds with additional features such as step-up, caps, or floors were also excluded from the database. Due to the important role played by CDOs in the 2007/2008 financial crisis – CDOs based on MBS linked to the subprime market were negatively affected inflicting enormous losses on investors – and as CDO issues are frequently backed by ABS and MBS, we decided to exclude CDOs from our AS dataset.
Europe and that the tranche size (in Euro millions) be available.7 After applying these screens, we are able to examine a total of 24,435 debt issues (worth Euro 6,297.8 billion).8 Our sample contains information on 599 AS issues (worth Euro 179.1 billion) – of which 430 issues (worth Euro 106.3 billion) have a deal type code of ABS and 169 issues (worth Euro 72.9 billion) have a deal type code of MBS, 20,977 CB issues (worth Euro 5,786.5 billion), and 2,859 PF issues (worth Euro 332.1 billion). We refer to this as our ‘full sample’.9
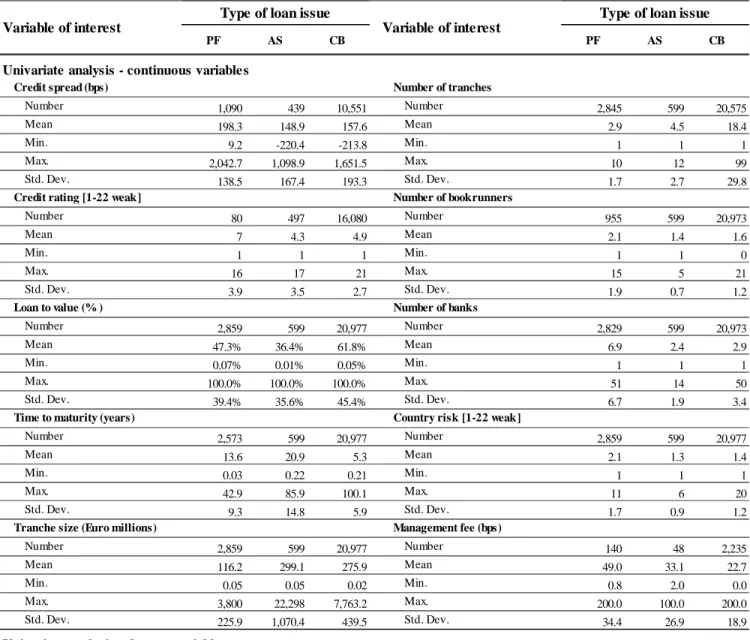
Table 1 presents basic characteristics for the full sample of PF, AS, and CB issues. Significant differences are revealed between both SF and SDF issues, as well as between the two categories of SF issues. One of the most remarkable findings is how much larger AS and CB tranches are than PF tranches. These issues have mean values of 299 Euro millions (M€) and 276 M€, respectively, compared with 116 M€ for PF issues. Thus, as regards tranche size, AS securities are similar to SDF securities. This can be explained by the fact that both transactions involve the offer of securities in the capital markets, while syndicated loans are the prominent form of funding for project finance investments.
**** Insert Table 1 about here ****
According to the average maturity (years) variable, the three types of loans are substantially different financing instruments. The average maturity of PF loans, 13.6 years, is significantly lower that of the AS bonds full sample (20.9 years), but considerably longer than that of the CB full sample (5.3 years). Additionally, compared to AS and CB samples, PF loans involve more than twice the number of banks in the transaction. Furthermore, AS and CB transactions are more likely to be exposed to currency risk when compared to the PF full sample.
The most remarkable similarity between SF instruments is how frequently PF loans and AS bonds are issued with guarantees (96.9% and 100%, respectively). This largely meets the standard characteristics of PF and AS. Contrary to the traditional CB, where it is the ability of the issuer to generate sufficient cash flows to repay the debt obligation that determines the risks of the transaction, in AS the source of repayments shift from the cash flows of the issuer to the cash flows generated by the securitized assets and/or a third party guarantor, in case of default. In a PF transaction, the financing is structured with as little recourse as possible to the sponsor, while at the same time providing sufficient
7
We consider the following countries as pertaining to Western Europe: Austria; Belgium; Cyprus; Denmark; Finland; France; Germany; Greece; Iceland; Ireland; Italy; Luxemburg; the Netherlands; Norway; Portugal; Spain; Sweden; Switzerland; and the United Kingdom.
8
We verify with Thomson Reuters that our PF sample refers to loans made to a vehicle company and with Dealogic that our AS sample refers to securities sold to investors by bankruptcy-remote special purpose vehicles (SPVs).
9 As the unit of observation is a single issue or a single loan tranche, multiple issues from the same transaction or
credit support through collaterals or third party guarantees, so that lenders will be satisfied with the credit risk.
2.3. Loans and Bonds Pricing Samples
Since we wish to determine whether SF instruments are more or less expensive for borrowers/sponsors than SDF securities, and to compare the common pricing characteristics associated with PF, AS and CB issues, we select from our full sample those issues that have complete data on credit spread. This screen has yielded a “high-information” sub-sample of 12,080 loans (worth 4,962,996 M€), of which 1,090 (worth 158,487 M€) have been classified as PF loans, AS bonds represent 439 issues (worth 140,733 M€), and 10,551 are CB issues (4,663,777 M€). Our high-information samples include issues with five (A) default and recovery risk characteristics (credit rating, loan to value, time to maturity, tranches with guarantee, and country risk); nine (B) marketability characteristics (tranche size, number of tranches, number of bookrunners, number of banks, type of interest rate, tranches to U.K. borrowers, tranches to financial institutions, and, finally, management fee); and one (C) systematic risk characteristic (tranches with currency risk).
On average, we document a relatively high survival rate from the full sample to the high-information sample (54.7% for PF loans, 75.2% for AS bonds, and 54.3% for CB). This is presented in Tables 2, 3, and 4. A comparison of the common variables in the full samples and in the high-information samples reveals that the high-information issues are not dissimilar to their counterparties in terms of credit spread (remain the same), default and recovery risk characteristics, marketability characteristics, and systematic risk characteristic. Therefore, we assume that any empirical results derived from the high-information sub-samples can be extended to the larger population of all issues. Table 1 to 4 present several variables of interest. Although most of these are self-explanatory, a few of them will require definition.
**** Insert Tables 2,3, and 4 about here ****
The credit spread corresponds to the price for the risk associated with the financing instrument, on the basis of available information, at the time of issue. For PF loans, the credit spread represents the spread paid by the borrower over 3-month Euribor or 3-month Libor.10 For bonds, the spread is defined as the margin yielded by the security at issue above a corresponding currency treasury benchmark with a comparable maturity. None of these measures are perfect proxies for the credit risk associated with loans
and bonds. In particular, the spread over Euribor or Libor does not represent the full economic cost of credit. Loans and bonds also carry fees that can be related to creditworthiness and performance.11
Considering the scarcity of secondary market prices and the absence of borrowers’ rating data, the spread over Euribor or Libor for loans and the margin yielded by the security at time of issue above a comparable risk-free government security for bonds, have become standard pricing measures in the literature. Even for AS bonds, we exclude secondary market spreads, because of the relatively poor liquidity of the secondary market for these securities. The comparability of our pricing variables across loans and bonds can be improved by making the following adjustment:12 while in PF loans the benchmark priced off Euribor or Libor is a three-month interbank rate, bonds typically carry a spread over a benchmark government security (e.g., German Treasury Bonds). Therefore, there is a difference between the two benchmarks represented by different credit risk levels involving unsecured short-term bank risk and a risk-free government rate. Following the approach of Thomas and Wang (2004) and Sorge and Gadanecz (2008), we adjust for the risk difference of the bond and loan benchmarks by adding to the Euribor or Libor spread of the PF loans the difference between the month Euro Libor and the three-month German Treasury bill at the time when the loans were granted.13
Credit rating evaluates the capacity of the borrower to repay interest and principal on time as
promised. Since we need a consistent rating classification scheme, we use the rating scales as shown in Table 5. This classification scheme consists of 22 rating scales for two rating agencies: Standard & Poor’s (S&P) and Moody’s. Loan and bond ratings are based on the S&P and Moody’s bank loan rating at close. If missing, S&P and Moody’s senior debt ratings at close are used. If both ratings are available, the average rating is calculated and used.14 Country risk is approximated by Standard & Poor’s country credit rating at close and converted as presented in Table 5. Thus, this variable measures from 1 for the countries with the lowest risk to 22 for the countries of highest risk. Other measures of country risk are available and have been used in other studies – such as the monthly data compiled by the International
11 As pointed out by Sorge and Gadanecz (2008), “…additional pricing factors, such as commitment fees,
underwriting fees, participation fees, and utilization fees are typically charged during loan syndications and indeed during the whole lifetime of the loan.” Additionally, the bond issue also carries fees, namely up-front fees.
12 Despite the adjustment, we are aware that the comparability between loans and bonds has some drawbacks,
including that most bonds are fixed rate while loans are priced over a floating rate, and that bonds and loans may have quite different covenants. In section 4, we include dummies in our baseline regressions that attempt to control for these differences.
13 The average difference is 31 basis points and has a standard deviation of 44 basis points during our sample period.
Additionally, as loans are priced over a three month rate while bonds tend to be priced off longer-term benchmarks, we will include as additional control in our regression analysis (section 4) the slope of the Euro swap curve as the difference between the 5 year Euro swap rate and the 3-month Libor at the time of the signing of the loan or issuing the bonds.
Country Risk Guide (ICRG) or the country risk rank provided by Euromoney magazine. The use of S&P’s country rating is justified by its strong correlation with these alternative measures.15
**** Insert Table 5 about here ****
Loan to value ratio represents the ratio of the tranche size to the transaction size of a given loan or
bond issue. This variable is included in our analysis because we intend to control for credit protection of all positions taken by lenders. To compute loan to value ratios, we manually calculated the weight of each loan or bond tranche in each transaction that contains more than one tranche. If the transaction contains one tranche only, the loan to value ratio is 100%. As will be discussed more fully bellow, this variable should have an important role in SF instruments. For example, in an AS transaction, each senior class has absolute priority in the cash flow over the more junior classes – subordination credit enhancement mechanism. As junior classes are typically smaller than the senior ones, we find lower loan to value ratios for these tranches.
The credit spread on SF and SDF is modeled as a function of microeconomic variables. Additionally, we control for the macroeconomic conditions (e.g., level of interest rates, volatility, and slope of the yield curve). The data on macroeconomic variables are obtained from DataStream. We linked the macroeconomic variables and the microeconomic information contained in the loans (DealScan) and bonds (DCM Analytics) databases on the active date (PF loans) or issue date (AS and CB issues). The main problem in choosing a set of variables for each type of issue is the requirement that each set must be meaningful for PF, AS, and CB issues. Several variables were available for the three types of financing instruments used, which allows us to directly compare the main pricing factors for SF and SDF instruments.16
3. Financial Characteristics of SF versus SDF transactions
This section provides a full-length statistical analysis of SF versus SDF lending in Western Europe. We start by comparing the financial characteristics of PF loans with the sample of AS bonds, as well as with our CB sample. Univariate tests of significance differences between PF, AS, and CB issues are also presented. Finally, non-parametric tests are used to compare whether the values reported for each variable are significantly different in pre-crisis and crisis periods.
15
Erb, Harvey, and Viskanta (1996) find that S&P’s and Moody’s ratings have a 90% rank-order correlation with the IRCG financial rating. Corielli, et al. (2010) present a high correlation (0.902) between S&P ratings and Euromoney country risk scores.
16
We identified the possible variables to use as instruments for the credit spread based on the available literature [in particular, Kleimeier and Megginson (2000), Altunbas and Gadanecz (2004), Sorge and Gadanecz (2008), Vink and Thibeault (2008), and Gatti, el al. (2013)], and furthermore the opinions collected during verbal discussions with top investment banks confirms our choices.
3.1. Univariate Analysis
In the univariate analysis we examine how credit spread and common pricing factors compare for the three types of financing instruments. The purpose is to provide insight into the common pricing characteristics associated with SF and SDF instruments. In short, the first two hypotheses (Hypothesis 1 and Hypothesis 2) are tested with respect to SF and SDF pricing. Table 7 provides t-tests and Fisher's
exact tests comparing the values of each variable in AS bonds full sample with the corresponding values
in the PF loans full sample; the values of each variable in AS bonds full sample with the corresponding values in the CB full sample; and the values of each variable in PF loans full sample with the corresponding values in the CB full sample. The numbers are t-statistics for continuous variables and p-values for dummy variables. Almost all of the pair-wise comparisons indicate statistically significant differences between the common pricing variables associated with PF, AS, and CB issues.
The relative pricing of SF (PF and AS issues) versus SDF (CB issues) issues is one of the most important findings detailed in Tables 6 and 7. Average credit spreads are statistically and significantly higher for PF loans (198.3 bps) than they are for AS bonds (148.9 bps) and CB (157.6 bps). On the contrary, average credit spreads for AS and CB issues do not differ significantly at 5% significance level. Therefore, we accept only the hypothesis that the credit spread on SF is lower than or equal to the credit spread on SDF for AS issues (Hypothesis 2). Our findings diverge from those presented by Hu and Cantor (2006) and Maris and Segal (2002), which state that securitization securities credit spreads have been higher than corporate bond credit spreads. If we compare the average spread exhibited in Table 6 with the average spread exhibited by PF loans and all syndicated loans in the study of Kleimeier and Megginson (2000), we notice that PF loans in Western Europe have higher average spread (198.3 bps
versus 130 bps) and that PF, AS, and CB issues have higher average spread in comparison with the spread
for all syndicated loans (134 bps). Even if we compare the average credit spread for PF loans exhibited in our study without the adjustment for the risk difference of the bond and loan benchmarks (31 bps during our sample period) we continue to notice that PF loans in Western Europe have a higher average credit spread (167.3 bps versus 130 bps). However, based on recent samples Corielli, et al. (2010) and Gatti, et al. (2013) find a similar average spread for PF loans (171.8 bps and 169.18 bps, respectively). Vink and Thibeault (2008) present lower average spread for ABS (99.2 bps) and MBS (73.9 bps) in comparison with the average credit spread for AS bonds (148.9 bps) exhibited in our study.
**** Insert Tables 6 and 7 about here ****
The average credit rating for AS (4.3) and CB (4.9) issues is significantly lower than the credit rating for PF loans (7). This may suggest that PF transactions are more risky than other types of lending. However, this can reflect the country rating, since PF loan borrowers are, on average, located in far riskier countries than in the case of any other issue category. The average country rating for PF borrowers (2.1)
is significantly higher than the corresponding value for AS bonds (1.3) and CB (1.4). Despite a similar average country rating presented for AS bonds and CB they are statistically and significantly different at the 5% level or higher. When comparing SF with SDF tranches, we conclude that the average credit rating for AS bonds is significantly lower than the average credit rating for CB issues.
The observed level of management fees and the number of participating banks do provide indirect evidence that PF lending may be considered relatively more risky than other types of lending. The average level of management fees for PF loans (49 bps) is significantly higher than the level for AS (33.1 bps) and CB (22.7 bps) issues. The average number of banks participating in PF loans is 6.9 and is significantly larger than the average of 2.4 for AS bonds and 2.9 for CB. These findings suggest that banks wish to increase the number of institutions participating in a PF credit of a given size in order to spread risks over a large number of banks. AS bonds have the lowest average number of bookrunners (1.4), which differ significantly (at 5% significance level) from the average number of bookrunners in CB (1.6) and PF (2.1) issues.
PF lending exhibits the lowest average tranche size of 116.2 M€, an average 182.9 M€ and 159.7 M€ less than the average tranche size exhibited by AS and CB issues, respectively. This can be explained by the fact that PF is typically loan based or buy-and-hold project bond based. However, the average tranche size exhibited by AS bonds do not differ significantly at 5% significance level from the average tranche size exhibited by CB. If we compare the average tranche size exhibited in Table 6 for AS bonds with the average loan tranche presented by Vink and Thibeault (2008), we notice that it is relatively large when compared to 150.3 M€ and 209.6 M€ for ABS and MBS, respectively. The same pattern is observed when we compare AS and CB issues average tranche size in our study with the average tranche size of $203 million verified for all syndicated loans reported by Kleimeier and Megginson (2000).
Currency risk clearly suggests that AS bond issues are often similar to CB issues, but otherwise fundamentally different financial instruments from PF loans. PF loans in Western Europe are much less likely to be subject to currency risk (11% for PF loans versus 31.4% and 33.2% for AS and CB issues, respectively).17 Most of the non-price variables detailed in Table 6 clearly suggest that PF, AS, and CB issues are fundamentally different financial instruments. A far lower fraction of CB issues are arranged for U.K. borrowers (13.5%) than for PF loans (21.2%) and AS bonds (48.7%). CB issues are much more likely to go to borrowers/issuers in financial industry (80.8%) than SF transactions (0.4% for PF loans and 74.1% for AS bonds). Additionally, a significantly larger number of tranches per transaction are issued in a CB transaction. In a typical CB transaction, the average number of tranches per transaction is
17 If we compare the percentage of PF loan tranches subject to currency risk exhibited in Table 6, 11%, with the
percentage exhibited in Gatti, et al. (2013), 47%, we notice that PF loans in Western Europe are much less likely to be subject to currency risk.
18.4, which is larger than the average number of 2.9 for PF loans and 4.5 for AS bonds. However, this number requires further analysis. The average number of tranches in the CB high-information sample (Table 4) falls significantly to 1.8, while it remains similar for PF (3) and AS (4.2) issues. Thus, considering the average number of tranches in high-information samples we can conclude that the assets underlying an asset securitization transaction may benefit from tranching to a larger degree.
An AS tranche of average size matures over just 20.9 years, which is a long period if we compare it with the average 13.6 and 5.3 years for PF and CB tranches, respectively.18 Still, AS issues, as indicated by the standard deviation, exhibit significant heterogeneity with respect to maturity. For example, average standard deviation for maturity of AS issues is 14.8 years, while it is 9.3 and 5.9 years for PF and CB issues, respectively. The difference can be explained by the fact that certain types of assets underlying an AS structure have long maturities (e.g., residential mortgage loans). In general, the cash flow profile of the underlying assets is closely related to the maturity of the SF transactions. Finally, a significantly larger fraction of CB issues are fixed rate (79%) than the full sample of PF loans (1.4%) and the full sample of AS bonds (24.9%).
Before proceeding to the next section, we will briefly summarize the results of our univariate comparison between SF and SDF issues. We found that most of the common pricing characteristics in fact differ significantly, not only between SF and SDF issues but also among SF transactions. Table 7 shows that all pair-wise comparisons indicate statistically significant differences in value, with the exception of credit spread, tranche size, and currency risk between AS and CB issues. Therefore, we reject the hypothesis (Hypothesis 1) that pricing factors of SF credit spreads do not differ significantly in relevance from the pricing factors of SDF credit spreads. Additionally, we also found that the common pricing characteristics among SF tranches (PF loans and AS bonds) do differ significantly. Considering the financial instruments studied as a whole, we have documented that the warranties and transaction structures differ between the three types of loan issues, but that there are also important univariate differences to consider, namely: (1) PF loans’ average credit spreads are statistically and significantly higher than they are for AS and CB issues and we thus reject the Hypothesis 2; (2) Both AS and CB issues have a significant higher tranche size in comparison with PF loans; (3) AS bonds have much longer average maturity and are more likely to be arranged for U.K. borrowers than PF and CB issues; (4) PF lending may be considered relatively more risky because either the average level of management fee or the average number of banks participating are significantly larger than the average for AS and CB issues; (5) PF loans in Western Europe are much less likely to be subject to currency risk and borrowers are, on average, located in far riskier countries than in the case of any other issue category; and (6) CB issues are
18 The mean loan maturity of PF loans is 8.6 and 8.7 years in Kleimeier and Megginson (2000) and Gatti, et al.
more likely to be fixed rate rather than floating rate operations, when compared with AS and PF transactions.
We will examine loan pricing to a greater extent in section 4, when we employ OLS regression to determine what factors influence SF and SDF instruments’ credit spreads. However, our results indicate that the common pricing characteristics differ significantly in value between the three types of loan issues. Therefore, we would expect the impact on pricing to be loan-specific.
3.2. The impact of the Financial Crisis on Credit Spreads and Pricing Factors
Until 2008, SF loan and bond issues had been progressively growing (in volume), yet the 2007/2008 global financial crisis and the subsequent European sovereign debt crisis led to a drop in sponsor/issuer interest. Similar to sponsors/issuers, lenders might have also changed their attitude in terms of pricing and compensation. We are therefore investigating whether our univariate results are robust over time considering a pre-crisis period from January 1, 2000 and September 14, 2008, and a crisis period from September 15, through December 31, 2011.19
We hypothesize (Hypothesis 4) that, after controlling for macroeconomic conditions and loan characteristics, the financial crisis does not impact significantly on SF credit spreads. Thus, it is important to understand if the 2007/2008 financial crisis and the subsequent European sovereign debt crisis impact significantly not only on credit spread but also on the common pricing factors of loans and bonds. We use a non-parametric test (Wilcoxon z-test for continuous variables and Fisher's exact test for dummy variables) to compare whether the values reported for each variable are significantly different in the two periods. Table 8 provides z-tests comparing the values for two sub-samples: pre-crisis period sub-sample and crisis period sub-sample. The numbers are z-statistics and almost all of the pair-wise comparisons indicate that equality of means for continuous variables can be rejected for PF, AS, and CB issues. The only exceptions are the average credit rating for PF loans and AS bonds, the average loan to value for AS bonds, and the average management fee for CB. Similar findings are presented in Table 9 for dummy variables, which strongly support that, the proportion of tranches for which dummy = 1 differ significantly between the two sub-samples. The exceptions are the guarantee for PF loans, fixed rate issue for PF loans and AS bonds, and financial institutions for PF loans.
**** Insert Tables 8 and 9 about here ****
The evidence regarding credit spread strongly supports the assumption that the average credit spread is statistically and significantly higher for PF loans (329.1 bps versus 136.9 bps), AS bonds (206.5 bps versus 143.5 bps), and CB (220.3 bps versus 125.5) during the crisis period. Thus, we reject the hypothesis (Hypothesis 4) that the crisis do not impact significantly on SF credit spread. These simple
19 September 15, 2008 is the Lehman Brothers' bankruptcy filing date, commonly regarded as the major milestone of
sample analyses, however, do not allow us to control for other microeconomic and macroeconomic pricing factors. We thus proceed, in section 4, with regression analyses where we can take these factors directly into account.
Contrary to PF loans, AS and CB average maturities and tranche sizes have increased significantly during the crisis period. However, it is important to notice that the market for AS has gone through a structural change. During the crisis banks have underwritten their own securitization programs to use them as a guarantee for obtaining resources in the auctions of the European Central Bank; i.e., to create collateral for repo transactions.
Taking the remaining variables, we are able to document the following important findings: (1) CB issues have a significant higher credit rating during the crisis period in comparison with the pre-crisis period; (2) during the crisis period, loans and bonds in Western Europe are located in far riskier countries;20 (3) PF issues are more likely to have a higher average number of tranches and bookrunners during the crisis period than during the pre-crisis period, when compared with AS bonds; (4) during the financial crisis period, all types of issues were much less likely to be subject to currency risk; and (5) during the crisis period issuers belonging to the financial industry increased their use of SF instruments, namely AS bonds, as compared with SDF instruments: 72.1% of the AS tranches were issued by financial institutions during the pre-crisis period, which compare to 100% in the crisis period (85.5% versus 62.7% for CB).
4. The Determinants of Credit Spreads for SF and SDF transactions
In this section, we subject the various high-information samples detailed in Tables 2, 3, and 4 to OLS regression analysis. Our purposes for employing OLS regression are four-fold. First, we intend to determine which of the variables have significant and independent effect on credit spreads once the effects of other variables are accounted for. We hypothesized (Hypothesis 3) that the impact of pricing factors on credit spread does not differ significantly between SF and SDF transactions. Thus, we start our analysis by determining if SF and SDF transactions are priced in the same way, which is equivalent to testing whether PF, AS, and CB issues are priced in segmented or integrated capital markets. Second, we aim to determine whether SF transactions are more or less expensive than SDF transactions, after controlling for other factors (Hypothesis 2). Third, we intend to determine whether the 2007/2008 financial crisis impacted significantly on SF credit spreads – again, after controlling for other microeconomic and macroeconomic pricing factors (Hypothesis 4). Finally, the term structure of SF, as
20 This can be explained by the European sovereign debt crisis, which has made it difficult or impossible for some
well as of SDF transactions appears as a particular puzzle.21 Therefore, we aim to analyze the pricing of our cross section dataset of loan and bond issues within a multivariate regression framework, focusing on the relationship between credit spread and maturity, while controlling for other relevant micro and macro risk factors that affect also the credit spread.
The academic literature contains numerous loan pricing studies, both theoretical and empirical. Compared with the large amount of empirical studies on CB credit spreads, research on AS bond and PF loan credit spreads has been scant. Some of the more recent papers on CB price determinants include Duffie and Singleton (1999), Elton, et al. (2001), Collin-Dufresne, et al. (2001), Hull et al. (2004), and Gabbi and Sironi (2005). An important stream of the literature analyzes the relationship between spread and maturity. Empirical studies include Jones et al. (1984), Fons (1987), Sarig and Warga (1989), Helwege and Turner (1999), Duffie and Singleton (2001), and Sorge and Gadanecz (2008). Empirical analyses on AS bonds pricing are presented in Rothberg et al. (1989), Maris and Segal (2002), Ammer and Clinton (2004), Firla-Cuchra (2005), Gorton and Souleles (2005), Hu and Cantor (2006), Vink and Thibeault (2008), and Buscaino et al. (2012). Empirical studies on the pricing of PF loans include Esty and Megginson (2000, 2003), Kleimeier and Megginson (2000), Esty (2004), Harjoto, et al. (2006), Blanc-Brude and Strange (2007), Sorge and Gadanecz (2008), Corielli, et al. (2010), and Gatti, et al. (2013). The loan and bond pricing tests we perform are most similar to those presented in Kleimeier and Megginson (2000), Sorge and Gadanecz (2008), and Vink and Thibeault (2008), and Corielli, et al. (2010).
We estimate the determinants of loans and bonds pricing using the model described in equation [1]. The dependent variable is the credit spread, in basis points, and the independent variables are those presented and described in Table 10. We employ standard OLS regression techniques and adjust for heteroskedasticity using the methodology proposed by Huber (1967) and White (1980).22 The specification of the initial model is:
21 For PF loans, Kleimeier and Megginson (2000) conclude that PF loan pricing is not a positive function of
maturity. Sorge and Gadanecz (2008) study this apparent absence of a clear relationship between spreads and maturity in PF loans and show that the term structure of credit spreads is ‘hump-shaped’. Regarding CB, several authors [Duffie and Singleton (2001) and Sorge and Gadanecz (2008)] argue that, on average, the term structure of credit spreads for investment grade bonds appears upward-sloping. However, the literature has been more controversial regarding the term structure of credit spreads for non-investment grade bonds – Sarig and Warga (1989) and Fons (1987) find downward-sloping term structures of credit spreads for non-investment grade bonds.
22 We use the Huber-White-sandwich estimator of the variance of the linear regression estimator. The names Huber
and White refer to the seminal references for this estimator: Huber (1967) and White (1980). For further discussion of this subject see Froot (1989) and Baum (2006).
[1]
For credit spread, we first estimate a complete model using all independent variables presented in equation [1] and six new models, each including one key additional variable at a time, to test the influence of each one on the dependent variable. Thus, the following variables will be included separately in our regression models: (i) Rating and Management fee due to their limited number of observations; (ii)
Upfront fee because it is available for PF loans only; (iii) Collateral because it is available for AS bonds
only; and (iv) Fixed rate and Callable because they are available for AS and CB issues only. Table 10 gives an overview of the variables and their expected sign, taking into consideration the existing theoretical and empirical literature.
**** Insert Table 10 about here ****
4.1. Determinants of Credit Spreads for the High-Information SF and SDF Samples
A Chow test of structural change is used to investigate whether the credit spreads associated with SF and SDF issues are influenced differently by common pricing factors (Hypothesis 3). In essence, we are testing whether the pricing factors used in equation [1] are significant in both SF and SDF transactions and, if so, whether they have the same coefficient values. When running the OLS regressions for computing Chow statistics we adjusted for heteroskedasticity using the methodology proposed by Huber (1967) and White (1980). Hypothesis 3 has to be rejected because the Chow test statistics in Table 11 are all higher than the critical levels. The credit spread associated with PF, AS, and CB issues are influenced differently by common pricing factors. From our analysis, we conclude that: (i) SF and SDF transactions are distinct financial instruments; and (ii) PF loans and AS bonds are financial instruments influenced differently by common pricing factors. Hence, they are not priced in a single integrated market and we cannot estimate the full sample of loans and bonds in a single regression. This means also that we cannot directly test whether the spread on SF is lower than or equal to the credit spread on SDF (Hypothesis 2) by including a PF and an AS dummy variable in a regression of a sample of all types of financing transactions.
**** Insert Table 11 about here ****
Considering that we reject Hypothesis 3, next we examine the determinants of credit spreads for each type of issue using OLS regression framework. Table 12 presents the results of estimating equation [1] using each of the three high-information samples discussed in section 2. The regression intercepts for each type of loan issue show – although a direct comparison is not possible since some of the variables
i i i i i i i i i i i i i i i i i i Other Government tion Transporta Utilities Industrial Commercial m Libor y EUSA Volatility rate free Risk Crisis borrowers K U risk Currency risk Country banks of Number tranches of Number Maturity value to loan Log size n transactio Log spread Credit 18 17 16 15 14 13 12 11 10 9 8 7 6 5 4 3 2 1 3 5 . .
are omitted because of collinearity –, as pointed out in the univariate analysis (Table 6), the highest credit spread for PF loans in Western Europe when compared to AS and CB issues. This result, coupled with the univariate test results (Table 7) shows that PF loans have significantly higher credit spreads than AS and CB issues. These findings are contrary to those of Kleimeier and Megginson (2000), who find that PF loans have significantly lower spreads than other syndicated loans (corporate control; capital structure; and general corporate purpose). However, this is in line with the prediction of Fabozzi et al. (2006) and Gatti (2008), who present higher costs of borrowing when compared to conventional financing as one of the major disadvantages of project finance – they are costly to set up, take a long time to execute, and are highly restrictive once in place.
**** Insert Table 12 about here ****
The second line of Table 12 details the influence of transaction size on credit spread, which is insignificant for AS but negative and significant for PF and CB. This suggests that increasing the transaction size by 100 M€ will reduce the required credit spread by 89.89 basis points (bps) and 40.53 bps for PF loans and CB, respectively. One could interpret this significant negative relationship between transaction size and credit spread as evidence of a positive price liquidity effect related to the size of the entire issue. Loan to value ratio behaves differently for PF loans than for AS bonds. Whereas spread and loan to value are significantly, positively related for PF loans, they have a significant negative relationship for AS bonds. These results are in line with the expected coefficient sign for PF and AS issues. AS bonds demonstrate a larger coefficient compared to PF loans, which means that lenders associate an increase in the loan to value ratio with a significant reduction of credit risk for these types of securities.
Whereas credit spread and maturity are significantly, negatively related for CB issues, they show an insignificant relationship for PF and AS issues. The coefficient value indicates that issuing a CB, with an original maturity one year longer than the median, decreases credit spread by 1.12 bps. Similarly, the
number of tranches has an insignificant relationship with credit spread across SF transactions, but
significant for CB issues. Thus, we do not find any evidence that issuers exploit market factors to their advantage via tranching of AS bonds. For CB issues, as expected, riskier transactions imply a higher number of tranches as each investor is available to constitute a lower share in their portfolio; i.e., an issuer will benefit from more tranches in the transaction especially in the situation of a higher degree of information asymmetry.
The variable number of banks behaves differently for PF loans as compared with for AS and CB issues. Whereas credit spread and number of banks are significantly and positively related for PF loans, they have a significantly negative relationship for AS and CB issues. The need for a higher number of banks in arranging a PF transaction can possibly be associated with an increase in risk and thus an extra
premium is demanded. For AS and CB issues, a larger number of banks involved is able to lower the spread once investors associate a larger number of banks with an increase in the certification of the transaction.
The country risk variable is significantly positive for PF loans, indicating that lending to a borrower located in a country with a rating of BB+ (BB+=11) versus one with a rating of AAA (AAA=1) will increase loans credit spread by 77.80 bps. Contrary to what we expected, based on empirical literature [Kleimeier and Megginson (2000)], currency risk dummy has a significant, positive relationship with the credit spread for PF loans. This finding for Western European PF transactions suggests that a mismatch in the currency of the borrower’s home country and the currency of the PF loan repayment, significantly increases the rate charged on an average loan by 38.11 bps. We expected U.K. borrowers to raise funds at a lower spread compared to borrowers from continental Europe. However, U.K. borrowers’ dummy variable is significantly positive for both PF and CB issues, indicating that lending to a borrower located in U.K. versus one in Continental Europe will increase credit spreads by 49.85 bps and 17.49 bps for PF and CB issues, respectively.
As expected, the 2007/2008 financial crisis and the subsequent European sovereign debt crisis have imposed a significant increase in credit spreads of all the types of financing. A transaction with the issue date or active date belonging to the crisis period will have a higher average credit spread of 174.01 bps, 121.25 bps, and 77.41 bps for PF, AS, and CB issues, respectively.
The risk free rate has an insignificant relationship with AS bond credit spreads, but a significantly negative relationship with PF loan credit spreads. Our findings for PF loans differ from those of Blanc-Brude and Strange (2007), who find for a sample of EU and UK PPPs that risk-free rate variable proves to have no statistically significance on the pricing of PF tranches. Credit spread and the slope of the Euro swap curve – EUSA5y-Libor3M –are significantly and negatively related for SF transactions; i.e., a steeper Euro swap curve is associated with lower credit spreads. This suggests that SF credit spreads contain strong systematic risk components. On the contrary, the relationship between credit spreads and the slope of the Euro swap curve is insignificant for SDF transactions. Our results are in line with those of Hu and Cantor (2006), but contrary to those of Sorge and Gadanecz (2008). The variable volatility behaves differently for PF loans than for AS and CB issues. Whereas credit spread and volatility are significantly and positively related for AS and CB issues, they have an insignificant relationship for PF loans. In the presence of higher volatility, AS and CB issuers will pay a higher return.
The last six variables are dummy variables resulting from the categorical variable sector. The control group includes financial institutions. Thus, the interpretation of the coefficients for sector dummy variables (Commercial, Industrial, Utilities, Transportation, Government, and Other) occurs with reference to that omitted variable. We discover, in line with Corielli et al. (2010), that sector does not
influence the level of credit spreads in PF transactions. While the commercial dummy variable has a significantly positive relationship with AS bond credit spreads, industrial, utilities, and transportation dummy variables have insignificant coefficients. This means that in model [1b] the predicted credit spread is approximately 108.80 bps higher for issuers belonging to the commercial sector than in the financial industry. For CB issues, and with the exception of the government dummy variable, all other sector dummy variables have predicted credit spreads higher than those for the financial industry.
DealScan and DCM Analytics databases provide varying information about individual loans and bond issues, respectively. Depending upon factors such as sector, nationality of borrower, the facility type for PF loans and factors such as deal type, sector, issuer nationality, and issue type for AS and CB issues, databases provide varying amounts of information. Thus, information on credit rating, fee level, type of interest rate, if the bond is callable, and collateral is available only for some of the transactions belonging to our high-information sub-samples. Rather than restrict ourselves to analyzing a single sample with all of this information available – which, e.g., yield a sample size of less than 39 loans for PF transactions –, we study and compare several different PF, AS, and CB sub-samples, grouped on the basis of the availability of key data items.
4.2. The Impact of Credit Risk on SF and SDF Credit Spreads
It is difficult to obtain credit risk information for PF loans. This is because the information about the credit rating for PF loans at closing date provided by DealScan is scant when compared with the credit rating information provided by DCM Analytics database for AS and CB issues. Models [2a], [2b], and [2c] present loan pricing regression results for a sample of 39 PF loans, 364 AS bonds, and 8,686 CB with a credit rating at closing date from either S&P or Moody’s.23 We compare these results with those obtained from the estimation of equation [1], using each of the three high-information samples (models [1a], [1b], and [1c]). Table 13 shows exactly the results expected; i.e., the higher the credit risk of the borrower or issuer the higher the credit spread. A one unit increase in credit rating (corresponding to a downgrade from AAA to AA+) is associated with an increase of 7.37 bps, 27.44 bps, and 29.06 bps in PF, AS, and CB issues credit spread, respectively. The inclusion of a direct measure of credit risk has a considerable impact on the regressions intercept, causing a reduction of 154.00 bps for PF loans, 100.17 bps for AS bonds, and 220.92 bps for CB.
**** Insert Table 13 about here ****
Considering SDF (CB) issues, model [2c] yields an adjusted R2 value of 0.43, which compares with a value of 0.21 for model [1c]. This shows, as referred virtually by all of the empirical studies on
23 We estimated models [2a], [2b], and [2c] using a rating scale – we reclassified the S&P’s ratings into five
categories ranging from best to default – like the one proposed by Corielli, et al. (2010) and the results remain largely the same.