EUROPEAN ORGANISATION FOR NUCLEAR RESEARCH (CERN)
Submitted to: JINST CERN-PH-EP-2015-130
28th September 2015
Modelling Z →
ττ processes in ATLAS
with
τ-embedded Z → µµ data
The ATLAS Collaboration
Abstract
This paper describes the concept, technical realisation and validation of a largely data-driven method to model events with Z → ττ decays. In Z → µµ events selected from proton–proton collision data recorded at √s= 8 TeV with the ATLAS experiment at the LHC in 2012, the Z decay muons are replaced by τ leptons from simulated Z → ττ decays at the level of reconstructed tracks and calorimeter cells. The τ lepton kinematics are derived from the kinematics of the original muons. Thus, only the well-understood decays of the Z boson and τ leptons as well as the detector response to the τ decay products are obtained from simulation. All other aspects of the event, such as the Z boson and jet kinematics as well as effects from multiple interactions, are given by the actual data. This so-called τ-embedding method is particularly relevant for Higgs boson searches and analyses in ττ final states, where Z → ττ decays constitute a large irreducible background that cannot be obtained directly from data control samples. In this paper, the relevant concepts are discussed based on the implementation used in the ATLAS Standard Model H → ττ analysis of the full datataset recorded during 2011 and 2012.
c
2015 CERN for the benefit of the ATLAS Collaboration.
Reproduction of this article or parts of it is allowed as specified in the CC-BY-3.0 license.
1 Introduction
The experimental sensitivity of searches for (and eventually studies of) Higgs bosons in ττ final states at the LHC is driven by analyses of intricate event signatures that are not restricted to the Higgs candidate decay products. For example, the missing transverse momentum enters the reconstruction of the di-τ invariant mass mττ, which is a key quantity in these analyses. The shape of the reconstructed mττ distri-bution also depends on the boost of the ττ system and thus on the presence and kinematics of additional jets in the event. In addition, details of the final-state topology are used to define event categories, for ex-ample based on vector-boson fusion topologies characterised by two high-energy jets with large rapidity separation, and recent ATLAS analyses [1] also combine them into multivariate classifiers to extract the Higgs boson signal.
In these analyses, events with Z/γ∗ → ττ decays constitute a large irreducible background, and thus a reliable and detailed model of these processes is a critical ingredient. In view of the complexity of the relevant event properties it is highly desirable to rely as little as possible on simulation; moreover, it has been shown in dedicated measurements [2–4] that existing Monte Carlo simulations of Z+jets events need to be corrected in order to model the data. Ideally the model would be obtained directly from the collision data. However, due to background contributions, e.g. from events with other objects misidentified as τ decays, it is difficult to select a sufficiently pure Z/γ∗ →ττ sample from the data, and doing so without also including Higgs boson decays to τ lepton pairs is conceptually impossible.
Z/γ∗ → ττ events can still be modelled in a largely data-driven way by using Z/γ∗ → µµ events as a starting point.1 Except for effects due to the difference in muon and τ lepton masses, the two processes are kinematically identical assuming lepton universality. In particular the kinematics of the Z boson and additional jets in the event are independent of the Z decay mode. By requiring two isolated, high-energy muons with opposite charge, Z → µµ decays can be selected from the data with high efficiency and purity, and due to the small muon mass and correspondingly small Higgs–muon coupling, the H → µµ contamination is expected to be negligible for all practical purposes. The detector response to the Z decay muons can be removed from the data events and replaced by corresponding information for τ leptons from simulated Z → ττ decays, where the τ kinematics are derived from the kinematics of the original muons (taking into account both the τ–µ mass difference and the τ–τ spin correlation). This substitution results in a Z → ττ event model where only the well-understood decays of the Z boson and τ leptons and the detector response to the τ lepton decay products are obtained from the simulation. All other aspects of the event – including, for example, the kinematics of the Z boson and additional jets, the underlying event as well as effects from multiple interactions – are directly taken from the data. The simulated and collision-data information are combined based on reconstructed tracks and calorimeter cells, followed by a re-reconstruction of the resulting hybrid events. In the following, this technique is referred to as embedding of simulated Z → ττ decays in Z → µµ data events (or, in short, τ embedding). It has been used in all H → ττ searches by ATLAS [5–8] to date, including the most recent analysis [1] establishing evidence for this decay. Corresponding CMS analyses [9,10] have applied a similar technique. In addition, the method was adapted to single-τ processes for use in the analysis of W → τντdecays [11] and searches for charged Higgs bosons [12,13].
This paper describes the concept, technical realisation and validation of the τ embedding corresponding to the implementation used in the ATLAS H → ττ analysis [1] of the full pp collision dataset recorded during 2011 and 2012 at centre-of-mass energies of √s = 7 TeV and √s = 8 TeV, respectively. The
method is valid for all τ lepton decay channels. However, here the discussion and examples focus on final states where one of the τ leptons decays leptonically and the other one hadronically, also referred to below as the lepton-hadron ττ decay mode. This corresponds to the most sensitive H → ττ channel and tests the embedding of both the leptonic and hadronic τ decays. After a description of the ATLAS detector and the final-state reconstruction algorithms in Section2, Section3provides an overview of the relevant event samples and selections. Section4outlines the concept and implementation of the τ-embedding method. Studies to validate the procedure and associated systematic uncertainties are discussed in Section5. A summary and conclusions are given in Section6.
2 Experimental setup
2.1 The ATLAS detector
The ATLAS detector [14] at the LHC covers nearly the entire solid angle around the collision point. It consists of an inner tracking detector surrounded by a thin superconducting solenoid, electromagnetic and hadronic calorimeters, and a muon spectrometer incorporating three large superconducting toroid magnets, each with eight coils. The inner-detector system (ID) is immersed in a 2 T axial magnetic field and provides charged-particle tracking in the pseudorapidity range2|η| < 2.5. The high-granularity silicon pixel detector covers the vertex region and typically provides three measurements per track. It is followed by the silicon microstrip tracker which usually provides four two-dimensional measurement points per track. These silicon detectors are complemented by the transition radiation tracker, which enables radially extended track reconstruction up to |η| = 2.0. The transition radiation tracker also provides electron identification information based on the fraction of hits (typically 30 in total) above a higher energy-deposit threshold corresponding to transition radiation. The calorimeter system covers the pseudorapidity range |η| < 4.9. Within the region |η| < 3.2, electromagnetic calorimetry is provided by barrel and end cap high-granularity lead/liquid-argon (LAr) electromagnetic calorimeters, with an additional thin LAr presampler covering |η| < 1.8, to correct for energy loss in material between the interaction vertex and the calorimeters. Hadronic calorimetry is provided by the steel/scintillating-tile calorimeter, segmented into three barrel structures within |η| < 1.7, and two copper/LAr hadronic endcap calorimeters. The solid angle coverage is completed with forward copper/LAr and tungsten/LAr calorimeter modules optimised for electromagnetic and hadronic measurements respectively. The muon spectrometer (MS) comprises separate trigger and high-precision tracking chambers measuring the deflection of muons in a magnetic field generated by superconducting air-core toroids. The precision chamber system covers the region |η| < 2.7 with three layers of monitored drift tubes, complemented by cathode strip chambers in the forward region, where the background is highest. The muon trigger system covers the range |η| < 2.4 with resistive plate chambers in the barrel, and thin gap chambers in the endcap regions. A three-level trigger system is used to select interesting events [15]. The Level-1 trigger is implemented in hardware and uses a subset of detector information to reduce the event rate to a design value of at most 75 kHz. This is followed by two software-based trigger levels which together reduce the event rate to about 400 Hz.
2ATLAS uses a right-handed coordinate system with its origin at the nominal interaction point (IP) in the centre of the detector
and the z-axis along the beam pipe. The x-axis points from the IP to the centre of the LHC ring, and the y-axis points upwards. Cylindrical coordinates (r, φ) are used in the transverse plane, φ being the azimuthal angle around the beam pipe. The pseudorapidity is defined in terms of the polar angle θ as η= − ln tan(θ/2). Angular distance is measured in units of ∆R ≡ p(∆η)2+ (∆φ)2.
2.2 Final-state reconstruction
Muon candidates are reconstructed using an algorithm [16] that combines information from the ID and the MS. The distance between the z-position of the point of closest approach of the muon inner-detector track to the beam-line and the z-coordinate of the primary vertex3is required to be less than 1 cm. This requirement reduces the contamination due to cosmic-ray muons and beam-induced backgrounds. Muon quality criteria such as inner-detector hit requirements are applied in order to achieve a precise meas-urement of the muon momentum and reduce the misidentification rate. Muons are required to have a momentum in the transverse plane pT > 10 GeV and a pseudorapidity of |η| < 2.5. Isolation requirements on close-by tracks and energy depositions in the calorimeter are applied in order to distinguish prompt muons from other candidates originating e.g. from hadronic showers.
Electron candidates are reconstructed from energy clusters in the electromagnetic calorimeters matched to a track in the ID. They are required to have a transverse energy, ET = E sin θ, greater than 15 GeV, be within the pseudorapidity range |η| < 2.47 and satisfy the medium shower shape and track selection criteria defined in Ref. [17]. Candidates found in the transition region between the end-cap and barrel calorimeters (1.37 < |η| < 1.52) are not considered. Like for the muons, isolation criteria are applied to suppress non-prompt candidates originating e.g. from hadronic showers.
Jets are reconstructed using the anti-kt jet clustering algorithm [18,19] with a radius parameter R= 0.4, taking topological energy clusters [20] in the calorimeters as inputs. Jet energies are corrected for the contribution of multiple interactions using a technique based on jet area [21] and are calibrated using pT- and η-dependent correction factors determined from simulation and data [22–24]. Jets are required to be reconstructed in the range |η| < 4.5 and to have pT > 30 GeV. To reduce the contamination by jets from additional pp interactions in the same or neighbouring bunch crossings (pile-up), tracks originating from the primary vertex must contribute a large fraction of the pT when summing the scalar pT of all tracks associated with the jet. This jet vertex fraction (JVF) is required to be at least 50% for jets with pT < 50 GeV and |η| < 2.4. Jets with no associated tracks are retained.
Hadronically decaying τ leptons are reconstructed starting from clusters of energy depositions in the electromagnetic and hadronic calorimeters. The τhad4 reconstruction is seeded by the anti-kt jet-finding algorithm with a radius parameter R = 0.4. Tracks with pT > 1 GeV within a cone of size ∆R = 0.2 around the cluster barycentre are assigned to the τhad candidate. Its momentum is calculated from the topological energy clusters associated with the jet seed after applying a dedicated τhadenergy calibration. The τhadcharge is determined from the sum of the charges of the associated tracks. The rejection of jets is provided in a separate identification step using discriminating variables based on tracks with pT > 1 GeV and the energy deposited in calorimeter cells found in the core region (∆R < 0.2) and in the region 0.2 < ∆R < 0.4 around the τhad candidate’s direction. Such discriminating variables are combined in a boosted decision tree and three working points, labelled tight, medium and loose [25], are defined, corresponding to different τhadidentification efficiency values. In the studies presented in this paper, τhad candidates with pT > 20 GeV and |η| < 2.47 are used. The τhad candidates are required to have one or three reconstructed tracks with a total charge of ±1 and to satisfy the medium criteria, which provide an identification efficiency of the order of 55–60%. Dedicated criteria [25] to separate τhadcandidates from misidentified electrons are also applied, with a selection efficiency for true hadronic τ decays of 95%. The probability to misidentify a jet with pT > 20 GeV as a τhadcandidate is typically 1–2%.
3The primary vertex is the proton–proton vertex candidate with the highest sum of the squared transverse momenta of all
associated tracks.
4In the following, the τ
Following their reconstruction, candidate leptons, hadronically decaying τ leptons and jets may point to the same energy deposits in the calorimeters. Two reconstructed objects are considered to overlap if their separation∆R is smaller than 0.2. Such overlaps are removed by selecting objects in the following order of priority (from highest to lowest): muons, electrons, τhad, and jet candidates. Objects with lower priority are discarded when overlapping with another object with higher priority. The leptons that are considered in overlap removal with τhadcandidates need only to satisfy looser criteria than those defined above, to reduce misidentified τhad candidates from leptons. The pT threshold of muons considered in overlap removal is also lowered to 4 GeV.
The missing transverse momentum (with magnitude EmissT ) is reconstructed using the energy deposits in calorimeter cells calibrated according to the reconstructed physics objects (e, γ, τhad, jets and µ) with which they are associated [26]. The transverse momenta of reconstructed muons are included in the ETmiss calculation, with the energy deposited by these muons in the calorimeters taken into account. The energy from calorimeter cells not associated with any physics object is scaled according to a soft-term vertex fraction and also included in the ETmiss calculation. This fraction is the ratio of the summed scalar pT of tracks from the primary vertex not matched with objects to the summed scalar pT of all tracks in the event also not matched to objects. This method allows a better reconstruction of the ETmissin high pile-up conditions [27].
3 Data samples and event selection
3.1 Event samples
The studies presented in this paper are based on data recorded with ATLAS during the 2012 LHC run at a proton–proton centre-of-mass energy √s= 8 TeV. After data-quality requirements, these correspond to an integrated luminosity of 20.3 fb−1.
For the validation of the τ-embedding procedure, samples of Monte Carlo simulated (MC) events with Z → µµ and Z → ττ decays are used as input or as reference, respectively. Simulated events are produced with the Alpgen [28] event generator employing the MLM matching scheme [29] between the hard process (calculated with leading-order matrix elements for up to five partons) and the parton shower. The Cteq6L1 parameterisation of the parton distribution functions [30] is used and the Pythia8 program [31] provides the modelling of the parton shower, the hadronisation and the underlying event. A full simulation of the ATLAS detector response [32] using the Geant4 program [33] is performed. In addition, events from minimum-bias interactions are simulated using the AU2 [34] tuning of Pythia8. They are overlaid with the simulated signal and background events according to the luminosity profile of the recorded data. The contributions from these pile-up interactions are simulated both within the same bunch crossing as the hard-scattering process and in neighbouring bunch crossings. Finally, the resulting simulated events are processed through the same reconstruction programs as the data.
In the simulation of the Z → ττ decays that are embedded into the Z → µµ input events as described in Section4.1, the τ decay products are generated using Tauola [35], and Photos [36] provides photon radiation from charged leptons.
From these datasets, the following event samples are derived:
• Replacing the muons from recorded Z → µµ data events with τ leptons from simulated Z → ττ decays as described in Section4.1results in τ-embedded data, which are the standard event samples used in physics analyses to model Z → ττ processes.
• µ-embedded data are obtained by using simulated Z → µµ decays instead of Z → ττ decays to replace the muons in the Z → µµ input data events. These make it possible to study systematic effects of the embedding procedure in comparatively simple final states. While the τ-embedded samples are based on the full 2012 dataset, the µ-embedded validation is restricted to a subset corresponding to an integrated luminosity of 1.0 fb−1.
• Using simulated instead of data Z → µµ events as input yields µ- or τ-embedded MC samples. These can then be compared to direct simulations of these processes.
• In order to study effects originating from the reconstruction of the input muons as well as of final-state radiation, alternative embedded MC samples are produced, where the kinematics of the em-bedded objects are derived from the generator-level muons instead of the reconstructed momenta. In the following, this is referred to as generator-seeded embedding, as opposed to the standard detector-seededprocedure.
3.2 Event selection
For the studies presented below, events are selected from one or several of the samples listed in Section3.1 using one of the following sets of criteria. In all cases, standard quality criteria are applied to ensure a fully operational detector and well-reconstructed events.
• Z →µµ selection:
Collision events are selected using a combined dimuon trigger, with pT thresholds of 18 GeV for the leading muon and 8 GeV for the sub-leading muon, or a single-muon trigger (pT(µ) > 24 GeV). Only events with at least two good-quality muons (cf. Section2.2) are accepted. The leading (sub-leading) muon is required to fulfil pT(µ) > 20 (15) GeV. Both muons must be isolated in the ID, which is ensured by requiring the scalar sum of other track transverse momenta in an isolation cone of size∆R = 0.4 to be smaller than 20% of the muon transverse momentum (I(pT, 0.4)/pT(µ) < 0.2). Only events containing at least one such opposite-charge muon pair with an invariant mass mµµ> 40 GeV are considered.
• Z →ττ selection:
The ττ selection is adopted from the H → ττ lepton-hadron-channel analysis documented in Ref. [1]. Both in simulated and recorded data samples, single-electron or single-muon triggers with a lepton pT threshold of 24 GeV are used to select events, in which exactly one τ candidate with pT(τhad) > 20 GeV fulfilling the medium identification criteria and either exactly one elec-tron or exactly one muon with pT(e/µ) > 26 GeV are required. In addition to a track isolation of I(pT, 0.4)/pT(e/µ) < 0.06, a calorimeter isolation of I(ET, 0.2)/pT(e/µ) < 0.06 is applied to the leptons, i.e. the scalar sum of the transverse energy deposited in calorimeter cells within∆R < 0.2 not associated with the candidate is calculated and required to be smaller than 6% of the total transverse momentum of the muon or the total transverse energy of the electron.
• Boosted Z-enriched selection:
The H → ττ lepton-hadron-channel analysis documented in Ref. [1] considers two signal event categories: a VBF category enriched in vector-boson fusion Higgs production events and a boosted category targeting mainly events with high-pTHiggs bosons produced via gluon-gluon fusion. For the boosted category, a corresponding Z-enriched control sample is defined, which is adopted here to illustrate the τ-embedding performance within physics analyses, see Section5.2. This sample includes events that pass the Z → ττ selection described above but fail the VBF category selection detailed in Ref. [1]. In addition, the pT of the Z candidate reconstructed from the vector sum of momenta of the visible τ decay products and the missing transverse momentum is required to exceed 100 GeV. In order to further enhance the fraction of Z events, W decays are suppressed by considering only events with a transverse mass5mT < 40 GeV. Potential contamination by Higgs signal events is avoided by requiring the invariant mass mMMCττ of the ττ pair not to exceed 110 GeV. This mass is reconstructed from the visible τ decay products and the missing transverse momentum with the so-called missing mass calculator (MMC) [37].
4 Embedding
In the following, the τ embedding method is described in more detail. Special properties of the resulting event samples and embedding-specific systematic uncertainties are also discussed.
4.1 Procedure
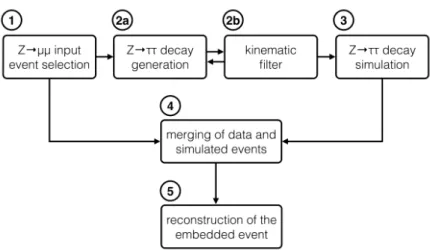
The τ embedding procedure can be separated into five consecutive steps as depicted in the flowchart shown in Figure1. After selecting the Z → µµ input event, a corresponding Z → ττ decay is generated and passed to a full detector simulation. The muons in the input event are then replaced by the τ leptons from the simulated Z decay. As a final step, a re-reconstruction of the resulting hybrid event is necessary, since it would be insufficient to combine the event information at the level of fully reconstructed physics objects. For example, the additional calorimeter energy depositions from pile-up events can change the results of the EmissT reconstruction, and the identification of hadronic τ decays is particularly sensitive to the details of the calorimeter response. In contrast, corresponding effects on the reconstruction of charged-particle tracks from the individual tracking detector hits are expected to be negligible for the data-taking conditions and the phase space relevant to the Higgs analyses of the 8 TeV data. Therefore, the embedding procedure is performed at the level of calorimeter cells and reconstructed tracks, as described in more detail below.
1. Selection of the Z → µµ input events from the collision data:
Input events for the embedding procedure are obtained according to the Z → µµ selection described in Section3.2. For events with more than two muon candidates, all possible oppositely-charged pairs with a common vertex are formed, and the muon pair with mµµclosest to the Z boson mass is chosen as the Z → µµ candidate decay products.
5m T =
q
2 · pT(`) · EmissT ·(1 − cos∆φ); ∆φ is the azimuthal angle between the directions of the electron or muon ` and the
Figure 1: Flowchart of the embedding procedure. 2. Generation of a corresponding Z → ττ decay:
a) Substitution of muons with τ leptons and subsequent τ decays:
From the selected muons in a collision data event, the four-momenta of a corresponding Z → ττ decay are derived: the production vertex of the τ leptons is set to the common production vertex of the reconstructed muon pair, and each muon is then replaced by a τ lepton. The τ four-momenta are rescaled according to
pτ= q
E2µ− m2τ,
thus keeping the energy Eµunchanged but replacing the muon mass with the τ mass mτ. The resulting Z → ττ kinematics as obtained from the Z → µµ events is processed with Tauola and Photos. Here, the decay of each τ lepton pair by Tauola takes into account the polarisation and spin correlations of the τ leptons. The Z polarisation, however, depends on the parton configuration of the initial state, which is not directly available here. Dur-ing the generation of the decays, Tauola therefore assumes an average polarisation of zero and assigns a random helicity of ±1 to each Z boson. The actual non-zero average Z po-larisation is correctly accounted for by applying event weights obtained with the TauSpinner program [38,39], which infers the most probable configuration of the initial partons and thus the helicity of the Z boson from the decay product kinematics.
b) Kinematic filter for the decay products:
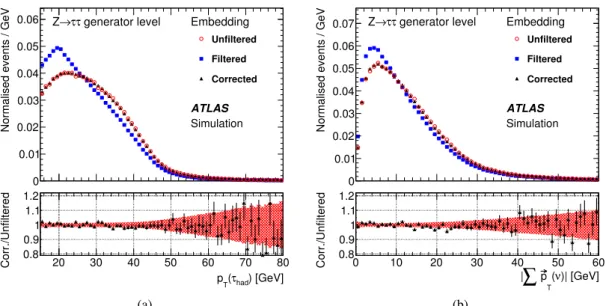
If the generation of Z → ττ decays were purely based on the probability distributions of the actual decay kinematics, a large fraction of the embedded Z → ττ decay products would fail the selection criteria of typical physics analyses. In particular the leptonic τ decays would often end up below the relevant transverse momentum thresholds. Therefore, a kinematic τ decay filter is implemented at generator level in order to increase the effective number of τ-embedded Z → µµ events entering the ττ selection. Instead of generating only one ττ decay for each Z collision data event, the Tauola program is used to produce 1000 differ-ent kinematic configurations of the decay products according to the appropriate probability distributions. Only the first of the 1000 decay configurations in which the generated trans-verse momenta of the visible decay products (e/µ/τhad) exceed certain threshold values is
20 30 40 50 60 70 80
Normalised events / GeV
0 0.01 0.02 0.03 0.04 0.05 0.06 Unfiltered Filtered Corrected ) [GeV] had τ ( T p 20 30 40 50 60 70 80 Corr./Unfiltered 0.8 0.9 1 1.1 1.2 ATLAS Simulation Embedding generator level τ τ → Z (a) 0 10 20 30 40 50 60
Normalised events / GeV
0 0.01 0.02 0.03 0.04 0.05 0.06 0.07 Unfiltered Filtered Corrected )| [GeV] ν ( T p
∑
| 0 10 20 30 40 50 60 Corr./Unfiltered 0.8 0.9 1 1.1 1.2 ATLAS Simulation Embedding generator level τ τ → Z (b)Figure 2: Generator-level distributions of (a) the τhad transverse momentum and (b) the summed transverse
mo-menta of all neutrinos for τ-embedded events without filter (red open circles), after applying the filter (blue squares) and after applying the filter with filter weights (black triangles) as described in the text. The lower panels show the relative deviation of the corrected distributions from the unfiltered ones. The red shaded error band and the black error bars correspond to the statistical uncertainty from the unfiltered and filtered events, respectively.
then selected for further processing. The thresholds can be chosen based on the final ττ ana-lysis selection; for this paper, as for the H → ττ lepton-hadron-channel anaana-lysis presented in Ref. [1], they were set to pT(τhad) > 15 GeV, pT(e) > 18 GeV and pT(µ) > 15 GeV, i.e. safely below the ττ analysis selection thresholds of pT(τhad) > 20 GeV and pT(e/µ) > 26 GeV. The selection of ττ decays according to these thresholds introduces kinematic biases as shown in Figure 2(a) for the visible momentum of hadronic τ decays and in Figure 2(b) for the vector sum of the neutrino transverse momenta, which corresponds to the expected missing transverse momentum in the event. Based on all 1000 ττ decays generated for the given Z kin-ematics, the probability to accept a random ττ decay configuration is evaluated for each event. These probabilities correspond to event-by-event filter efficiencies and are thus propagated as weights, which correct the kinematic biases as demonstrated in Figure2.
3. Detector simulation of the Z → ττ decay:
The result corresponds to a standard event generator output for a Z → ττ decay without any underlying-event effects, but otherwise based on the standard ATLAS MC configuration [32], which is then handed over to the full ATLAS detector simulation and reconstruction. In order to avoid double counting in the later merging with the corresponding collision data event, the calorimeter noise is switched off during the simulation. In the following, the output of this simulation step is referred to as a mini event.
4. Merging of data and simulated event:
In order to replace the muons in the selected Z → µµ data events with the corresponding sim-ulated τ leptons, all tracks associated with the original muons are removed from the data event. The calorimeter cells associated with the muons are subtracted according to the following proce-dure: a Z → µµ decay with the same kinematics as the original event (and without the underlying
event or pile-up interactions) is simulated. The calorimeter cell energies in the simulated event are subtracted from the data event.
All calorimeter cell energies from the simulated mini event are then added to the corresponding data cell energies, and all tracks are copied into the corresponding event. This inserts the pure Z → ττ decay into the data environment, keeping the event properties as close to data conditions as possible.
5. Reconstruction of the embedded events:
Starting from the modified cell energies and the merged set of tracks, the hybrid Z → ττ events are submitted to the ATLAS event reconstruction for collision data, which recreates the complete physics object final state by re-running all standard event reconstruction algorithms except for the track reconstruction.
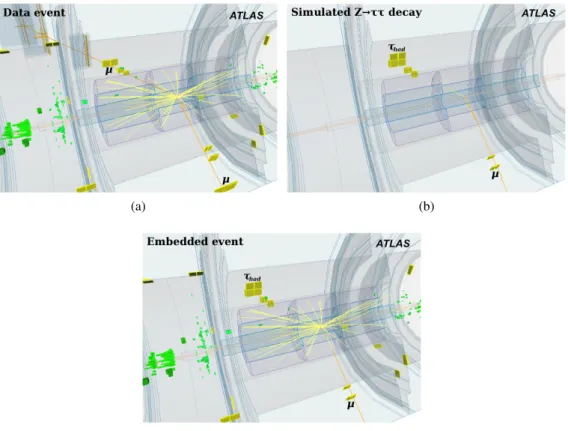
The procedure is further illustrated by Figure3, showing example displays of a Z → µµ input event, a correspondingly simulated Z → ττ mini event (with one τ lepton decaying into a muon and the other one hadronically), and the resulting embedded hybrid event.
(a) (b)
(c)
Figure 3: Displays of (a) a Z → µµ candidate event selected from the collision data, (b) the corresponding simulated Z →ττ mini event and (c) embedded hybrid event. Here, one of the τ leptons decays into a muon and the other one hadronically.
4.2 Special properties of theτ-embedded event samples
While in most respects the τ-embedded samples can be treated within physics analyses as standard colli-sion data, there are a few special properties to be considered:
• The Z → µµ input data are subject to trigger and offline selection efficiencies, which particularly affect analyses with low pT selection thresholds for the τ decay products. To account for these efficiencies, correction factors as a function of the transverse momenta and pseudorapidities of the input muons are extracted according to Refs. [15,16] and applied to the τ-embedded samples. • As discussed in Section 4.1, instead of recreating the charged-particle tracks from the tracking
detector hits, the embedding procedure is performed with reconstructed tracks. As a side effect, the trigger response for the τ-embedded events is not available, since it would require the hit-level information. Therefore, any effect of the analysis-specific trigger selection needs to be evaluated and corrected for, e.g. through a parameterisation of the trigger efficiency measured in data. For the validation in Section5.2, such corrections were derived corresponding to the Z → ττ selection described in Section3.2and applied to the τ-embedded samples.
• The selected Z → µµ input data sample is of high purity, but small contaminations from other processes, e.g. t¯tproduction, might be enhanced to relevant levels by selection requirements applied during physics analyses. Double counting of these contributions must hence be avoided when combining the τ-embedded events with other samples to construct a complete background model. In recent analyses, e.g. in Ref. [1], this is achieved by rejecting events from simulated samples of other background processes if they produce two τ leptons that fulfil the kinematic Z → µµ input selection at generator level. The corresponding ττ final states are already included in the τ-embedded sample as obtained from the corresponding µµ background contamination from other processes.
• In deriving the kinematics of the embedded τ leptons from the reconstructed muons selected from the ATLAS data, the true kinematics of the Z decay are folded with the resolution of the muon reconstruction. Final-state radiation (FSR) from the input muons can also modify the kinemat-ics of the embedded objects. Both effects are unavoidable and inseparable in the embedding of data events, but they can be studied separately using simulated samples and are found to be small (cf. Section5.2).
• While the τ-embedded samples constitute a largely data-driven model of Z → ττ events, the τ leptons and their decay products are based on simulation, and systematic uncertainties associated with the MC description of τ decays and the corresponding detector response need to be considered within physics analyses. Further documentation of these systematic uncertainties, e.g. for the hadronic τ decays, can be found in Ref. [25].
• The size of the τ-embedded samples is naturally limited by the available number of Z → µµ data events. Compared to a corresponding selection of ττ final states from the data, this number is effectively enhanced by applying the kinematic filter described in Section4.1.
4.3 Systematic uncertainties
Two different sources of systematic uncertainty are considered, which are motivated by the technical implementation of the embedding method and are thus estimated from the following variations of the embedding procedure:
1. The isolation requirement applied in the selection of the Z → µµ input events can affect the environ-ment of the embedded objects in the final event. It is thus varied in two alternative selections: the nominal isolation criterion of I(pT, 0.4)/pT(µ) < 0.2 is either completely removed or tightened to
I(pT, 0.4)/pT(µ) < 0.06 and I(ET, 0.2)/pT(µ) < 0.04. These variations mainly affect the properties of the embedded objects, but they additionally provide an estimate of the background contamination from µµ final states with non-prompt muons in the τ-embedded samples.
2. The subtraction of cell energy associated with the muon is based on the simulated calorimeter re-sponse, which can be subject to large uncertainties. Therefore, the simulated energy in each cell is scaled by ±20% before the subtraction from the data event. The size of this variation was moti-vated by the results of comparisons of τ-embedded collision-data and simulated events to standard Z →ττ MC samples.
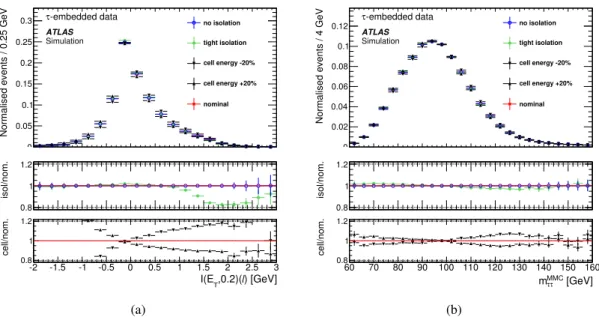
For all embedded event samples listed in Section3.1, the different variations are produced in parallel. The resulting datasets are then used to derive and validate the embedding-related systematic uncertain-ties. Different selection efficiencies, e.g. due to the modified isolation requirements, are absorbed by nor-malising the systematic variations to the default sample. For both estimates of systematic uncertainties, the remaining shape uncertainties are later symmetrised to the larger of the two variations, in particular compensating for the non-symmetric isolation criteria. Figure4illustrates the effect on the distributions of two example quantities after the Z → ττ selection as described in Section3.2.
Modifications of the input muon kinematics due to final-state radiation or the detector resolution, which could be considered as somewhat more fundamental sources of systematic effects, do not directly enter the above definitions of embedding-related uncertainties. Their impact is, however, expected to be correlated with the variations of the cell energy subtraction and the muon isolation and in fact turns out to be small in comparison, as demonstrated in Section5.2.
Normalised events / 0.25 GeV
0 0.05 0.1 0.15 0.2 0.25 0.3 no isolation tight isolation cell energy -20% cell energy +20% nominal ATLAS Simulation -embedded data τ isol/nom. 0.8 1 1.2 ) [GeV] l ,0.2)( T I(E -2 -1.5 -1 -0.5 0 0.5 1 1.5 2 2.5 3 cell/nom. 0.8 1 1.2 (a)
Normalised events / 4 GeV
0 0.02 0.04 0.06 0.08 0.1 0.12 no isolation tight isolation cell energy -20% cell energy +20% nominal ATLAS Simulation -embedded data τ isol/nom. 0.8 1 1.2 [GeV] MMC τ τ m 60 70 80 90 100 110 120 130 140 150 160 cell/nom. 0.8 1 1.2 (b)
Figure 4: Distributions of (a) the calorimeter isolation of the selected lepton and (b) the ττ invariant mass obtained with the MMC, illustrating the effects of systematic variations as described in the text: scaling the subtracted cell energy by ±20% and applying tight/ no isolation requirements in the Z → µµ selection. The ratios of the distributions before and after specific systematic variations are included as well: the upper ratio plot shows the effect of no (tight) isolation in blue (green), in the lower one the effect of scaling the subtracted cell energy by +20% (-20%) is illustrated by triangles pointing upwards (downwards). In both plots the red lines correspond to the nominal embedded sample.
5 Validation
A careful validation of the embedding procedure is performed based on different combinations of the event samples described in Section3.1. The results of these studies are discussed in the following. All distributions are normalised to unit area unless stated otherwise.
5.1 Z → µµ-based validation
The first set of studies is based on muon-embedded data and MC samples, where the original muons are removed and replaced with the decay products of correspondingly simulated Z → µµ decays. In this case, events with Z → µµ decays and jets constitute both the input and the output samples and thus distributions of any quantity for the same events before and after the embedding can be compared directly. Such comparisons provide a powerful validation of most aspects of the procedure by testing for biases introduced in the removal of tracks and cells associated with the input muons, the stand-alone simulation of the Z mini event or the creation and re-reconstruction of the embedded hybrid event. None of the trigger and selection efficiency corrections discussed in Section4.2are applied here.
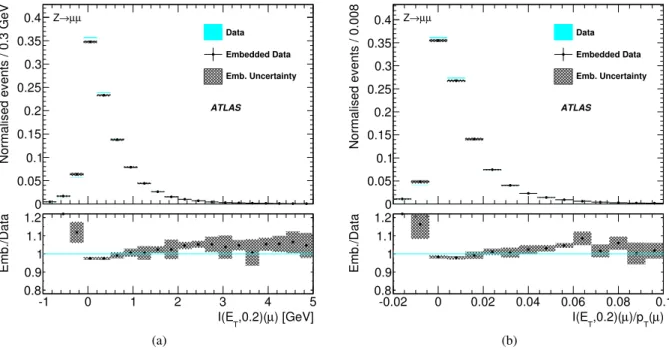
In order to investigate possible distortions of the detector response close to the input muons, Figure5 com-pares the distributions of the absolute (I(ET, 0.2)) and relative (I(ET, 0.2)/pT) muon calorimeter isolation as defined in Section3.2, before and after µ embedding. Here, the displayed errors do not include the isolation systematic uncertainty, which is obtained by varying an explicit cut on the relative calorimeter isolation, cf. Section4.3, and is thus not well defined in these specific comparisons. The observed changes in the distributions, which indicate fluctuations in the estimation of the calorimeter energy associated to
) [GeV]
µ
,0.2)(
TI(E
-1 0 1 2 3 4 5Normalised events / 0.3 GeV
0 0.05 0.1 0.15 0.2 0.25 0.3 0.35 0.4 Z→µµ Data Embedded Data Emb. Uncertainty ATLAS ) [GeV] µ ,0.2)( T I(E -1 0 1 2 3 4 5 Emb./Data 0.8 0.9 1 1.1 1.2 (a)
)
µ
(
T)/p
µ
,0.2)(
TI(E
-0.02 0 0.02 0.04 0.06 0.08 0.1 Normalised events / 0.008 0 0.05 0.1 0.15 0.2 0.25 0.3 0.35 0.4 Z→µµ Data Embedded Data Emb. Uncertainty ATLAS ) µ ( T )/p µ ,0.2)( T I(E -0.02 0 0.02 0.04 0.06 0.08 0.1 Emb./Data 0.8 0.9 1 1.1 1.2 (b)Figure 5: Comparison of Z → µµ data events before (blue) and after µ embedding (black points) in terms of (a) the calorimeter isolation and (b) the relative calorimeter isolation in a cone∆R = 0.2, each including ratios showing the relative differences of the distributions after µ embedding. The grey hatched error band corresponds to the cell energy systematic uncertainties of the µ-embedded events, as described in Section4.3.
) [GeV]
µ
(
Tp
0 10 20 30 40 50 60 70 80 90 100Normalised events / 5 GeV
0 0.05 0.1 0.15 0.2 0.25 Z→µµ Data Embedded Data Emb. Uncertainty ATLAS ) [GeV] µ ( T p 0 10 20 30 40 50 60 70 80 90 100 Emb./Data 0.8 0.9 1 1.1 1.2 (a)
[GeV]
µ µm
60 70 80 90 100 110 120Normalised events / 2 GeV
0 0.05 0.1 0.15 0.2 0.25 µ µ → Z Data Embedded Data Emb. Uncertainty ATLAS [GeV] µ µ m 60 70 80 90 100 110 120 Emb./Data 0.8 0.9 1 1.1 1.2 (b)
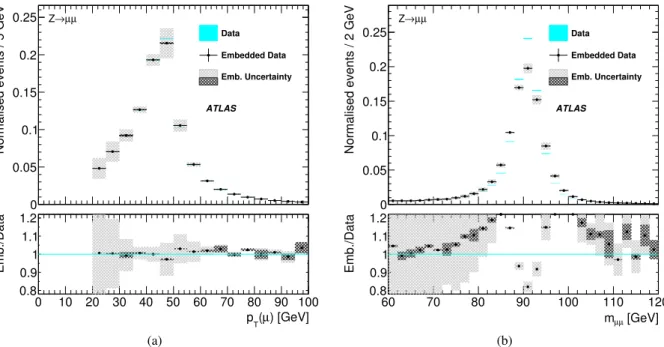
Figure 6: Comparison of Z → µµ data events before (blue) and after µ embedding (black points): (a) transverse momentum of the leading muon and (b) dimuon mass, each including ratios showing the relative differences of the distributions after µ embedding. The light (dark) grey hatched error band corresponds to the sum in quadrature of cell+ isolation (cell only) systematic uncertainties of the µ-embedded events.
the input muons based on an independent simulation discussed in Section4.1, are not fully covered by the remaining embedding-specific uncertainties. However, this mainly concerns negative isolation val-ues, which are far away from standard isolation requirements as also used for the studies presented in this paper, and the region with I(ET, 0.2)/pT > 0.04, where the undisplayed isolation uncertainty becomes very large by construction. In corresponding comparisons, the kinematics of additional jets in the event are found to be unaffected by the embedding procedure.
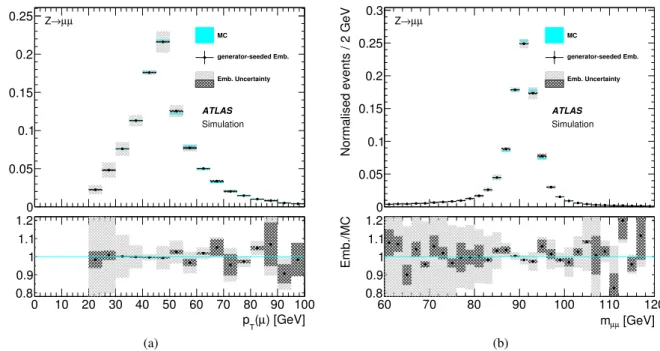
For quantities directly related to the muon four-momenta, most changes are found to be within the un-certainties; for example, Figure 6(a) shows the transverse momentum of the leading muon. In some cases, however, larger effects are observed, in particular for the dimuon invariant mass as depicted in Fig-ure6(b); small differences are also found at the low end of the distributions of the transverse momentum of the dimuon system and of the missing transverse momentum. Such differences are actually expected since the kinematics of the embedded events are based on reconstructed input muons and thus are poten-tially modified by the detector resolution and final-state radiation (FSR), as explained in Section4.2. This is investigated further by using generator-seeded embedded samples, where simulated Z → µµ events are used as input and the kinematics of the embedded objects is derived from the generator-level muon momenta instead of the reconstructed information, cf. Section3.1, thus removing FSR and muon recon-struction effects. This indeed improves the agreement in the muon-related distributions shown for the leading muon pT and the dimuon mass in Figure 7. While these simulation-based studies confirm the source of the differences in Figure6, muon reconstruction and FSR effects unavoidably enter the embed-ding of data events. For the eventual applications of τ embedembed-ding, however, these differences turn out to be negligible as demonstrated in the next section.
) [GeV]
µ
(
Tp
0 10 20 30 40 50 60 70 80 90 100Normalised events / 5 GeV
0 0.05 0.1 0.15 0.2 0.25 Z→µµ MC generator-seeded Emb. Emb. Uncertainty ATLAS Simulation ) [GeV] µ ( T p 0 10 20 30 40 50 60 70 80 90 100 Emb./MC 0.8 0.9 1 1.1 1.2 (a)
[GeV]
µ µm
60 70 80 90 100 110 120Normalised events / 2 GeV
0 0.05 0.1 0.15 0.2 0.25 0.3 µ µ → Z MC generator-seeded Emb. Emb. Uncertainty ATLAS Simulation [GeV] µ µ m 60 70 80 90 100 110 120 Emb./MC 0.8 0.9 1 1.1 1.2 (b)
Figure 7: Comparison of Z → µµ MC events (blue) and generator-seeded µ embedding (black points): (a) trans-verse momentum of the leading muon and (b) dimuon mass, each including ratios showing the relative differences of the distributions after generator-seeded µ embedding. The light (dark) grey hatched error band corresponds to the sum in quadrature of cell+ isolation (cell only) systematic uncertainties and the statistical uncertainties of the µ-embedded events.
5.2 Z → ττ-based validation
The Z → µµ-based results presented above already provide confidence that the technical implementation of the embedding procedure is working correctly. Nevertheless, direct comparisons of ττ final states must also be performed in order to conclusively validate the modelling of Z → ττ events provided by the final τ-embedded samples. Since it is difficult to obtain a sufficiently pure Z → ττ reference sample from the collision data, the validation is mainly based on comparisons of τ-embedded Z → µµ MC events to standard Z → ττ MC samples. Still, comparisons of selected Z → ττ collision data to a combined background model including τ-embedded data are also provided in the last part of this section.
Input muon radiation and reconstruction effects
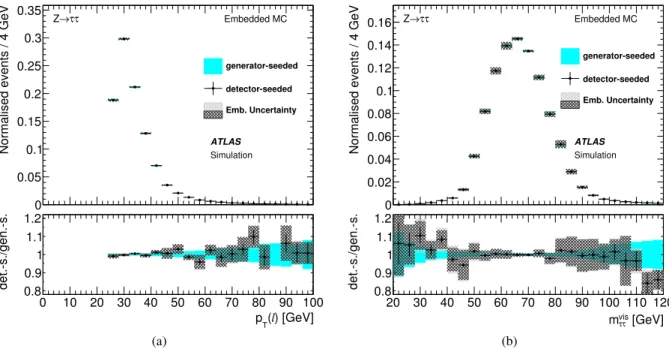
The embedding procedure includes two effects related to the input muons that are unavoidable by con-struction: the resolution of the reconstructed muon momenta used to derive the kinematics of the em-bedded mini event and FSR from the input muons. In order to judge if the resolution effects observed in Section5.1 are significant for the eventual τ embedding, Figure8 compares the distributions of the τ decay lepton transverse momentum and of the invariant mass of the visible ττ decay products, mvis
ττ, for generator- and detector-seeded τ embedding. These comparisons demonstrate that the uncorrected resolution and final-state radiation of the input muons are negligible in the case of reconstructed ττ final states, for which the mass resolution is dominated by the neutrinos produced in the τ decay.
) [GeV]
l
(
Tp
0 10 20 30 40 50 60 70 80 90 100Normalised events / 4 GeV
0 0.05 0.1 0.15 0.2 0.25 0.3 0.35 τ τ → Z Embedded MC generator-seeded detector-seeded Emb. Uncertainty ATLAS Simulation ) [GeV] l ( T p 0 10 20 30 40 50 60 70 80 90 100 det.-s./gen.-s. 0.80.9 1 1.1 1.2 (a)
[GeV]
vis τ τm
20 30 40 50 60 70 80 90 100 110 120Normalised events / 4 GeV
0 0.02 0.04 0.06 0.08 0.1 0.12 0.14 0.16 Z→ττ Embedded MC generator-seeded detector-seeded Emb. Uncertainty ATLAS Simulation [GeV] vis τ τ m 20 30 40 50 60 70 80 90 100 110 120 det.-s./gen.-s. 0.80.9 1 1.1 1.2 (b)
Figure 8: Comparison of generator-seeded (gen.-s.), in blue, and detector-seeded (det.-s.), as black points, τ-embedded Z → µµ MC events: (a) transverse momentum of the leading lepton and (b) invariant mass of the visible ττ decay products, each including ratios showing the relative differences of the distributions from detector-seeded τ embedding. The blue error band in the ratio plots corresponds to the statistical uncertainties of the generator-seeded events, and the black error bars are the statistical uncertainties associated with the detector-generator-seeded embedded events. The light (dark) grey hatched error band corresponds to the sum in quadrature of cell+ isolation (cell only) systematic uncertainties and the statistical uncertainties of the detector-seeded τ-embedded events.
Comparison ofτ-embedded Z → µµ MC samples with standard Z → ττ MC
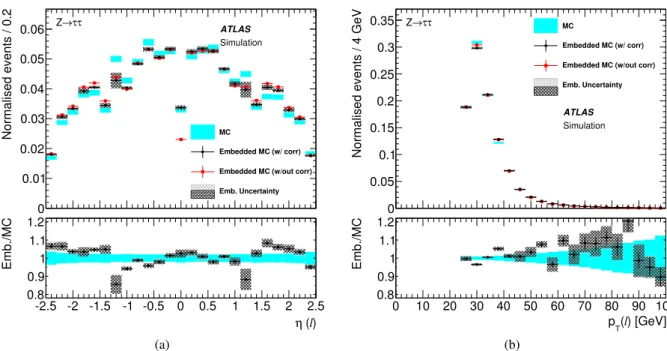
In contrast to a data-to-data comparison of ττ final states, which necessarily includes contaminations from other background processes, the τ embedding of simulated Z → µµ events and subsequent comparison to standard Z → ττ MC samples provides a well-defined way to further study the method at the ττ level. Here, as opposed to the studies presented in Section5.1, the two compared distributions are obtained from statistically independent event samples. Also, the corrections discussed in Section4.2, including those related to the selection of the Z → µµ events used as input for the embedding procedure and to the trigger selection of the τ decay products, now need to be applied. The combined effect of these corrections is shown in Figure9for the distributions of two quantities closely related to their source: the pseudorapid-ity and the transverse momentum of the τ decay lepton. The mismodelling of the pseudorapidpseudorapid-ity before corrections, cf. Figure9(a), is due to detector acceptance differences between the input muons and em-bedded τ objects. While the corrections have a visible effect here, their impact is found to be very small for the lepton pT shown in Figure9(b)and also for any other of the investigated quantities. Even after corrections, the modelling of the pseudorapidity is not perfect but, as demonstrated below, this has no impact on observables relevant for physics analyses.
Further examples of such comparisons, from here on omitting the uncorrected distributions, are collected in Figure10and Figure11. Figures10(a)and10(b)show the distributions of two of the input quantities for the hadronic τ identification: the central energy fraction, which is the ratio of the transverse energy
)
l
(
η
-2.5 -2 -1.5 -1 -0.5 0 0.5 1 1.5 2 2.5 Normalised events / 0.2 0 0.01 0.02 0.03 0.04 0.05 0.06 Z→ττ MC Embedded MC (w/ corr) Embedded MC (w/out corr) Emb. Uncertainty ATLAS Simulation ) l ( η -2.5 -2 -1.5 -1 -0.5 0 0.5 1 1.5 2 2.5 Emb./MC 0.8 0.9 1 1.1 1.2 (a)) [GeV]
l
(
Tp
0 10 20 30 40 50 60 70 80 90 100Normalised events / 4 GeV
0 0.05 0.1 0.15 0.2 0.25 0.3 0.35 Z→ττ MC Embedded MC (w/ corr) Embedded MC (w/out corr) Emb. Uncertainty ATLAS Simulation ) [GeV] l ( T p 0 10 20 30 40 50 60 70 80 90 100 Emb./MC 0.8 0.9 1 1.1 1.2 (b)
Figure 9: Comparison of τ-embedded Z → µµ MC events (black points) with Z → ττ MC events (blue) for (a) the pseudorapidity and (b) the transverse momentum of the τ decay lepton, each including ratios showing the relative differences of the τ-embedded distributions. In addition, the red squares show the distributions obtained from the τ-embedded MC sample before applying the embedding-specific corrections. The blue error band in the ratio plots corresponds to the statistical uncertainties of the Z → ττ MC sample. The black error bars are the statistical uncertainties associated with the corrected τ-embedded events. The light (dark) grey hatched error band corresponds to the sum in quadrature of cell+ isolation (cell only) systematic uncertainties and the statistical uncertainties of the corrected τ-embedded events.
deposited within∆R< 0.1 and ∆R< 0.2 around the τ candidate direction, and the leading-track momentum fraction, i.e. the transverse momentum of the highest-pT charged particle divided by the calorimetric transverse energy within∆R< 0.2 [25]. Agreement of the distributions within statistical and embedding-related systematic uncertainties indicates that the detector response to embedded τ leptons does not differ significantly from the standard Z → ττ MC samples. This is further confirmed by the fact that the τ identification efficiency is found to agree for τ-embedded and standard MC samples for all working points defined in Ref. [25] within uncertainties. Agreement is also observed for the kinematics of the Z decay products, as demonstrated for the τhad pTand mvisττ in Figures10(c)and10(d).
Figures11(a)and11(b)compare the distributions of the missing transverse momentum, arising from the simulated τ decay neutrinos and reconstruction effects, and of mMMCττ . Again, no significant differences are observed and the same conclusions are reached for jet-related quantities, such as the leading-jet pT and the pseudorapidity separation of the two leading jets shown in Figures11(c)and11(d).
Thus, the τ-embedded Z → µµ MC events and standard Z → ττ MC events are found to agree in all distributions identified to be relevant for physics analyses within the statistical and embedding-related systematic uncertainties described in Section4.3. These comparisons include effects from the modifica-tion of the input muon kinematics due to final-state radiamodifica-tion and resolumodifica-tion and thus confirm that such effects are also covered by the current τ-embedding uncertainties.
cent
f
0.3 0.4 0.5 0.6 0.7 0.8 0.9 1 1.1 Normalised events / 0.04 0 0.02 0.04 0.06 0.08 0.1 0.12 0.14 0.16 0.18 Z→ττ MC Embedded MC Emb. Uncertainty ATLAS Simulation cent f 0.3 0.4 0.5 0.6 0.7 0.8 0.9 1 1.1 Emb./MC 0.8 0.9 1 1.1 1.2 (a) trackf
0 0.2 0.4 0.6 0.8 1 1.2 1.4 1.6 1.8 2 Normalised events / 0.1 0 0.02 0.04 0.06 0.08 0.1 0.12 0.14 0.16 0.18 0.2 0.22 τ τ → Z MC Embedded MC Emb. Uncertainty ATLAS Simulation track f 0 0.2 0.4 0.6 0.8 1 1.2 1.4 1.6 1.8 2 Emb./MC 0.8 0.9 1 1.1 1.2 (b)) [GeV]
hadτ
(
Tp
0 10 20 30 40 50 60 70 80 90 100Normalised events / 4 GeV
0 0.02 0.04 0.06 0.08 0.1 0.12 0.14 0.16 0.18 0.2 0.22 Z→ττ MC Embedded MC Emb. Uncertainty ATLAS Simulation ) [GeV] had τ ( T p 0 10 20 30 40 50 60 70 80 90 100 Emb./MC 0.8 0.9 1 1.1 1.2 (c)
[GeV]
vis τ τm
20 30 40 50 60 70 80 90 100 110 120Normalised events / 4 GeV
0 0.02 0.04 0.06 0.08 0.1 0.12 0.14 0.16 Z→ττ MC Embedded MC Emb. Uncertainty ATLAS Simulation [GeV] vis τ τ m 20 30 40 50 60 70 80 90 100 110 120 Emb./MC 0.8 0.9 1 1.1 1.2 (d)
Figure 10: Comparison of τ-embedded Z → µµ MC events (black points) with Z → ττ MC events (blue): (a) central energy fraction, (b) leading-track momentum fraction for three-prong hadronic τ decays, (c) τhadtransverse
momentum and (d) mass of the visible ττ decay products, each including ratios showing the relative differences of the τ-embedded distributions. The blue error band in the ratio plots corresponds to the statistical uncertainties of the Z → ττ MC sample, and the black error bars are the statistical uncertainties associated with the τ-embedded events. The light (dark) grey hatched error band corresponds to the sum in quadrature of cell+ isolation (cell only) systematic uncertainties and the statistical uncertainties of the τ-embedded events.
[GeV]
miss T
E
0 10 20 30 40 50 60 70 80
Normalised events / 4 GeV
0 0.02 0.04 0.06 0.08 0.1 0.12 0.14 0.16 0.18 0.2 0.22 τ τ → Z MC Embedded MC Emb. Uncertainty ATLAS Simulation [GeV] miss T E 0 10 20 30 40 50 60 70 80 Emb./MC 0.8 0.9 1 1.1 1.2 (a)
[GeV]
MMC τ τm
60 70 80 90 100 110 120 130 140 150 160Normalised events / 4 GeV
0 0.02 0.04 0.06 0.08 0.1 0.12 Z→ττ MC Embedded MC Emb. Uncertainty ATLAS Simulation [GeV] MMC τ τ m 60 70 80 90 100 110 120 130 140 150 160 Emb./MC 0.8 0.9 1 1.1 1.2 (b)
(leading jet) [GeV]
T
p
0 50 100 150 200 250 300
Normalised events / 15 GeV
0 0.05 0.1 0.15 0.2 0.25 0.3 0.35 0.4 Z→ττ MC Embedded MC Emb. Uncertainty ATLAS Simulation
(leading jet) [GeV]
T p 0 50 100 150 200 250 300 Emb./MC 0.8 0.9 1 1.1 1.2 (c)
)
2,j
1(j
η
∆
0 1 2 3 4 5 6 7 8 Normalised events / 0.4 0 0.02 0.04 0.06 0.08 0.1 0.12 0.14 0.16 0.18 0.2 τ τ → Z MC Embedded MC Emb. Uncertainty ATLAS Simulation ) 2 ,j 1 (j η ∆ 0 1 2 3 4 5 6 7 8 Emb./MC 0.8 0.9 1 1.1 1.2 (d)Figure 11: Comparison of τ-embedded Z → µµ MC events (black points) with Z → ττ MC events (blue): (a) missing transverse momentum, (b) ττ invariant mass obtained with the MMC, (c) transverse momentum of the leading jet and (d) pseudorapidity difference for the two leading jets, each including ratios showing the relative differences of the τ-embedded distributions. The blue error band in the ratio plots corresponds to the statistical uncertainties of the Z → ττ MC sample, and the black error bars are the statistical uncertainties associated with the τ-embedded events. The light (dark) grey hatched error band corresponds to the sum in quadrature of cell+ isolation (cell only) systematic uncertainties and the statistical uncertainties of the τ-embedded events.
Performance within physics analyses
In a final step, the τ-embedded Z → µµ collision data events are used as part of a combined background model and compared to data in the boosted Z-enriched control region defined in Section 3.2. Due to
) [GeV] had τ ( T p 10 20 30 40 50 60 70 80 90 100110 Events / 5 GeV 0 200 400 600 800 1000 1200 1400 1600 Data embedding τ τ → Z <40 GeV) τ τ MC (m τ τ → * γ / Z Others Uncert. -1 20.3 fb = 8 TeV, s Boosted τ τ ATLAS τ τ → Z Control Region ) [GeV] had τ ( T p 10 20 30 40 50 60 70 80 90 100 110 Data/Model 0.60.8 1 1.2 1.4 (a) [GeV] vis. τ τ m 20 40 60 80 100 120 Events / 4 GeV 0 100 200 300 400 500 600 700 800 Data embedding τ τ → Z <40 GeV) τ τ MC (m τ τ → * γ / Z Others Uncert. -1 20.3 fb = 8 TeV, s Boosted τ τ ATLAS τ τ → Z Control Region [GeV] vis. τ τ m 20 40 60 80 100 120 Data/Model 0.60.8 1 1.2 1.4 (b) [GeV] miss T E 0 20 40 60 80 100 120 140 160 Events / 5 GeV 0 100 200 300 400 500 Data embedding τ τ → Z <40 GeV) τ τ MC (m τ τ → * γ / Z Others Uncert. -1 20.3 fb = 8 TeV, s Boosted τ τ ATLAS τ τ → Z Control Region [GeV] miss T E 0 20 40 60 80 100 120 140 160 Data/Model 0.60.8 1 1.2 1.4 (c) [GeV] τ τ MMC m 20 40 60 80 100 120 Events / 4 GeV 0 100 200 300 400 500 600 700 800 900 Data embedding τ τ → Z <40 GeV) τ τ MC (m τ τ → * γ / Z Others Uncert. -1 20.3 fb = 8 TeV, s Boosted τ τ ATLAS τ τ → Z Control Region [GeV] τ τ MMC m 20 40 60 80 100 120 Data/Model 0.60.8 1 1.2 1.4 (d)
Figure 12: Comparison of data with the combined background model for example observables in the boosted Z-enriched control region: (a) τhad transverse momentum, (b) invariant mass of the visible ττ decay products
(c) missing transverse momentum and (d) the ττ invariant mass obtained with the MMC, each including ratios showing the relative differences of the data to the total background estimate. The background contributions from other processes and the systematic uncertainties are estimated as described in Ref. [1].
significant contributions from other background processes, this is not a clean, stand-alone validation of the embedding method but involves other background estimation procedures, performed exactly as in Ref. [1]. Since the selection of Z → µµ data events used as input for the embedding procedure includes a cut on the invariant mass mµµ > 40 GeV, low mass Drell–Yan processes with ττ final states are not modelled via the embedding technique. Instead, these contributions are separately estimated from simulated event samples. A few example comparisons are given in Figures12and13. In those distributions the embedded samples are normalised to data in a dedicated region as described in Ref. [1]. The combined background distributions, dominated by the embedding-based Z → ττ model, are found to provide a good description of the ATLAS data within the uncertainties, which here also include other relevant uncertainties related to the estimation of the other background contributions as described in Ref. [1].
(Z) [GeV] T p 50 100 150 200 250 300 Events / 10 GeV 0 200 400 600 800 1000 1200 1400 Data embedding τ τ → Z <40 GeV) τ τ MC (m τ τ → * γ / Z Others Uncert. -1 20.3 fb = 8 TeV, s Boosted τ τ ATLAS τ τ → Z Control Region (Z) [GeV] T p 50 100 150 200 250 300 Data/Model 0.60.8 1 1.2 1.4 (a)
(leading jet) [GeV]
T p 0 20 40 60 80 100120140160180200220 Events / 10 GeV 0 100 200 300 400 500 600 700 800 900 Data embedding τ τ → Z <40 GeV) τ τ MC (m τ τ → * γ / Z Others Uncert. -1 20.3 fb = 8 TeV, s Boosted τ τ ATLAS τ τ → Z Control Region
(leading jet) [GeV]
T p 0 20 40 60 80 100 120 140 160 180 200 220 Data/Model 0.60.8 1 1.2 1.4 (b)
Figure 13: Comparison of data with the combined background model for example observables in the boosted Z-enriched control region: transverse momentum of (a) the Z boson and (b) the leading jet, each including ratios showing the relative differences of the data to the total background estimate. The background contributions from other processes and the systematic uncertainties are estimated as described in Ref. [1].
6 Summary and conclusions
This paper presented the motivation, concept and technical implementation of a τ-embedding method, which models events with Z → ττ decays and possibly additional jets in a largely data-driven way. In Z → µµ events selected from pp collision data recorded with the ATLAS experiment during the LHC Run1, tracks and calorimeter cell energies associated with the Z decay muons are replaced by the corresponding tracks and energy depositions of the τ leptons from simulated Z → ττ decays. For each event, the τ kinematics are derived from the original Z → µµ decay, so that their correlations with other event properties such as additional jets and the reconstructed missing transverse momentum are
preserved in the resulting hybrid Z → ττ events. Systematic uncertainties are estimated by varying the muon isolation requirement and the subtracted energy depositions associated with the muons. Extensive validation studies were performed using both the µµ and ττ final states, presented here only for the example where one τ lepton decays into an electron or muon and the other hadronically. The µµ-based results demonstrate that the procedure successfully replaces objects in the data events without affecting other event properties. Comparing τ-embedded Z → µµ MC events with standard Z → ττ MC, agreement was found for distributions of all quantities relevant to current physics analyses within the combined statistical and embedding-related systematic uncertainties. Other conceptual limitations of the method related to the input of reconstructed muon kinematics are found to introduce only small effects compared to the uncertainties estimated from variations of the method. For Higgs analyses in ττ final states, which exploit intricate signatures of additional jets and their correlation with the ττ decay kinematics, the τ-embedded data thus provide a reliable model of the irreducible background from events with Z → ττ decays and jets.
Acknowledgements
We thank CERN for the very successful operation of the LHC, as well as the support staff from our institutions without whom ATLAS could not be operated efficiently.
We acknowledge the support of ANPCyT, Argentina; YerPhI, Armenia; ARC, Australia; BMWFW and FWF, Austria; ANAS, Azerbaijan; SSTC, Belarus; CNPq and FAPESP, Brazil; NSERC, NRC and CFI, Canada; CERN; CONICYT, Chile; CAS, MOST and NSFC, China; COLCIENCIAS, Colombia; MSMT CR, MPO CR and VSC CR, Czech Republic; DNRF, DNSRC and Lundbeck Foundation, Denmark; EPLANET, ERC and NSRF, European Union; IN2P3-CNRS, CEA-DSM/IRFU, France; GNSF, Geor-gia; BMBF, DFG, HGF, MPG and AvH Foundation, Germany; GSRT and NSRF, Greece; RGC, Hong Kong SAR, China; ISF, MINERVA, GIF, I-CORE and Benoziyo Center, Israel; INFN, Italy; MEXT and JSPS, Japan; CNRST, Morocco; FOM and NWO, Netherlands; BRF and RCN, Norway; MNiSW and NCN, Poland; GRICES and FCT, Portugal; MNE/IFA, Romania; MES of Russia and NRC KI, Rus-sian Federation; JINR; MSTD, Serbia; MSSR, Slovakia; ARRS and MIZŠ, Slovenia; DST/NRF, South Africa; MINECO, Spain; SRC and Wallenberg Foundation, Sweden; SER, SNSF and Cantons of Bern and Geneva, Switzerland; NSC, Taiwan; TAEK, Turkey; STFC, the Royal Society and Leverhulme Trust, United Kingdom; DOE and NSF, United States of America.
The crucial computing support from all WLCG partners is acknowledged gratefully, in particular from CERN and the ATLAS Tier-1 facilities at TRIUMF (Canada), NDGF (Denmark, Norway, Sweden), CC-IN2P3 (France), KIT/GridKA (Germany), INFN-CNAF (Italy), NL-T1 (Netherlands), PIC (Spain), ASGC (Taiwan), RAL (UK) and BNL (USA) and in the Tier-2 facilities worldwide.
References
[1] ATLAS Collaboration,
Evidence for the Higgs-boson Yukawa coupling to tau leptons with the ATLAS detector, JHEP 04 (2015) 117, arXiv:1501.04943 [hep-ex].
[2] ATLAS Collaboration, Measurement of the production cross section of jets in association with a Z boson in pp collisions at √s= 7 TeV with the ATLAS detector, JHEP 07 (2013) 032,
arXiv:1304.7098 [hep-ex].
[3] ATLAS Collaboration, Measurement of the Z/γ∗boson transverse momentum distribution in pp collisions at √s= 7 TeV with the ATLAS detector, JHEP 09 (2014) 145,
arXiv:1406.3660 [hep-ex].
[4] ATLAS Collaboration, Measurement of the electroweak production of dijets in association with a Z-boson and distributions sensitive to vector boson fusion in proton-proton collisions at
√
s= 8 TeV using the ATLAS detector, JHEP 04 (2014) 031, arXiv:1401.7610 [hep-ex]. [5] ATLAS Collaboration, Search for neutral MSSM Higgs bosons decaying to τ+τ−pairs in
proton-proton collisions at √s= 7 TeV with the ATLAS detector, Phys. Lett. B 705 (2011) 174–192, arXiv:1107.5003 [hep-ex].
[6] ATLAS Collaboration, Search for the Standard Model Higgs boson in the H → τ+τ−decay mode in √s= 7 TeV pp collisions with ATLAS, JHEP 09 (2012) 070, arXiv:1206.5971 [hep-ex]. [7] ATLAS Collaboration, Search for the neutral Higgs bosons of the Minimal Supersymmetric
Standard Model in pp collisions at √s= 7 TeV with the ATLAS detector, JHEP 02 (2013) 095, arXiv:1211.6956 [hep-ex].
[8] ATLAS Collaboration, Search for neutral Higgs bosons of the minimal supersymmetric standard model in pp collisions at √s= 8 TeV with the ATLAS detector, JHEP 11 (2014) 056,
arXiv:1409.6064 [hep-ex].
[9] CMS Collaboration, Evidence for the 125 GeV Higgs boson decaying to a pair of τ leptons, JHEP 05 (2014) 104, arXiv:1401.5041 [hep-ex].
[10] CMS Collaboration,
Search for neutral Higgs bosons decaying toτ pairs in pp collisions at √s= 7 TeV, Phys. Lett. B 713 (2012) 68–90, arXiv:1202.4083 [hep-ex].
[11] ATLAS Collaboration, Measurement of the W → τντCross Section in pp Collisions at √
s= 7 TeV with the ATLAS experiment, Phys. Lett. B 706 (2012) 276–294, arXiv:1108.4101 [hep-ex].
[12] ATLAS Collaboration, Search for charged Higgs bosons decaying via H+→τν in top quark pair events using pp collision data at √s= 7 TeV with the ATLAS detector, JHEP 06 (2012) 039, arXiv:1204.2760 [hep-ex].
[13] ATLAS Collaboration, Search for charged Higgs bosons decaying via H±→τ±ν in fully hadronic final states using pp collision data at √s= 8 TeV with the ATLAS detector, JHEP 03 (2015) 088, arXiv:1412.6663 [hep-ex].
[14] ATLAS Collaboration, The ATLAS Experiment at the CERN Large Hadron Collider, JINST 3 (2008) S08003.
[15] ATLAS Collaboration, Performance of the ATLAS Trigger System in 2010, Eur. Phys. J. C 72 (2012) 1849, arXiv:1110.1530 [hep-ex].
[16] ATLAS Collaboration, Measurement of the muon reconstruction performance of the ATLAS detector using 2011 and 2012 LHC proton-proton collision data, Eur. Phys. J. C 74 (2014) 3130, arXiv:1407.3935 [hep-ex].
[17] ATLAS Collaboration, Electron reconstruction and identification efficiency measurements with the ATLAS detector using the 2011 LHC proton-proton collision data,
Eur. Phys. J. C 74 (2014) 2941, arXiv:1404.2240 [hep-ex].
[18] M. Cacciari, G. P. Salam and G. Soyez, The anti-ktjet clustering algorithm, JHEP 04 (2008) 063, arXiv:0802.1189 [hep-ph].
[19] M. Cacciari and G. P. Salam, Dispelling the N3myth for the ktjet-finder, Phys. Lett. B 641 (2006) 57, arXiv:hep-ph/0512210.
[20] W. Lampl et al., Calorimeter Clustering Algorithms: Description and Performance, ATL-LARG-PUB-2008-002, 2008, url:http://cds.cern.ch/record/1099735.
[21] M. Cacciari and G. P. Salam, Pileup subtraction using jet areas, Phys. Lett. B 659 (2008) 119, arXiv:0707.1378 [hep-ph].
[22] ATLAS Collaboration,
Jet energy measurement with the ATLAS detector in proton-proton collisions at √s= 7 TeV, Eur. Phys. J. C 73 (2013) 2304, arXiv:1112.6426 [hep-ex].
[23] ATLAS Collaboration, Jet energy measurement and its systematic uncertainty in proton-proton collisions at √s= 7 TeV with the ATLAS detector, Eur. Phys. J. C 75 (2015) 17,
arXiv:1406.0076 [hep-ex].
[24] ATLAS Collaboration, Single hadron response measurement and calorimeter jet energy scale uncertainty with the ATLAS detector at the LHC, Eur. Phys. J. C 73 (2013) 2305,
arXiv:1203.1302 [hep-ex].
[25] ATLAS Collaboration, Identification and energy calibration of hadronically decaying tau leptons with the ATLAS experiment in pp collisions at √s= 8 TeV, Eur. Phys. J. C 75 (2015) 303, arXiv:1412.7086 [hep-ex].
[26] ATLAS Collaboration, Performance of Missing Transverse Momentum Reconstruction in Proton-Proton Collisions at 7 TeV with ATLAS, Eur. Phys. J. C 72 () 1844.
[27] ATLAS Collaboration, Performance of Missing Transverse Momentum Reconstruction in ATLAS studied in Proton-Proton Collisions recorded in 2012 at 8 TeV,ATLAS-CONF-2013-082, 2013, url:http://cds.cern.ch/record/1570993.
[28] M. Mangano et al., ALPGEN, a generator for hard multiparton processes in hadronic collisions, JHEP 07 (2003) 001, arXiv:hep-ph/0206293.
[29] M. Mangano et al., Multijet matrix elements and shower evolution in hadronic collisions: Wb¯b+ n jets as a case study, Nucl. Phys. B 632 (2002) 343, arXiv:hep-ph/0108069.
[30] J. Pumplin et al.,
New generation of parton distributions with uncertainties from global QCD analysis, JHEP 07 (2002) 012, arXiv:hep-ph/0201195.
[31] T. Sjostrand, S. Mrenna and P. Z. Skands, A brief introduction to PYTHIA 8.1, Comput. Phys. Commun. 178 (2008) 852, arXiv:0710.3820 [hep-ph].
[32] ATLAS Collaboration, The ATLAS Simulation Infrastructure, Eur. Phys. J. C 70 (2010) 823, arXiv:1005.4568 [hep-ex].
[33] GEANT4 Collaboration, GEANT4– A Simulation toolkit, Nucl. Instrum. Meth. A 506 (2003) 250. [34] ATLAS Collaboration, Summary of ATLAS PYTHIA 8 tunes,ATL-PHYS-PUB-2012-003, 2012,
url:http://cds.cern.ch/record/1474107.
[35] S. Jadach and Z. Was, The tau decay library Tauola: Version 2.4, Comput. Phys. Commun. 76 (1993) 361.
[36] N. Davidson, T. Przedzinski and Z. Was,
PHOTOS Interface in C++: Technical and Physics Documentation (2010), arXiv:1011.0937 [hep-ph].
[37] A. Elagin et al., A New Mass Reconstruction Technique for Resonances Decaying to di-tau, Nucl. Instrum. Meth. A 654 (2011) 481–489, arXiv:1012.4686 [hep-ex].
[38] Z. Czyczula, T. Przedzinski and Z. Was,
TauSpinner Program for Studies on Spin Effect in τ Production at the LHC, Eur. Phys. J. C 72 (2012) 1988, arXiv:1201.0117 [hep-ph].
[39] A. Kaczmarska et al., Application of TauSpinner for studies on τ-lepton polarization and spin correlations in Z, W and H decays at LHC, Acta Phys. Polon. B 45 (2014) 1921,