1
Effect of Fuzzy Partitioning in Crohn’s Disease Classification: A Neuro-fuzzy
based Approach
Sk. Saddam Ahmed1, Nilanjan Dey2, Amira S. Ashour3, Dimitra Sifaki-Pistolla4, Dana Bălas-Timar5,
Valentina E. Balas6, João Manuel R. S. Tavares7 1Dept. of CSE, JIS College of Engineering, Kalyani, West Bengal, INDIA. Email: sksaddamahmed@gmail.com
2Department of Information Technology, Techno India College of Technology, Kolkata, INDIA. Email: neelanjan.dey@gmail.com
3Dept. of Electronics & Electrical Communications Engineering, Faculty of Engineering, Tanta Univ., EGYPT. College of Computers & IT, Taif University, KSA. Email: amirasashour@yahoo.com
4 Clinic of Social and Family Medicine, Faculty of Medicine, University of Crete. GREECE. E-mail:spdimi11@gmail.com
5Faculty of Educational Sciences, Psychology and Social Sciences, Aurel Vlaicu University of Arad, ROMANIA. Email: dana@xhouse.ro
6Faculty of Engineering Aurel Vlaicu University of Arad, ROMANIA. Email: balas@drbalas.ro
7Instituto de Ciência e Inovação em Engenharia Mecânica e Engenharia Industrial, Departamento de Engenharia Mecânica, Faculdade de Engenharia, Universidade do Porto, Rua Dr. Roberto Frias, s/n, 4200-465 Porto, PORTUGAL. Email: tavares@fe.up.pt
Abstract:
Crohn’s disease (CD) diagnosis is a tremendously serious health problem due to its ultimatelyeffect on the gastrointestinal tract (GI) that leads to the need of complex medical assistance. In this study, the Back propagation neural network-fuzzy classifier and a neuro-fuzzy model are combined for diagnosing the CD. Factor analysis (FA) is used for data dimension reduction. The effect on the system performance has been investigated when using fuzzy partitioning and dimension reduction. Additionally, further comparison is done between the different levels of the fuzzy partition to reach the optimal performance accuracy level. The performance evaluation of the proposed system is estimated using the classification accuracy and other metrics. The experimental results revealed that the classification with level-8 partitioning provides a classification accuracy of 97.67%, with a sensitivity and specificity of 96.07% and 100%, respectively.
Keywords:
Genome Sequencing, Factor analysis, Back propagation neural network, Neuro-fuzzy,Classification.
1 Introduction
Image classification, pattern recognition and database analysis of medical data are the most reliable ways to assist physicians and achieve accurate diagnostics. Image classification is an important step in Computer Aided Diagnosis (CAD). Research in CAD systems is a rapidly developed domain with constantly new imaging modalities and applications. Two of the most common objectives of the CAD systems is to locate the object of interest, such as a lesion and estimate the probability of a disease. Furthermore, image classification is the most important process implicated in the automatic CAD approach. This is the phase when features are extracted and the objects under interest are categorized into classes, e.g. into normal or abnormal. Recent studies deal with artificial intelligence techniques rather than with the conventional classifiers. This is due to the fact that artificial intelligence techniques have a very high classification accuracy and adaptive nature. Thus, automatic medical image classification has become a progressive area of research that facilitates the automatic diagnosis of various diseases [54].
2
Crohn’s Disease (CD) is considered to be one of the most frequent clinical outcomes in modern epidemics. During the last 60 years, this apparently rare intestinal condition seems to increase rapidly [15, 53]. The CD became extremely widespread in 1950s and emerged as a major gastrointestinal problem with a current estimate of 20,000 cases in the Great Britain [24, 42]. This disease recurrently affects young people shortly after their puberty and lasts throughout their lives. Therefore, it has major implications for every individual patient and those who are involved in their management [14, 35]. Empirical and not curative treatments are usually recommended and are mostly based on the use of both steroids and surgical resection that carry a significant morbidity and mortality [34, 41, 52].
To date, CD is considered one of the heterogeneous entities and chronic syndrome disease. CD is a kind of an inflammatory bowel disease (IBD) that has enormous severe symptoms and affects any part of the gastrointestinal tract (GI) [4, 49]. Obstruction in Bowel due to CD has an enormous risk of bowel cancer [11]. It results in IBD in which the immune system of the body attacks the entire GI directed by microbial antigens [7,13, 36, 40, 56]. No medication or surgery procedure can completely cure the CD. However, effective diagnosis may lead to maintain remission and prevent relapse. Nowadays, colonoscopy is recommended to check the condition of the bowel every few years. CD diagnosis is commonly based on biopsy for medical imaging.
Prior to medical imaging steps Multivariate analysis (MA) become essential to analyze the multiple independent variables with multiple dependent variables within the medical data. One of the MA is the factor analysis, which refers to a set of analytical techniques proposed to reduce data into smaller significant groups based upon their shared variance or inter-correlations to provide better explanation of the data. Since, preceding attempts of CD classification has been mainly based on the anatomic location and the disease behavior. However, no standard definition of the patient subgroups has been established yet. Thus, MA such as factor analysis can be used before the CD classification process. Such classification can be done using the artificial neural networks (ANNs), fuzzy systems or an integrated combination of these. Recent studies use the ANN-based techniques rather than conventional classifiers that have very high classification accuracy and adaptive nature. While, the use of the fuzzy logic approach in diagnostic science is a robust method to deal with imprecise data, which requires an adequate expert knowledge in the rule base formulation and the combination of the sets and the defuzzification. Generally, ANNs can be used to classify data without indicating how the patterns are recognized. However, fuzzy systems are more reliable for computing and explaining decisions by excluding adaptive changes to allow new environmental conditions. Consequently, a combination of these two approaches interweaves their benefits together to be fully exploited. The application of neuro-fuzzy systems in data detection and classification of medical images is an interesting field for further research. In particular, classification techniques are essensial for the application of neuro-fuzzy systems to assess medical outcomes. Fuzzy set theory has an essential role in dealing with uncertainty about decision-making in medicine and patient management [33]. Neuro-fuzzy systems are mainly fuzzy systems that use the ANNs theory to facilitate the determination of the fuzzy sets/ rules by processing data samples. A neuro-fuzzy approach as a combination of ANNs and neuro-fuzzy logic has been considered to overcome the individual weaknesses and to propose more interesting features. This exploits the learning capabilities using the ANN and the descriptive power of systems using the Fuzzy logic. Thus, results of this combined methodological approach are expected to have high interpretability and satisfying accuracy [6, 8]. Typically, this approach ultimately leads to a system that can recognize and classify the abnormalities in the biomedical images and assists physicians in the diagnostic procedures.
Consequently, the main contribution of the current study can be pointed as follows:
1- Combine the Back propagation neural network-fuzzy classifier and a neuro-fuzzy model for diagnosing the CD.
3
3- Use the fuzzy partitioning and dimension reduction to study the effect on the system performance.
4- Compare between the different levels of the fuzzy partition to reach the optimal performance accuracy level.
5- Evaluate the performance of the proposed system using the classification accuracy and other metrics.
The current work emphasized on the classification of CD medical images using neuro-fuzzy automated classification. The aim of the neuro-fuzzy approach is to extract features to classify them.
The structure of the remaining sections is as follows. Section 2 introduced the literature review of various related work. The methodology is presented in section 3, and the use of the proposed system is addressed in section 4. Then, in section 5, the results and discussion are given. Finally, the conclusion is presented in section 6.
2 Related Work
Research findings in the literature suggest that CD is one of the most frequent diseases in North America and northern Europe; currently emerging in southern Europe and less frequent in other regions of the world. Studies from different parts of the world support that CD prevalence is higher in urban rather than in rural areas.
Maglinte et al. 2003 [38] reviewed the imaging features that support patient classification into clinical sub-types of CD. Through this review, a study indicated that radiologic features on barium studies were closely correlated with the CD Activity Index. As per our knowledge, no more work has been done in this domain. Thus, further research has to be done in this domain to find the most effective classification method and employ it in the proposed system.
Model-based decision-support tools/intelligent analysis is imperative in the medical imaging for computer-assisted diagnosis and evaluation. In [47], a novel scheme was proposed to combine a neural network based auto-associator for the classification of breast cancer patterns. The results were proved to be extremely acceptable as obtained a classification accuracy of 85% using 14 image features.
There are several types on the neural network (NN) techniques [20] such as Back Propagation Neural Network (BPNN)[45], General Regression Neural Network (GRNN) [18], Probabilistic Neural Network (PNN) [55] and Radial Basis Function Neural Network (RBFNN) [19]. A comparison of different NN techniques for classification of local prostate neoplasia diseases data sets was conducted in [21]. The experimental results proved that the BPNN network provided a real-valued prediction between 0 and 1. BPNN is a robust model and it can provide competent results in different real problem domains, where it is effective and performs fairly well on most of the medical datasets.
In [2], the principal components analysis (PCA) was applied to identify key features from the Fourier transform and back propagation network is used for classification. A neuro-fuzzy technique was considered a vital approach in image analysis, especially in biomedical applications of training data to resolve medical diagnosis problems [23, 46].
Li and Chi (2005) proved that the Self Organizing Feature Map (SOFM) ANN had superior results in the classification of brain tumor images [37]. Benamrane et al. combined three metaphors: Neural Networks, Fuzzy Logic and Genetic Algorithms in a hybrid system [5]. They used this approach for the detection and specification of anomalies in medical images. The Fuzzy Neural Network detected the expected regions that were interpreted via the Fuzzy Neural Network of specification.
Sang et al. (2007) [25] suggested a new fuzzy c-means (FCM) technique based on parallel ANNs via employing FCM for classifying breast cancer data. The results showed a correct diagnosis rate around
4
99%. Thus, it was found to be practical for classification problems of nonlinear system of high complexity with huge data.
In [30], a classification of endoscopic images using an advanced fuzzy inference neural network that combines fuzzy systems and a Radial Basis Function (RBF) was suggested. The principal of multiple classifier fusion was dedicated to specific feature parameters with a classification accuracy of 94.28%. But the RBF was characterized to have a very fast training rate in comparison to the fuzzy system. This approach, extracted both texture and statistical features.
Joshi
et al. [28] used a conceptually classification approach based on neuro-fuzzy logic to design a brain cancer detection and classification system. Texture features were used for the ANN training. Co-occurrence matrices at different directions were calculated, and the Grey Level Co-Co-occurrence Matrix (GLCM) for the features was extracted from the co-ocurrence matrices. This scheme provided a high precision detection as well as a high classification rate of the Astrocytoma cancer.In Fernandes et al., 2010 [16], an adaptive neuro-fuzzy system for the classification of regions of interest (ROIs) in mammograms as malignant or benign was proposed. The neuro-fuzzy ANFIS model employed in the mammogram ROI’s classification stage achieved a maximum accuracy rate of 99.75%.
3 Methods
Several concepts were used in the solution proposed in this work for the automated classification of the Crohn’s Disease based on neuro-Fuzzy. These concepts are presented as follows.
3.1 Multivariate Data Analysis
Multivariate Data Analysis refers to any statistical technique used to analyze data that arise from more than one variable. Despite the quantum of data available, the ability to obtain a clear expression to build intelligent decision schemes is a challenging. When the available information is stored in database tables containing rows and columns, multivariate analysis can be used to process the information in a meaningful way.
Factor Analysis (FA) is one of these methods that is commonly used to describe variability among observed and correlated variables in terms of a potentially lower number of unobserved variables called factors. It searches for such joint variations in response to unobserved latent variables. The observed variables are modeled as linear combinations of the potential factors, plus the "error" terms. The information gained about the interdependencies between observed variables can be then used to reduce the set of variables in a dataset. This technique is equivalent to a low-rank approximation of the matrix of observed variables and is used in the applied science domains that deals with large quantities of data. The total effect as well as the cumulative effect are obtained from the FA.
Therefore, for CD classification, the input data can be analyzed using FA which is mainly a data reduction technique to reduce the number of data by grouping them. Thus, it provided data reduction and by examining the data content in each group, the structure or composition of each group can be determined thereby giving a better explanation of the data.
3.2 Back propagation neural network
Generally, classification is an imperative process in different applications that can be found in the medical area [31, 43, 44]. As regards the classification methodologies, the back propagation neural network (BPNN) can be considered to be quite essential neural net as it is essentially a learning/training algorithm rather than a separate network by itself [22]. Back propagation networks are ideal for pattern recognition and mapping tasks [1] as it is robust and applied easily in various problem domains. Pattern recognition network [27] is a feedforward network that can be trained to classify inputs along with target classes. The target data consist of vectors of all zero values except for a 1 in element i, where i is the class they are to
5
represent. The built-in Matlab function called ‘patternnet’ was used in the present work create a pattern recognition network
.
The BPNN is generally learned using training datasets, with the network adjusting its weights until the training process is completed and the best set of weight is found.3.2.1. BPN Algorithm
Initially, all the data inputs were applied and corresponding outputs were obtained with the initial weights assuming random values. The error of neuron C is:
ErrorC = OutputC (1-OutputC)(TargetC – OutputC) Next the weight is changed.
Let WAC+ be the new (trained) weight and WAC the old weight, thus: WAC+= WAC + (ErrorCxOutputA).
The errors for the hidden layer of neurons needed to be calculated. After the errors of the hidden layer neuron were obtained, the hidden layer weights were changed. This process was repeated during the training of the network.
The back propagation network has proved to be effective when used for classification in cases of:
i) Due to the large amount of inputs/outputs in the dataset, so the inputs to its output relation are unknown.
ii) The classification problem appeared to have overwhelming complexity, but a clear solution exists.
iii) The solution to the problem may change over time within the bounds of input and output parameters.
3.2.2. Neural network training
Once the network structure has been designed for a particular application,the training phase begins. The initial weights are randomly assigned to start the training process. There are two approaches that are generally used for training a neural network: supervised and unsupervised training. Various BPN training algorithms can be used, the most popular ones are: Bayesian Regularization, BFGS Quasi-Newton, Resilient Back propagation, Scaled Conjugate Gradient (SCG), Conjugate Gradient with Powell/Beale Restarts, Fletcher-Powell Conjugate Gradient, Polak-Ribiére Conjugate Gradient, One Step Secant (OSS), Variable Learning Rate Gradient Descent, Gradient Descent with Momentum, Gradient Descent and Levenberg-Marquardt.
Since, Levenberg-Marquardt (LM) algorithm is the most widely used optimization algorithm and outperforms simple gradient descent as well as other conjugate gradient methods in a wide variety of problems. In the current study, Matlab was extensively using the Neural Network Toolbox™ that supports supervised learning with feedforward networks. An inbuilt network training function ‘trainlm’ was used to update the weight and bias values according to Levenberg-Marquardt optimization. This used function is often the fastest backpropagation algorithm in the toolbox. Castillo et al. [9] revealed that the Levenberg-Marquardt scheme combines both the gradient and the Gauss-Newton approximation of the hessian of the error function. The influence of each term is determined by an adaptive parameter, which is automatically updated. Therefore, in this study the Levenberg-Marquardt algorithm was considered the fastest and applicable for training moderate sized feed forward neural network. It is focused to approach a second order training speed without computing the Hessian matrix. The Hessian function can be approximated by
H = JTJ and its gradient can be computed using g = JTe when the performance function has the form of a
sum of squares, J being the Jacobian matrix and e the vector of network errors. This algorithm is trained and immediately stops when any of these conditions occurs:
The maximum number of epochs is reached;
The maximum amount of time is exceeded;
6
Performance gradient falls below the minimum gradient;
When the adaptive value crosses the maximum limit. 3.3 Fuzzy Model
Fuzzy logic is a multi-valued logic value in the closed interval [0, 1], where 0 (zero) is associated with the classical false value and 1 (one) with the classical true value. Values in (0, 1) indicate varying degrees of truth. Simple fuzzy operations may be defined in numerous ways, but the simplest way as follows:
Given two fuzzy values a and b with the following operations: i. (a and b) = min(a, b);
ii. (a or b) = max(a, b); iii. Not a = 1 – a;
iv. (a implies b) = max(a, 1-b);
3.3.1 Fuzzy Membership Function
Let’s consider a fuzzy set S, where the operator in(
) is given by:(
x s
)
s(x)
(1)Thus, for a fuzzy set S, in will return a value between 0 and 1. The operator “in” returns either true or
false, thus it is no longer a Boolean operator when the right-hand side is a fuzzy set. Generalize the set
operators using the pre-defined operations (and, or ,not , and implies), given two fuzzy sets S and T, the membership functions of
S
T
,S
T
andS
'
are presented as:( ) ( ) ' (S implies T) ( \T)
(x)
(
(x)
(x))
max(
(x),
(x))
(x)
(
(x) and
(x))
min(
(x),
(x))
(x)
not
(x) 1
(x)
(
(x)
(x))
(x)
max(0,
(x)
(x))
S
T iff
(x)
(x) for all
S T s T s T S T s T s T S s s s T S s T s T
or
implies
x
U respectively
(2)3.3.2 Fuzzy Packaging and Partitioning
The Fuzzy Sets package used also includes a number of routines that build fuzzy sets. These routines are referred to as fuzzy set constructors, which are:
, , L, ,
FuzzySet and partition (3)
The function FuzzySet is similar to the piecewise function with the following differences:
1. The form of the calling sequence is
Fuzzyset
(x x , y , x x , y ,..., x x , y )
1 1
2 2
N N , where o may be one of <,= , or <= and the valuesx x
1, ,...,
2x
N must be in order.7
n 1 1
(..., x
x ,f (x), x
nx
n, y ,...)
nFuzzyset
(4) 2. Interpolates the interval
[x , x
n n 1]
with a linear function connecting the points (x
n,f (x )
n n ) and (x
n1, y
n1).The names of the constructors , L, , are chosen because the shape of the letter represents the object being represented:
=generates a fuzzy set for which the membership function is monotonically increasing.
L
= generates a fuzzy set for which the membership function is monotonically decreasing.
= generates a fuzzy set for which the membership function achieves a maximum at a point and decrease to zero on both sides.= generates a fuzzy set for which the membership function achieves a maximum on an interval and decrease to zero on both sides.
4 Proposed Method
The neuro fuzzy-based classification of the CD that has been followed in this study is described below. Additionally, the effects on accuracy using fuzzy partitioning is compared, followed by an application towards problem dimension reduction using fuzzy logic to get optimal classification results.
The image database used is public available from
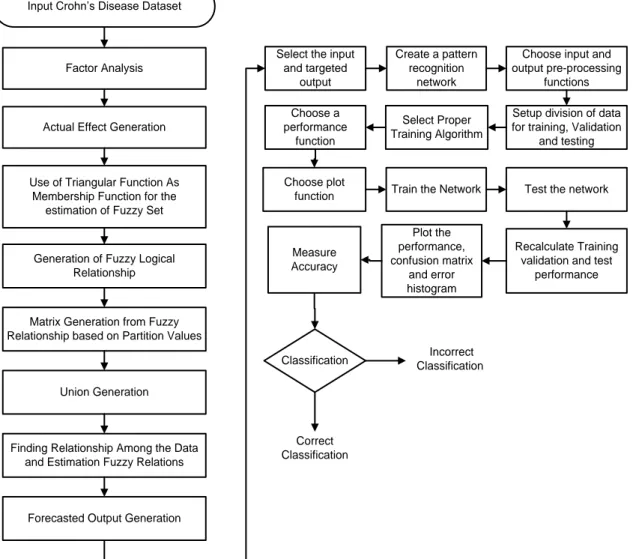
(https://www.stat.auckland.ac.nz/~paul/ItDT/Exercises/Crohns.html) and has genetic sequences of 387 individuals with CD. Both normal and chronic data were included. Out of the 387 individuals, there are 144 individuals that are CD patients (cases) and 243 healthy individuals (controls) .The dataset describes the Genotype for each individual at 103 different locations; the marker 1A indicates the individual’s first allele at locus 1, whereas the marker 1B signifies the individual’s second allele at locus 1 and so on. The proposed neuro-fuzzy classification technique is illustrated in Figure 1. Through the current proposed methodology, a multivariate data analysis using the FA was applied to provide data reduction and to determine better explanation of the data, followed by employing a triangular shape membership function to define the fuzzy sets. Based on the partition values, a matrix generation is performed from the fuzzy relationship. After getting the total effect/cumulative effect of the FA, the fuzzy model has been applied to generate a forecasted output fuzzy value. The forecasted output generation was then used to select the input and targeted output, which used to create a pattern recognition network. These forecasted value finally served as an input to the back propagation neural network with Levenberg-Marquardt algorithm. Then, the data is divided into training, validation and testing sets that used for the classification process.
8
Input Crohn’s Disease Dataset
Use of Triangular Function As Membership Function for the
estimation of Fuzzy Set Factor Analysis
Actual Effect Generation
Generation of Fuzzy Logical Relationship
Matrix Generation from Fuzzy Relationship based on Partition Values
Union Generation
Finding Relationship Among the Data and Estimation Fuzzy Relations
Forecasted Output Generation
Select the input and targeted
output
Create a pattern recognition
network
Choose input and output pre-processing
functions Setup division of data for training, Validation
and testing Choose a performance function Select Proper Training Algorithm Choose plot
function Train the Network Test the network
Recalculate Training validation and test
performance Plot the performance, confusion matrix and error histogram Measure Accuracy Classification Correct Classification Incorrect Classification
Figure 1. Proposed Neuro fuzzy based classification system for CD automated diagnosis 5 Results
Based on the formerly mentioned proposed system steps, the total effect and the cumulative effect obtained from the FA is used in the following steps.
Step 1: In Fuzzy partitioning, a quantitative attribute has been divided into a number of linguistic values
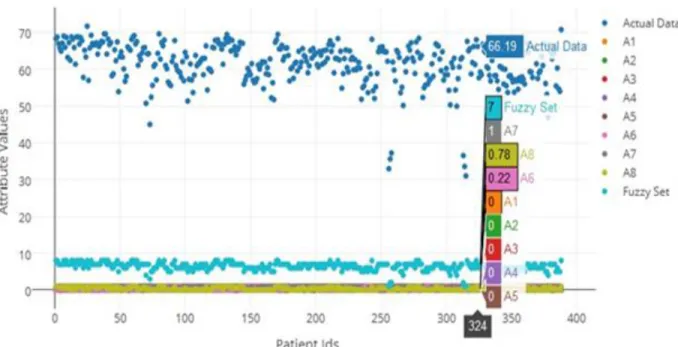
with membership function for the generalization of classical sets. Generally, membership functions (MFs) are the building blocks of fuzzy set theory. Accordingly, the MFs shapes are imperative based on the particular problem under concern. Different literatures [29, 48, 10] were clearly reported that amongst different membership function for the estimation of the fuzzy set, the triangular and trapezoidal shapes are the most used in various engineering domains. Thus, the motivation of using the Triangular shapes membership function in the present work is their simple implement and fast computation. A triangular_function (trimf) as a membership function has been used. The corresponding partitioned fuzzy sets are defined below, and the composition of the fuzzy set defined based on the membership function is illustrated in Figure 2. This figure represents the fuzzy set based on membership function. The actual data indicate the value of the total effect after using the FA. In addition, A1 to A8 points to the partition where the actual data belong as well as other neighboring fractional values that were estimated using the triangular membership functions.
9 Figure 2. Composition of the fuzzy set established based on membership function
Step 2: In this step, all fuzzy logical relationships needed to be stored, i.e. the number of unique conflict
cases in the fuzzy set. A total of 30 unique relationships were found. Table 1, shows the observed unique changes in the fuzzy set variables during the experiment. A total of 30 changes resulted. In Table 1, A2 -> A6 specifies that after A2, a change towards A6 was observed.
Table 1. Fuzzy logical relationships
A1->A1 A5->A5 A7->A3 A1->A2 A5->A6 A7->A4 A1->A8 A5->A7 A7->A5 A2->A1 A5->A8 A7->A6 A2->A2 A6->A5 A7->A7 A2->A6 A6->A6 A7->A8 A3->A5 A6->A7 A8->A5 A4->A6 A6->A8 A8->A6 A4->A7 A7->A1 A8->A7 A5->A4 A7->A2 A8->A8
Step 3: An NXN Sparse matrix was built by transposing and multiplication of the fuzzy logical
relationships. Here, 8 partitions were used, so the starting point of each matrix was given and the remaining elements were set equal to 0. Table 2 presentes the 30 relationship matrices built with the indicated start point of each. The start of each matrix was determined from the fuzzy relationships where the matrices were generated. Considering the case A2 -> A6, so A6 was transposed and multiplied with A2 resulting the 8x8 matrix. The resulted matrix is sparse and its values are in clustered, so the starting point is shown and the remaining elements are equal to zero.
10 Table 2. Matrix of the fuzzy relationships
Matrix 1 Start(1,1) 1 0.552 0.6665 0.3679 Matrix 2 Start(1,1) 0.9 508 1 0.0 492 0.6 337 0.6 665 0.0 328 Matrix 3 Start(1,7) 0.7732 0.9508 0.8132 1 0.04 0.0492 Matrix 4 Start(1,1) 0.9508 0.5248 1 0.552 0.0492 0.0272 Matrix 5 Start(1,1) 0.6 16 0.6 48 0.0 31 0.9 50 1 0.0 49 0.3 3 0.3 5 0.0 17 Matrix 6 Start(2,5) 0.02 32 0. 19 0.16 68 0.12 21 1 0.87 79 0.09 89 0. 81 0.71 11 Matrix 7 Start(3,4) 0.0 593 0.1 14 0.0 547 0.5 202 1 0.4 798 0.4 609 0.8 86 0.4 251 Matrix 8 Start(4,5) 0.0 635 0.5 202 0.4 567 0.1 221 1 0.8 779 0.0 586 0.4 798 0.4 212 Matrix 9 Start(4,6) 0.0 407 0.5 202 0.4 796 0.0 782 1 0.9 218 0.0 375 0.4 798 0.4 423 Matrix 10 Start(4,3) 0.0 911 0.7 989 0.7 078 0.1 14 1 0.8 86 0.0 229 0.2 011 0.1 782 Matrix 11 Start(5,4) 0.1 908 0.3 668 0.1 76 0.5 202 1 0.4 798 0.3 294 0.6 332 0.3 038 Matrix 12 Start(5,5) 0.0 968 0.7 933 0.6 965 0.1 221 1 0.8 779 0.0 252 0.2 067 0.1 815 Matrix 13 Start(5,6) 0.0 095 0.1 221 0.1 125 0.0 782 1 0.9 218 0.0 686 0.8 779 0.8 093 Matrix 14 Start(5,7) 0.0993 0.1221 0.8132 1 0.7139 0.8779 Matrix 15 Start(7,1) 0.3 827 0.7 356 0.3 529 0.5 202 1.0 000 0.4 798 0.1 375 0.2 644 0.1 268 Matrix 16 Start(6,5) 0.0 114 0.0 935 0.0 821 0.1 221 1 0.8 779 0.1 107 0.9 065 0.7 959 Matrix 17 Start(6,6) 0.0 24 0.3 07 0.2 830 0.0 78 1 0.9 218 0.0 542 0.6 930 0.6 388 Matrix 18 Start(5,7) 0.0636 0.0782 0.8132 1 0.7496 0.9218 Matrix 19 Start(6,1) 0.4181 0.2308 1 0.5520 0.5819 0.3212 Matrix 20 Start6,1) 0.3 976 0.4 181 0.0 206 0.9 508 1 0.0 492 0.5 532 0.5 819 0.0 286 Matrix 21 Start(6,2) 0.1 082 0.5 697 0.4 615 0.1 9 1 0.8 1 0.0 818 0.4 303 0.3 485 Matrix 22 Start(6,3) 0.0 669 0.5 869 0.5 2 0.1 140 1 0.8 860 0.0 471 0.4 131 0.3 360 Matrix 23 Start(7,4) 0.4 414 0.8 485 0.4 071 0.5 202 1 0.4 798 Matrix 24 Start(7,5) 0.0 885 0.7 246 0.6 361 0.1 221 1 0.8 779 Matrix 25 Start(6,6) 0.0 540 0.6 904 0.6 364 0.0 782 1 0.9 218 Matrix 26 Start(7,7) 0.5990 0.7366 0.8132 1 Matrix 27 Start(7,4) 0.3 7 0.7 366 0.3 667 0.5 022 1 0.4 978 Matrix 28 Start(7,5) 0.2 354 0.7 366 0.5 013 0.3 195 1 0.6 805 Matrix 29 Start(7,6) 0.3 602 0.7 366 0.3 764 0.4 89 1 0.5 11 Matrix 30 Start(7,7) 0.2629 0.7366 0.3569 1
11 Step 4: From the fuzzy relationship matrices, a Total Union was generated as shown in Table 3. It
consists of eight rows and eight columns, as the table was generated taking the union of all 30 fuzzy relationship matrices (8x8) obtained from the previous table, therefore the resultant union matrix has also 8x8 dimension.
Table 3. Union Generation
1 1 0.05 0 0 0 0.77 0.95 1 1 0.05 0 0.02 0.19 0.81 1 0.33 0.35 0.02 0.059 0.12 1 0.88 0.05 0 0 0.09 0.80 1 0.81 0.71 0.48 0 0 0.11 1 0.89 1 1 0.92 0.42 0.42 0.57 0.59 1 1 1 1 1 1 1 1 1 1 1 1 0.58 0.58 0.43 0.52 1 1 1 1
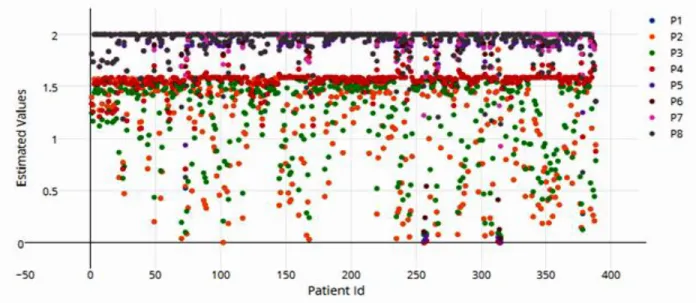
Step 5: The correlations between the original data and the estimating fuzzy relations were then generated.
Figure 3 shows the composition of the fuzzy set established and the estimated correlation between the original data and the fuzzy relations defined.
Figure 3. Correlation found between the original data and fuzzy relations established Step 6: The forecasted output was defined containing the actual data, input fuzzy data, output fuzzy data
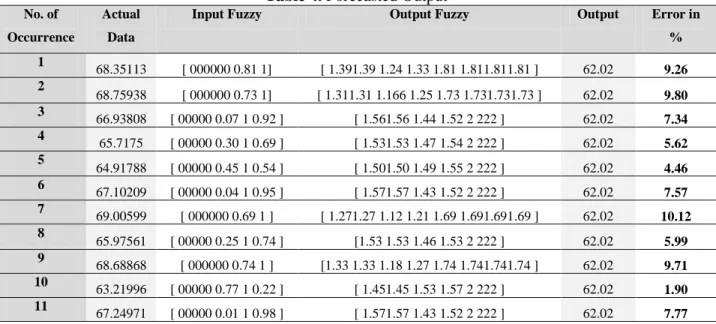
and relative error. Since, the dataset used consists of 387 individual data, thus 388 forecasted outputs were obtained. Only 11 instances were obtained from the 387 occurrences, as indicated in Table 4. The actual data signifies the total effect estimated from the FA and the output indicates the value obtained after the defuzzification process. Though, they were irrelevant during the classification overall process.
12 Table 4. Forecasted Output
No. of Occurrence
Actual Data
Input Fuzzy Output Fuzzy Output Error in % 1 68.35113 [ 000000 0.81 1] [ 1.391.39 1.24 1.33 1.81 1.811.811.81 ] 62.02 9.26 2 68.75938 [ 000000 0.73 1] [ 1.311.31 1.166 1.25 1.73 1.731.731.73 ] 62.02 9.80 3 66.93808 [ 00000 0.07 1 0.92 ] [ 1.561.56 1.44 1.52 2 222 ] 62.02 7.34 4 65.7175 [ 00000 0.30 1 0.69 ] [ 1.531.53 1.47 1.54 2 222 ] 62.02 5.62 5 64.91788 [ 00000 0.45 1 0.54 ] [ 1.501.50 1.49 1.55 2 222 ] 62.02 4.46 6 67.10209 [ 00000 0.04 1 0.95 ] [ 1.571.57 1.43 1.52 2 222 ] 62.02 7.57 7 69.00599 [ 000000 0.69 1 ] [ 1.271.27 1.12 1.21 1.69 1.691.691.69 ] 62.02 10.12 8 65.97561 [ 00000 0.25 1 0.74 ] [1.53 1.53 1.46 1.53 2 222 ] 62.02 5.99 9 68.68868 [ 000000 0.74 1 ] [1.33 1.33 1.18 1.27 1.74 1.741.741.74 ] 62.02 9.71 10 63.21996 [ 00000 0.77 1 0.22 ] [ 1.451.45 1.53 1.57 2 222 ] 62.02 1.90 11 67.24971 [ 00000 0.01 1 0.98 ] [ 1.571.57 1.43 1.52 2 222 ] 62.02 7.77
Step 7: In this step, the back propagation neural network was applied on the estimated fuzzy relationship
data for the CD classification. The performance of the proposed system was assessed using the data in the confusion matrix shown in Figure 4. This matrix contained data regarding the actual and predicted classifications conducted by the proposed system. The entries presented in the matrix are indicated in Table 5.
Table 5. The representation of the confusion matrix entries
Predicted Negative Positive
Actual Negative X Y
Positive Z M
X -the number of correct predictions that an instance is negative; Y -the number of incorrect predictions that an instance is positive; Z -the number of incorrect predictions that an instance is negative; and M -the number of correct predictions that an instance is positive.
13
From Figure 4, it is clear that 96.1% of the CD negative cases were correctly classified as negative. Besides, 100% of the cases were correctly classified as positive CD cases. The overall performance of the classification was equal to 97.7%.
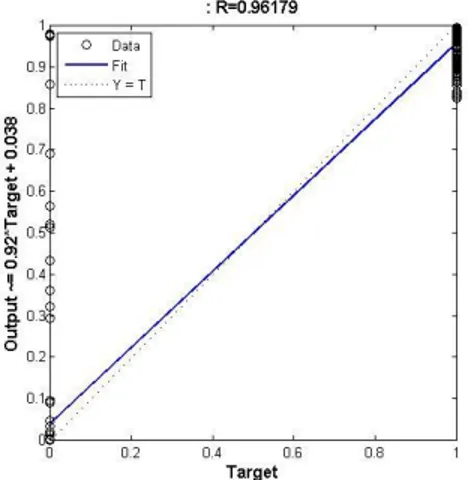
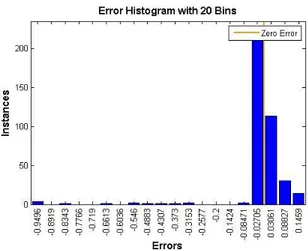
To validate the ANN performance for classification, a regression plot was built as illustrated in Figure 5. This figure displays the relationship between the output of the network and the targets. The plot indicated that the network output and the targets were approximately equal, proving that the training data achieved good fit. The performance function also confirmed the good ability of the trained network, Figure 6. In Figure 6, the number of epochs indicates the iterations at which the validation performance reaches a minimum. The Error histogram built using 20 bins is shown in Figure 7.
Figure 5. Regression plot for the between the network output and the targets
14 Figure 7. Error Histogram using 20 bins
The performance of a classifier is commonly assessed using the receiver operating characteristics (ROC) curve. The ROC assists in measuring the performance of a classifier and its plot denotes the false positive rate on the X axis and the true positive rate on the Y axis. The point (0,1) denotes a perfect classifier. It is commonly used to check the accurate classification of all the positive cases and negative cases. The (0,1) point denotes that the false positive rate is 0 (none case) and the true positive rate is 1 (all case). The (0,0) point denotes a classifier that predicts all the cases to be negative, whereas the point (1,1) corresponds to a classifier that predicts each and every case to be positive. Point (1,0) is for the classifier that represents that it is incorrect for all the classifications. Figure 8, illustrates the ROC curve of the NN classifier used in the proposed system. It is denoted from the figure that the classifier is perfect as it reaches the point(0,1).
Figure 8. The ROC curve for the false positive rate versus the true positive rate 6 Discussion
Typically, several studies used Support vector machine, fuzzy C-mean and classification for proper diagnosis of different diseases [3, 12, 17, 26, 32, 39, 50, 51, 57]. The proppsed system has been concerned with the Crohn’s Disease Classification using Fuzzy Partitioning in the Neuro-fuzzy based Approach. To evaluate the classification results based on the Fuzzy Partition, several metrics were considered to measure the proposed system performance adopting the following notation: true negative (TN), true positive (TP), false positive (FP) and false negative (FN). The used metrics are: i) the accuracy,
15
which is the ratio of the number of correctly classified healthy CD cases of the healthy dataset, ii) the sensitivity, which refers to the probability that the classifier gives a normal CD label for an actual healthy CD dataset, and is computed as TP/(TP+FN), iii) the specificity defined as the evaluation of the probability that the classifier result in an abnormal CD label when used on unhealthy CD dataset and is calculated by TN/(TN+FP), iv) the positive predictive value (PPV) that described as the probability that a patient labeled as normal CD case was correctly diagnosed and given as TP/(TP+FP), and v) the negative predictive value (NPV) that indicates the probability of a patient labeled as case incorrectly diagnosed using the formula TN/(TN+FN).
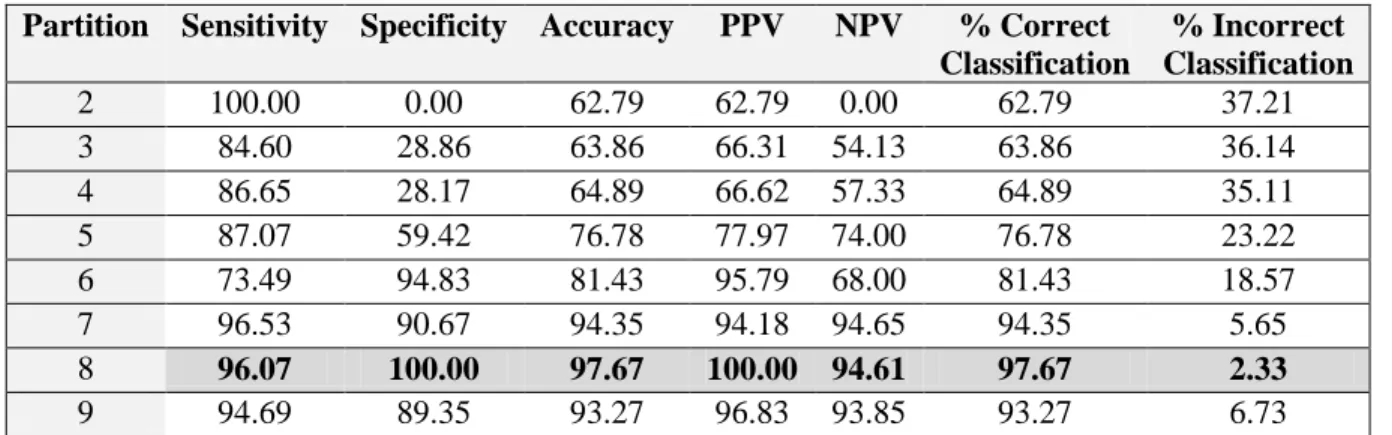
The performance comparison based on a partition is summarized in Table 6. It indicates the estimation of all accuracy checking parameters and the CD classification based on the partitioning process. In this table, the experiment was performed using 2 to 9 partitions and satisfying results were obtained. We could continue doing and experimenting more partition. However, according to the data in Table 6, the result set was prepared with 8 partitions in step 3, as 8 partitions lead to the best classification results.
Table 6. Accuracy comparison based on partition Partition Sensitivity Specificity Accuracy PPV NPV % Correct
Classification % Incorrect Classification 2 100.00 0.00 62.79 62.79 0.00 62.79 37.21 3 84.60 28.86 63.86 66.31 54.13 63.86 36.14 4 86.65 28.17 64.89 66.62 57.33 64.89 35.11 5 87.07 59.42 76.78 77.97 74.00 76.78 23.22 6 73.49 94.83 81.43 95.79 68.00 81.43 18.57 7 96.53 90.67 94.35 94.18 94.65 94.35 5.65 8 96.07 100.00 97.67 100.00 94.61 97.67 2.33 9 94.69 89.35 93.27 96.83 93.85 93.27 6.73
Table 6 provided the variation of metrics, namely the sensitivity, specificity, accuracy, PPV and NPV, based on the partitions. Since, 8 partitions led to the best classification results. Thus, to measure the correctness of the proposed system with 8 partitions, which was used through the experiments as it gives the best performance compared to the other partitions performance, quality metrics were employed as indicated in Table 7.
Table 7. Correctness parameters
Parameter Output in (%) Sensitivity 96.07 Specificity 100 Accuracy 97.67 PPV 100 NPV 94.61
Percentage Correct Classification 97.67%
Percentage Incorrect 2.32%
Execution Time 9.48 seconds
It can be established by the results obtained and described here that after fuzzification and defuzzification processes, comparing the results with the actual total effect, the FA achieved 94.44% of accuracy. Thus, in the experiments to be reported the FA was employed as it provided better results after defuzzification.
16
In addition, the proposed system based on a back propagation neural network with the Levenberg-Marquardt training algorithm and neuro-fuzzy, achieved an accuracy of 97.67% using only 8 partitions. In addition, instead of processing the entire database that has a dimension of 387x206, the system processed a fuzzified reduced matrix of dimension 387x8 making the neural network employed more effective.
Generally, the goals achieved by the current study can be reported as combining the BPNN-fuzzy classifier and a neuro-fuzzy model for diagnosing the CD medical images. The neuro-fuzzy approach is to extract features to classify the CD images after FA that used for data dimension reduction. The experimental results proved that the classification with level-8 partitioning provides a classification accuracy of 97.67%, with a sensitivity and specificity of 96.07% and 100%, respectively.
7 Conclusion
Crohn’s disease is characterized by a range of signs and symptoms, so there is no single test for its diagnosis. Genome based wide association studies has successfully identified susceptibility of loci that can be triggered by environmental factors resulting disturbing innate or intestinal barrier.
The present study, used a multivariate data analysis approach successfully and managed to assess the actual total effect of the data based on the factor analysis. After getting the total-/ cumulative- effect of factor analysis, the neuro-fuzzy based classification was performed. The effect on the accuracy based on fuzzy partitioning was studied. A strict comparison was performed between different levels of fuzzy partition to determine the optimal accuracy level. In the case of classification, instead of feeding the entire dataset to the neural network, the estimated partitioned fuzzified value was fed into the neural network. The results obtained proved that the proposed system with 8 partitions had an accuracy of 97.67% with sensitivity, specificity, positive predictive value and negative predictive value of 96.07%, 100%, 100% and 94.61%, respectively. Therefore, the fuzzy model can be thought of as a process of dimension reduction in the case of classification, as 95.33% reduction dimension is obtained. Another multivariate analysis method will be used in a next study for dimension reduction and compared against the FA.
Authors Biography
Sk Saddam Ahmed received his BSc in Computer Science and MSc in Computer science from West Bengal State University in 2011 and 2013 respectively. He is currently in final semester of M.Tech Computer Science and Engineering under West Bengal University of Technology. His research interests are biomedical image processing, Data mining, Soft computing and Meta heuristic algorithms.
Nilanjan Dey is an Asst. Professor in the Department of Computer Science in Bengal
College of Engineering and Technology, Durgapur, West Bengal, India. He is a PhD scholar of Jadavpur University, Electronics & Telecommunication Engineering Department, Kolkata, India and also holds an honorary position of Visiting Scientist at Global Biomedical Technologies Inc., CA, USA. He is a Research Scientist at Laboratory of Applied Mathematical Modeling in Human Physiology (LAMMHP), Territorial Organization Of- Sgientifig And Engineering Unions, BULGARIA. He is the Editor-in-Chielf of International Journal of Rough Sets and Data Analysis, IGI global, US. Managing Editor of International Journal of Image Mining (IJIM), Inderscience (ISSN 2055-6039) and is the Regional Editor Asia of International Journal of Intelligent Engineering Informatics (IJIEI), Inderscience (ISSN 1758-8723).He is a member of SAI, IE, FOSET, UACEE, ISOC etc.
Amira S. Ashour is an Asst. Professor and Vice Chair of Computer Engineering Department, CIT
college, Taif University, KSA. She was the Vice Chair of the Computers Science Department, Computers and Information Technology College, Taif University, KSA for 5 years. She is Lecturer of Electronics
17
and Electrical Communications Engineering, Faculty of Engineering, Tanta University, Egypt. She got her PhD in Smart Antenna, 2005, Tanta University, Electronics and Electrical Communications Engineering Department, Egypt. Her research interests include: Image Processing, Medical Imaging, Smart Antenna and Adaptive Antenna Arrays. She is Asso. Editor - IJRSDA, IGI Global, US.
Dimitra Sifaki-Pistolla is an epidemiology researcher and GIS expert in the Clinic of
Social and Family Medicine, Faculty of Medicine, University of Crete. She currently works as a project manager and a geospatial analyst in the regional Cancer Registry of Crete, Greece. She is also a research associate in the clinics of Clinical Bacteriology-Parasitology-Zoonoses, Gastroenterology, Pulmanology and Oncology in the University hospital of Crete. She has educational experience in epidemiology and her research interests include: public health, epidemiology, wellbeing, spatio-temporal statistics, Geographical Information Systems (GIS), data mining, mathematical modeling and algorithms, prediction models, interpolation techniques, time-series models, quantitative and qualitative analysis, analysis of biology systems, 2D and 3D spatial modeling, methodological design. She has several published papers in public health, epidemiology, spatial analysis, multivariate analysis and biostatistics.
Dana Balas-Timar PhD. student (final stage – Human resources management with
fuzzy logic, coord. Prof. dr. Mircea Miclea), is Asst. Professor in the Faculty of Educational Sciences, Psychology and Social Sciences at Aurel Vlaicu University of Arad, Romania. She holds a double specialization in Psychology and Automation and Applied Informatics. She was a Visiting Professor at Instituto Superior Miguel Torga in Coimbra, Portugal and research scientist in more than 9 European Union funded projects. She is member in the editorial review board of Agora and International Journal of Rough Sets and Data Analysis. Her research interests include: Cognitive Science, Organizational Psychology, Multiple Criteria Decision Making, Fuzzy logic, Nonlinear Dynamics, etc. She is author of 7 books and 40 international conferences and journal papers. She is a member of IANLP, IACAT, IAENG and APA.
Valentina E. Balas is currently Professor in the Department of Automatics and
Applied Software at the Faculty of Engineering, University “Aurel Vlaicu” Arad (Romania). She holds a Ph.D. in Applied Electronics and Telecommunications from Polytechnic niversity of Timisoara since 2003. She is author of more than 170 research papers in refereed journals and International Conferences. Her research interests are in Intelligent Systems, Fuzzy Control, Soft Computing, Smart Sensors, Information Fusion, Modeling and Simulation. She is Editor-in Chief to International Journal of Advanced Intelligence Paradigms (IJAIP), member in Editorial Boards for national and international journals, serves as reviewer for many International Journals and conferences and is evaluator expert for national and international projects She participated in many international conferences as General Chair, Organizer, Session Chair and member in International Program Committee. She was mentor for many student teams in Microsoft (Imagine Cup), Google and IEEE competitions in the last six years. She has a great experience in research projects. She is member of EUSFLAT, ACM and a Senior Member IEEE, member in TC - Emergent Technologies (IEEE CIS) and member in TC – Soft Computing (IEEE SMCS). Dr. Balas is Vice-president (Awards) of IFSA International Fuzzy Systems Association Council and Join Secretary of Joint Secretary of the Governing Council of Forum for Interdisciplinary Mathematics (FIM), - A Multidisciplinary Academic Body, India.
18
University of Porto - Portugal (1992); MSc in Electrical and Computer Engineering, in the field of Industrial Informatics, University of Porto (1995); PhD in Electrical and Computer Engineering, University of Porto (2001). From 1995 to 2000 he was a researcher at the Institute of Biomedical Engineering (INEB). He has been senior researcher and project coordinator at the Laboratory of Optical and Experimental Mechanics (LOME) at the Institute of Mechanical Engineering and Industrial Management (INEGI) since 2001. Between 2001 and 2011, he was Assistant Professor at the Department of Mechanical Engineering (DEMec) of the Engineering Faculty of the University of Porto (FEUP), and he has been Associate Professor at DEMec since 2011.
He is co-author of more than 350 scientific papers in national and international journals and conferences, co-editor of 18 international books and guest-editor of several special issues of international journals. In addition, he is Editor-in-Chief of the Computer Methods in Biomechanics and Biomedical Engineering: Imaging “ & “ Visualization (CMBBE: Imaging “ & “ Visualization); Editor-in-Chief of the International Journal of Biometrics and Bioinformatics (IJBB); Co-Editor-in-Chief of the International Journal for Computational Vision and Biomechanics (IJCV” & “B); Co-Editor of the Lecture Notes in Computational Vision and Biomechanics (LNCV” & “B); Associate Editor of the EURASIP Journal on Advances in Signal Processing (JASP), Journal of Engineering, ISRN Machine Vision, Advances in Biomechanics “ & “ Applications, and of the Journal of Computer Science (INFOCOMP), and reviewer of several international scientific journals. Since 2001, he has been Supervisor and Co-Supervisor of several MSc and PhD thesis and involved in several research projects, both as researcher and as scientific coordinator. Additionally, he is co-author of 3 international patents and 2 national patents.He has been Co-Chairman of various international conferences, such as: CompIMAGE 2006/2010/2012, VipIMAGE 2007/2009/2011/2013, CIBEM 2011, BioDENTAL 2009/2012, TMSi 2010, IMAGAPP 2009 and EUROMEDIA 2008; and of numerous mini-symposia, workshops and thematic sessions. In addition, he has been a member of scientific and organizing committees of several national and international conferences. His main research areas include Computational Vision, Medical Imaging, Computational Mechanics, Scientific Visualization, Human-Computer Interaction and New Product Development..
REFERENCES
1. Alayon S, Gonzalez de la Rosa M, Fumero FJ, SigutSaavedra JF, Sanchez JL (2013) Variability between experts in defining the edge and area of the optic nerve head. Archivos de la Sociedad Española de Oftalmología (English Edition) 88(5): 168–173.
2. Arifin AZ, Asano A, Taguchi A, Nakamoto T, Ohtsuka M, Tanimoto D (2005) Computer-aided system for measuring the mandibular cortical width on panoramic radiographs in osteoporosis diagnosis. Proc. SPIE Medical Imaging 2005, Image Processing Conf. San Diego, California 813-819.
3. Bagheri A, Adorno D, Rizzo P, Barraco R, Bellomonte L (2014) Empirical mode decomposition and neural network for the classification of electroretinographic data. Med Biol Eng Comput 52(7): 619-628.
4. Baumgart DC, SandbornWJ, Sandborn (2012) Crohn's disease.The Lancet 380 (9853): 1590–605. 5. Benamrane N, Aribi A, Kraoula L (1993) Fuzzy Neural Networks and Genetic Algorithms for
Medical Images Interpretation. IEEE Proceedings of the Geometric Modeling and Imaging 259-264. doi: 10.1109/GMAI.2006.20
6. Bisho CM (1995) Neural Networks for Pattern Recognition, Clarendon Press Oxford UK. 7. Casanova JL, Abel L (2009) Revisiting Crohn's disease as a primary immunodeficiency of
macrophages. The Journal of experimental medicine 206 (9): 1839–43.
8. Casteillo C, Castellano, Caonetti G, L.Fa-Nelli AM (2003) Classifying Image Pixels by a Neuro-fuzzy Ap-proach, Proceedings of the WISP 2003 Conference.
19
9. Castillo E, Guijarro-Berdinas B, Fontenla-Romero O, Alonso-Betanzos A (2006) A Very Fast Learning Method for Neural Networks Based on Sensitivity Analysis, Journal of Machine Learning Research 7: 1159–1182.
10. Chawla R, Ahlawat D, Kumar M (2014) Improved Software Development Effort Estimation Based on Fuzzy Logic Functions, International Journal of Engineering Sciences & Research Technology 3(12): 529- 535.
11. Cho JH, Brant SR (2011) Recent Insights into the Genetics of Inflammatory Bowel Disease. Gastroenterology140 (6): 1704–12.
12. Chowriappa P, Dua S, Todorov Y (2014) Introduction to Machine Learning in Healthcare Informatics. Med Biol Eng Comput56: 1-23.
13. Dessein R, Chamaillard M, Danese S (2008) Innate Immunity in Crohn’sDisease. Journal of Clinical Gastroenterology S144–7.
14. Devlin HB, Datta D, Dellipiani AW (1980) The incidence and prevalence of inflammatory bowel disease in North Tees Health District.World J Surg. 4(2):183–193.
15. Evans JG, Acheson ED (1965) An epidemiological study of ulcerative colitis and regional enteritis in the Oxford area.Gut. 6(4):311–324.
16. Fernandes FC, Brasil LM, JM Lamas and R Guadagnin (2010) Breast cancer image assessment using an adaptative network based fuzzy inference system. J. Pattern Recognition & Image Analysis 20(2): 192-200.
17. Folland R, Hines E, Boilot P, Morgan D (2002) Classifying coronary dysfunction using neural networks through cardiovascular auscultation. Med Biol Eng Comput40(3): 339-343.
18. Frost F, Karri V, editors (1999) Performance comparison of BP and GRNN models of the neural network paradigm using a practical industrial application. Proceedings ICONIP'99 6th International Conference on Neural Information Processing, IEEE 1999.
19. Fu X, Wang L (2003) Data dimensionality reduction with application to simplifying RBF network structure and improving classification performance. IEEE Transactions on Systems, Man, and Cybernetics, Part B: Cybernetics 33(3):399-409.
20. Fung CC, Iyer V, Brown W, Wong KW, editors (2005) Comparing the performance of different neural networks architectures for the prediction of mineral prospectivity. Proceedings of 2005 International Conference on Machine Learning and Cybernetics, IEEE 2005.
21. Ghaderzadeh M, Fein R, Standring A (2013) Comparing Performance of Different Neural Networks for Early Detection of Cancer from Benign Hyperplasia of Prostate, Applied Medical Informatics 33(3): 45-54.
22. Haykin S (1994) Neural Networks-A comprehensive foundation. Mac. Press, NY.
23. Hong CM, Chen C, Chen SY, Huang CY (2006)A Novel and Efficient Neuro-Fuzzy Classifier for Medical Diagnosis. IEEE International Joint Conference on Neural Networks 735-714. doi: 10.1109/IJCNN.2006.246757
24. Humphreys WG, Parks TG (1975) Crohn's disease in Northern Ireland--a retrospective survey of 159 cases.Ir J Med Sci. 144(11):437–446.
25. Hwang S, Kim D, Kang T, Park G (2007) Medical diagnosis system of breast cancer using FCM based parallel neural networks. Intl. Conf. Intelligent Comput. Springer. pp.712-719.
26. Istenič R, Kaplanis P, Pattichis C, Zazula D (2010) Multiscale entropy-based approach to automated surface EMG classification of neuromuscular disorders. Med Biol Eng Comput 48(8): 773-781.
27. Jiang X, Wah A (2003) Constructing and training feed-forward neural networks for pattern classification, Pattern Recognition 36: 853 – 867.
28. Joshi DM, RanaNK, MisraVM (2010) Classification of brain cancer using artificial neural network.Intl. Conf. Electronic Comput. Technol. pp: 112-116.
29. Kaya M, Alhajj R (2003). A clustering algorithm with genetically optimized membership functions for fuzzy association rules mining. 12th IEEE International Conference on Fuzzy Systems 2:881–886.
20
30. Kodogiannis VS, Lygouras JN (2008) Neuro-fuzzy classification system for wirelesscapsule endoscopic images. J. World Acad. Sci. Engg. & Technol. 45, 620-628.
31. Kriti, Virmani J, Dey N, Kumar V (2015) PCA-PNN and PCA-SVM based CAD Systems for Breast Density Classification. Applications of Intelligent Optimization in Biology and Medicine: Current Trends and Open Problems" to be published by Springer 2015.
32. Kumar A, Ghosh S, Tetarway S, Sinha R (2015) Support vector machine and fuzzy C-mean clustering-based comparative evaluation of changes in motor cortex electroencephalogram under chronic alcoholism. Med Biol Eng Comput53 (7): 609-622.
33. Kuncheva LI, Steimann F (1999) Fuzzy diagnosis. Artificial Intelligence in Medicine 16: 121-128.
34. Kyle J (1971) An epidemiological study of Crohn's disease in Northeast Scotland.Gastroenterology. 61(6):826–833.
35. Kyle J, Stark G. (1980) Fall in the incidence of Crohn's disease. Gut. 21(4):340–343.
36. Lalande JD, Behr MA (2010) Mycobacteria in Crohn's disease: How innate immune deficiency may result in chronic inflammation. Expert review of clinical immunology 6 (4): 633–41. 37. Li Y, Chi Z (2005) MR Brain Image Segmentation Based on Self-Organizing Map Network,
International Journal of Information Technology 11(8).
38. Maglinte DD, Gourtsoyiannis N, Rex D, Howard TJ, Kelvin FM (2003) Classification of small bowel Crohn's subtypes based on multimodality imaging., RadiolClin North Am. 41(2):285-303. 39. Maitrot A, Lucas M, Doncarli C, Farina D (2007) Signal-dependent wavelets for electromyogram
classification. Med Biol Eng Comput45: 807.
40. Marks DJ, RahmanFZ, Sewell GW, Segal AW (2010) Crohn's disease: An immune deficiency state". Clinical reviews in allergy & immunology 38 (1): 20–31.
41. Mayberry J, Rhodes J, Hughes LE (1979) Incidence of Crohn's disease in Cardiff between 1934-1977. Gut. 20(7):602–608.
42. Miller DS, Keighley AC, Langman MJ (1974) Changing patterns in epidemiology of Crohn's disease.Lancet. 2(7882):691–693.
43. Nath S, Kar J, Chakraborty S, Mishra G, Dey N (2014) A Survey of Image Classification Methods and Techniques. International Conference on Control, Instrumentation, Communication and Computational Technologies-2014, pp. 554 – 557. doi: 10.1109/ICCICCT.2014.6993023 44. Nawel Z, Azizi N, Sellami M, Dey N (2015) Automated Classification of Mammographic
Abnormalities using Transductive Semi Supervised Learning Algorithm. Mediterranean Conference on Information & Communication Technologies'2015, May 7-9, 2015 Saïdia, Morocco.
45. Nazzal JM, El-Emary IM, Najim SA (2008) Multilayer perceptron neural network (MLPs) for analyzing the properties of Jordan oil shale. World Applied Sciences Journal 5(5):546-52. 46. Oweis RJ, Sunna’MJ (2005) A Combined Neuro–Fuzzy Approach For Classifying Image Pixels
In Medical Applications, Journal of Electrical Engineering 56(5-6): 146–150.
47. Panchal R, Verma B (2004) A Fusion of Neural Network Based Auto-associator and Classifier for the Classification of Microcalcification Patterns. Intl. Conf. Neural Information Processing, Springer Berlin,794-799.
48. Reddy S, Raju K (2009) Improving the Accuracy of Effort Estimation through Fuzzy Set Representation of Size, Journal of Computer Science 5 (6): 451-455.
49. Rodgers GP (2013) Crohn's Disease. National Digestive Diseases Information Clearinghouse (NDDIC).
50. Ross N, Pritchard C, Rubin D, Dusé A (2006) Automated image processing method for the diagnosis and classification of malaria on thin blood smears. Med Biol Eng Comput 44(5): 427-436.
51. Saraswat M, Arya K (2014) Feature selection and classification of leukocytes using random forest. Med Biol Eng Comput52(12): 1041-1052.
21
52. Smith IS, Young S, Gillespie G, O'Connor J, Bell JR (1975) Epidemiological aspects of Crohn's disease in Clydesdale Gut. 16(1):62–67.
53. Tresadern JC, Gear MW, Nicol A (1973) An epidemiological study of regional enteritis in the Gloucester area. Br J Surg. 60(5):366–368.
54. Übeyli ED (2009) Adaptive neuro-fuzzy inference systems for automatic detection of breast cancer. J Med Syst. 33:353–8.
55. Wu SG, Bao FS, Xu EY, Wang Y-X, Chang Y-F, Xiang Q-L, editors (2007) A leaf recognition algorithm for plant classification using probabilistic neural network. 2007 IEEE International Symposium on Signal Processing and Information Technology 2007 IEEE.
56. Yamamoto-FurushoJK, Korzenik JR (2006) Crohn's disease: Innate immunodeficiency?. World Journal of Gastroenterology 12 (42): 6751–5.
57. Ye C, Yang J, Geng D, Zhou Y, Chen N (2002) Fuzzy rules to predict degree of malignancy in brain glioma. Med Biol Eng Comput40(2):145-152.