CISMOB - Cooperative information
platform for low carbon and sustainable
mobility
CISMOB
Cooperative information platform
for low carbon and sustainable mobility
Baseline Assessment Report
CISMOB Project Index Number: PGI01611, funded by the Interreg Europe Programme
Project Coordinator: Jorge Bandeira
CISMOB Lead Partner: University of Aveiro (PP1), Portugal CISMOB Advisory Partner: Stockholm University (PP2), Sweden
CISMOB Project Partners: Municipality of Águeda (PP3), Portugal; Bucharest Metropolitan
Transport Authority (PP4), Romania; Intelligent Transport Systems Romania (PP5), Romania; Extremadura Energy Agency (PP6), Spain
CISMOB Team: J.M. Bandeira, C. Barbu, C. Borrego, M.C. Coelho, C. Couceiro, L. Cuadros, C.
Dominguez, M. Glinos, V. Koulolias, C. Laranjeira, E. Macedo, M. Marques, M. Niculescu, F. Pocostales, J.P. Santos, P. Tafidis
Publisher: UA Editora - Universidade de Aveiro ISBN: 978-972-789-536-6
Acknowledgements: Authors would like to thank all CISMOB partners for their cooperation
assistance in gathering and providing valuable information for the conduction of the analyses and preparation of this report. Special thanks go to CCDR-C (Centro Regional Coordination and Development Commission) for their help in providing information to improve the report.
The final version of Baseline Assessment Report (BAR) will be available on CISMOB web site:
https://www.interregeurope.eu/cismob/
Project Summary
CISMOB main vision is to promote innovative ways to reduce carbon footprint and increase the sustainability of urban areas by improving the efficiency in the use of urban transport infrastructure through ICT.
In a context of increasing availability of sensor technology to monitor and record large amounts of data, a common challenge to policy makers is to identify the best practices to take advantage of these new sources of data and use them to prioritize intervention areas, to manage efficiently current road networks, to inform citizens and motivate them to choose more sustainable mobility options.
CISMOB will focus on improving the implementation of regional policies and local mobility programmers by having a thorough understanding about the different transport-related impacts and the main vulnerabilities associated to different zones of the territory. CISMOB partners consider that policy and local mobility programs should not be focused in minimizing a particular parameter (ex. Levels of congestion), but rather to promote holistic approaches capable of responding to the questions: what (to minimize)? why? when? where? and how? Regional and Policy instruments should also provide a framework of indicators to assess and inform the costs and benefits of environmentally effectiveness of different mobility solutions.
CISMOB integrates a set of cities and regions of heterogenic characteristics, which are represented by institutions with complementary profiles. All partners will cooperate together in order to learn best practices of sustainable management of urban transport taking advantage of ICT. Workshops, staff exchange-programs and dissemination actions will be carried out with the aim of exchanging local experiences, learning best practices and enhancing the citizen’s participation.
Executive Summary
The present baseline assessment report (BAR) examines and evaluates the status of ICT implementation in the transport sector in the CISMOB partner regions and provides the foundation for the subsequent activities and outputs.
Specifically, the BAR evaluates how ICT and sensing technology is being used in the transportation system and how carbon footprint and sustainability indicators are being considered in the three regions represented by CISMOB partners. BAR will contain a SWOT analysis of partner regions’ positions, in this field. The assessment will be based on questionnaires and historic data. A designated working group of CISMOB partners will describe the regional status in 6 key topics:
1. Online traffic monitoring capacity 2. ICT penetration in multimodal mobility
3. Environmental and urban activity patterns monitoring
4. Available IT and ITS tools to promote low-carbon and sustainable mobility 5. Policy frameworks, socio-political awareness and readiness
6. Financial instruments and institutional capacity.
The information will allow scoring the regions advances and to critically assess their own status for future progress.
The specific objectives of the present baseline assessment are to:
• Provide an overview of the current state of CISMOB areas in terms of sustainable mobility development, implementation of measures and application of ICT to the transport sector as a mean of reducing energy consumption and the carbon footprint, as well as currently available policy instruments that CISMOB project will address, and also evaluating its impact and contribution to drive policy change; • Identify good practices across the CISMOB partnership and classify them;
• Offer inputs and guidance in terms of good practices, particularly in which extent they can be transferred to other cities and regions with different scales and specificities.
Table of Contents
Project Summary ... v
Executive Summary ... vii
List of Abbreviations ... xiii
1 CISMOB Regions Characterization ... 1
1.1 Location ... 1
1.2 Area ... 2
1.3 Population ... 2
1.4 Density ... 3
1.5 Gross Domestic Product ... 4
1.6 Climate Change and Energy Vulnerability ... 4
1.7 Transport Externalities ... 5
1.7.1 Accident Costs ... 5
1.7.2 Travel Time Costs ... 7
1.7.3 Air Pollution Costs ... 8
1.7.4 Noise Costs ... 12
1.7.5 Climate Change Costs ... 13
1.8 Digital Agenda Scoreboard ... 14
1.9 Summary of Current Baseline Situation of CISMOB Project Areas ... 15
2 Available ITS Tools to Promote Low-carbon and Sustainable Mobility ... 17
2.1 Multimodal Journey Planners ... 17
2.2 In-Vehicle Information Systems ... 18
2.3 Smart Ticketing ... 18
2.4 Real-Time Passenger Information ... 20
2.5 Automatic Vehicle Location ... 20
2.6 Electronic Fee Collection ... 21
2.7 Smart Parking ... 22
2.8 Traffic Signal Control ... 23
2.9 Pollution Monitors ... 23
2.10 Automatic Incident Detection ... 24
2.11 Cooperative Vehicle Systems ... 24
2.12 Automated Vehicles ... 25
2.13 Bicycle Sharing Schemes ... 25 ix
3 ITS Penetration in CISMOB Regions ... 27
3.1 Advanced Traffic Management Systems (ATMS) ... 27
3.1.1 Centro Region ... 27 3.1.2 Águeda ... 29 3.1.3 Extremadura ... 29 3.1.4 Romania ... 31 3.1.5 Bucharest – Ilfov ... 34 3.1.6 Stockholm County ... 35
3.2 Advanced Traveller Information System (ATIS) ... 38
3.2.1 Centro Region ... 38 3.2.2 Águeda ... 39 3.2.3 Extremadura ... 39 3.2.4 Romania ... 39 3.2.5 Bucharest – Ilfov ... 39 3.2.6 Stockholm County ... 40
3.3 Advanced Public Transportation System (APTMS) ... 42
3.3.1 Centro Region ... 42 3.3.2 Águeda ... 44 3.3.3 Extremadura ... 44 3.3.4 Romania ... 44 3.3.5 Bucharest – Ilfov ... 45 3.3.6 Stockholm County ... 45
3.4 Emergency Management System (EMC) ... 46
3.4.1 Centro Region ... 47
3.4.2 Águeda ... 48
3.4.3 Romania ... 48
3.4.4 Bucharest – Ilfov ... 48
3.4.5 Stockholm Country ... 48
4 Environmental and Urban Activities Patterns Monitoring ... 51
4.1 Urban Activity ... 51
4.2 Air Quality ... 52
4.2.1 Centro Region ... 52
4.2.2 Águeda ... 53 x
4.2.3 Extremadura ... 54 4.2.4 Romania ... 55 4.2.5 Bucharest - Ilfov ... 56 4.2.6 Stockholm County ... 56 4.3 Noise ... 60 4.3.1 Centro Region ... 60 4.3.2 Águeda ... 60 4.3.3 Extremadura ... 62 4.3.4 Romania ... 62 4.3.5 Bucharest - Ilfov ... 62 4.3.6 Stockholm County ... 63
4.4 Overview of the Environmental Capacity in CISMOB Project Areas ... 63
5 Policy Framework, Socio-political Awareness and Readiness ... 65
5.1 Centro Region ... 65 5.2 Águeda ... 68 5.3 Extremadura ... 72 5.4 Romania ... 72 5.5 Bucharest – Ilfov ... 73 5.6 Stockholm County ... 73
6 Financial Instruments, and Institutional Capacity ... 79
6.1 Portugal/Centro Region/Águeda ... 79 6.2 Extremadura ... 80 6.3 Romania/Bucharest ... 81 6.4 Sweden/Stockholm ... 82 7 SWOT Analysis... 89 7.1 Centro Region ... 89 7.2 Águeda ... 92 7.3 Extremadura ... 94 7.4 Romania ... 95 7.5 Bucharest ... 98 8 References ... 101 xi
List of Abbreviations
CISMOB – Cooperative Information Platform for Low Carbon and Sustainable Mobility GDP – Gross Domestic Product
PT – Portugal ES – Spain SE – Sweden RO – Romania
NMS – New Member States EU – European Union
NUTS – Nomenclature of Territorial Units for Statistics PPS – Purchasing Power Standards
GVA – Gross Value Added EC – European Commission
INE – Instituto Nacional de Estatística
ICT – Information and Communication Technologies IT – Information Technologies
ITS – Intelligent Transport Systems
ATIS – Advanced Traveler Information System APTMS – Advanced Public Transportation System ATMS – Advanced Traffic Management System EMC – Emergency Management System
EFC – Electronic Fee Collection
GNSS – Global Navigation Satellite System IVIS – In-vehicle Information Systems EU – European Union
AVL – Automatic Vehicle Location
SPIN – Street Parking Information Network AID – Automatic Incident Detection
C-ITS – Cooperative Intelligent Transport Systems VMS – Variable Message Signs
TMC – Traffic Management Centres CO – Carbon Monoxide
SOx – Sulfur Oxides NOx – Nitrogen Oxides NO2 – Nitrogen Dioxides
PM10 – Particular Matter 10 micrometers or less in diameter PM2.5 – Particular Matter 2.5 micrometers or less in diameter EEA – European Environmental Agency
ISA – Intelligent Speed Assistance
NVDB – Swedish National Road Database NTS – National Traffic Management System GCP – General Communication Platform API – Application Programming Interface
SMHI – the Swedish Meteorological and Hydrological Institute SL – Storstockholms Lokaltrafik
SLB analysis – Stockholm Air and Noise Analysis EPA – Environmental Protection Agency
SCB – Official Statistics of Sweden
SLU – Swedish University of Agricultural Sciences UNFCCC – UN Climate Change
FORES – Forum for reforms and entrepreneurship AQS – Air Quality Station
SMTUC – Municipal Urban Transport of Coimbra RATB – Regia Autonoma de Transport Bucuresti
CCDRC – Regional Development Committee of Centro Region DGT - General Directorate of Traffic
1 CISMOB Regions Characterization
CISMOB partners form a diverse grouping of cities and regions from four different countries: Águeda (Portugal), Bucharest (Romania), Centro Region (Portugal), Extremadura (Spain), Romania and Stockholm (Sweden). The areas bear heterogeneous characteristics and differ in terms of size, population and Gross Domestic Product (GDP) per capita. This chapter presents fundamental information and general description on the CISMOB regions: location, area, population, density, GDP, economic structure, digital scoreboard, modal share, road fleet composition, climate and environmental vulnerability and externalities valuation. Regarding the particular cases of Bucharest and Stockholm, data referred to region areas.
1.1 Location
The regions of CISMOB project cover four different countries: Portugal (PT), Romania (RO), Spain (ES) and Sweden (SE). Centro Region (PT), Extremadura (ES) and Stockholm (SE) are from the EU-15 group1, while Romania is from the European Union (EU) new member states
(NMS)2 (Figure 1-1).
Figure 1-1 Location of the CISMOB project partners’ headquarters
1 It was the number of member countries in the European Union prior to the accession of ten candidate countries on 1 May 2004.
2 Countries that joined EU after 2004.
1.2 Area
The cities and regions are quite different in area (Figure 1-2). The largest examined area is the country of Romania, with 238,390.7 km2, while Águeda’s surface area is only 335.3 km2.
To enable comparison, the data used are from Eurostat Database – Total and Land Area by NUTS 2 region3, where the information provided are based on the regional structure and
the Nomenclature of Territorial Units for Statistics (NUTS) classification, which has been used for regional statistics for many decades. The information about the municipality of Águeda was retrieved from national data (DGTerritório, 2016).
Figure 1-2 Surface area of CISMOB project areas (2014) (Eurostat, 2016g)
1.3 Population
Within the studied areas, population also presents significant differences (Figure 1-3). Most populous area is Romania with 19,947,311 inhabitants, while Águeda’s population (2011) is only 47,729 inhabitants (INE, 2012). Centro Region and Bucharest have the same level of population as Stockholm.
3 The data used are total area.
0 50 100 150 200 250
Romania Extremadura Centro Region Stockholm Bucharest Agueda Area (km2) 238.390,70 41.611,00 28.199,00 6.779,00 1.821,20 335,28 Tho usa nd k m 2 Area (km2) 2
Figure 1-3 Population of CISMOB project areas (2014) (Eurostat, 2016e)
1.4 Density
Regarding the density of each area, the metropolitan area of Bucharest clearly stands out as the most densely populated area with 1,296.8 inh/km2, while the region of Extremadura is
the least densely populated area with 26.8 inh/km2 (Figure 1-4).
Figure 1-4 Density of CISMOB project areas (2014) (Eurostat, 2016b) 0 2 4 6 8 10 12 14 16 18 20
Romania Bucharest CentroRegion Stockholm Extremadura Águeda Population (inh) 19.947.311 2.282.968 2.281.164 2.163.042 1.091.623 47.729 Mil lio n i nh ab ita nts Population (inh) 0 1 2 3 4 5 6 7 8 9 10 11 12 13
Bucharest Stockholm Águeda Romania CentroRegion Extremadura Density (inh/km2) 1.296,8 334,1 142,4 86,5 80,6 26,8 Hundr ed inha bi ta ns pe r k m 2 Density (inh/km2) 3
1.5 Gross Domestic Product
Gross Domestic Product is the most common indicator for the overall size of the economy of a country or a region. It shows the total value of all goods and services produced less the value of goods and services used for intermediate consumption in their production. GDP per capita is widely used for a comparison of living standards, or to monitor the process of convergence across the EU. Expressing GDP per capita in Purchasing Power Standards (PPS)4
in relation to the EU-28 enables cross-country comparisons and is the key variable for determining the eligibility of NUTS 2 regions in the framework of the EU's structural policy (Eurostat, 2016f).
GDP per capita in PPS in CISMOB areas ranges from €15,200 to €47,200 for 2014. The richest CISMOB region is Stockholm, where the GDP per capita in PPS in relation to the EU-28 average was 172% in 2014, while the poorest area is the country of Romania, where the GDP was only 55%. On the contrary, the GDP per capita in PPS in the region of Bucharest is significantly higher, since almost one third of the National Romanian GDP is generated there. Finally, in PPS terms, the GDP per capita in PPS in Centro Region and Extremadura and in the city of Águeda are very similar (Table 1.1).
Table 1.1 GDP of CISMOB project areas (2014)
CISMOB Area GDP (PPS per capita) (million Euro) GDP % of the EU (28) average (PPS per capita) % of national GDP generated in region Stockholm 47,200 135,631 172 31.4 Bucharest 35,600 40,453 129 26.9 Centro Region 18,500 32,708 67 18,9 Águeda5 17,819 - 67 - Extremadura 17,300 16,907 63 1,6 Romania 15,2006 150,230 55 100
Source: Regional Economic Accounts – ESA 2010 (Eurostat, 2016f) and own calculations for % of national GDP generated in region.
1.6 Climate Change and Energy Vulnerability
Climate change vulnerability index was developed in order to assess the extent to which regions will be affected by the consequences of climate change (e.g., flooding, coastal erosion, land degradation and desertification and potential drought hazard). Regions under threat of these underlying processes are already facing social, environmental and economic issues. According to the Commission Staff Working Document “REGIONS 2020: an Assessment of Future Challenges for EU Regions (EU, 2008), regions subject to the highest pressure are generally located in the South and East of Europe, where CISMOB regions are
4 If the index of a country is higher than 100, this country's level of GDP per head is higher than the EU average and vice versa.
5 Data was available until year 2013 (Pordata, 2016). 6 Provisional.
4
located. The pressures from climate change would be greater in regions with low GDP per capita, which thus have a lower capacity for adaptation to climate change.
Energy vulnerability index combines three main elements: i) energy import dependency; ii) energy consumption by households and industry, and finally, iii) carbon emissions (EU, 2008). According to the Commission’s document, peripheral regions located mainly in Eastern and Southern Member States appear particularly vulnerable, while regions generally located in Northern and Western Europe show a greater capacity to adapt (for instance, Sweden).
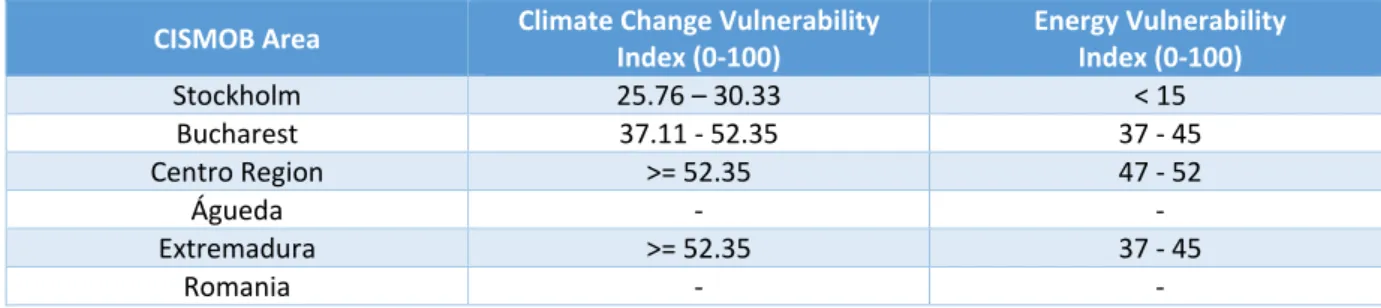
Climate change and energy vulnerability in the CISMOB regions are diverse, as it can be verified through the index scores reported in Table 1.2 demonstrate. Scores for each index range between 0 and 100, with zero representing the least vulnerable and 100 the most vulnerable. On one hand, Centro Region and Extremadura show the highest climate vulnerability, while Stockholm presents the lowest. On the other hand, Centro Region has the highest energy vulnerability, while Stockholm has the lowest.
Table 1.2 Climate Change and Energy Vulnerability Index of CISMOB project areas (2008)
CISMOB Area Climate Change Vulnerability Index (0-100) Energy Vulnerability Index (0-100)
Stockholm 25.76 – 30.33 < 15 Bucharest 37.11 - 52.35 37 - 45 Centro Region >= 52.35 47 - 52 Águeda - - Extremadura >= 52.35 37 - 45 Romania - -
Source: Regions 2020. An Assessment of Future Challenges for EU Regions (EU, 2008).
1.7 Transport Externalities
Externalities are costs or benefits of an activity experienced by those who have not generated them. Transport externalities are primarily negative (external costs) and the most important in this context is the road transport sector, because it is responsible for the majority of these external costs. In the area of internalizing external costs, considerable research has been carried out over the past few decades, especially about the transport sector and the significant knowledge which has been produced so far could provide major contributions to the formulation of policies. Policy intervention should aim at making external costs part of the decision-making process of transport planners and users, and lead to a more efficient use of road infrastructure (Korzhenevych et al., 2014). This section provides information on the most important transport costs and gives an overview of the current situation in CISMOB areas.
1.7.1 Accident Costs
Each Member State is required to carry out the calculation of its average social accident costs. Its calculation is generally easier compared to marginal accident costs, because it is
based on data availability and collection. Table 1.3 presents the average social accidents costs of the countries that are represented from CISMOB’s areas at €-2010 market prices.
Table 1.3 Average social accident costs, at market prices (PPP) in €-2010
Country Number of Deaths Fatality Severe Injury Slight Injury
Portugal 937 1,505,000 201,000 13,800
Romania 2,377 1,048,000 136,200 10,400
Spain 2,479 1,913,000 237,800 17,900
Sweden 266 2,224,000 328,700 23,500
Source: EU transport in figures 2012 (EC, 2011a) and Update of the Handbook on External Costs of Transport (Korzhenevych et al., 2014). The European Union has been working hard to improve road safety and reduce the number of people killed in road accidents in each Member State. Despite the significant improvement, the target to halve fatalities between 2001 and 2010 that was set in the European Road Safety Action Programme 2001–2010, was not met. According to European Commission, a road injury accident is considered an accident that involving at least one road vehicle in motion on a public road or private road to which the public has right of access, resulting in at least one injured or killed person. The collection and analysis of data on accidents and physical injuries is an integral and critical part in order to evaluate road safety problems, to identify the priority fields of action, to define the necessary measures and to monitor their effects (EC, 2003).
Table 1.4 provides an insight into the trends in fatalities of road transport and covers the total social cost of road fatalities in each CISMOB region. The indicator is the number of persons killed each year in road accidents expressed both as absolute totals and per million of population. It demonstrates the relative road safety and the need for improvement of safety measures as well as infrastructure. The safest CISMOB area, and one of the safest in EU, is Stockholm with approximately 16 deaths per million inhabitants by 2010. On the opposite, the city of Águeda has the highest rate of persons killed in road accidents per million inhabitants among CISMOB areas. Regarding total social cost of road fatalities, the most compelling figure of the table is the estimation of their cost in Centro Region compared to the other areas, highlighting the need for immediate measures and actions.
Table 1.4 Total social cost of road fatalities at market prices (PPP) in €-2010 by CISMOB project areas
CISMOB Area Number of Deaths (per million inhabitants) Number of Deaths
(EU-27 = 62) Cost Stockholm 33 16.34 73,393,000 Bucharest 212 93.74 222,176,000 Centro Region 296 90.68 445,480,000 Águeda(Eurostat, 2016h) 9 188.577 13,545,000 Extremadura 85 77.30 162,605,000 Romania 2,377 117.12 2,491,096,000
Source: Victims in road accidents by NUTS 2 regions (Korzhenevych et al., 2014) and Update of the Handbook on External Costs of Transport (Litman & Doherty, 2009; Wardman & Chintakayala, 2012) and own calculations for Cost.
7 The number is based on Águeda’s population in 2011.
6
1.7.2 Travel Time Costs
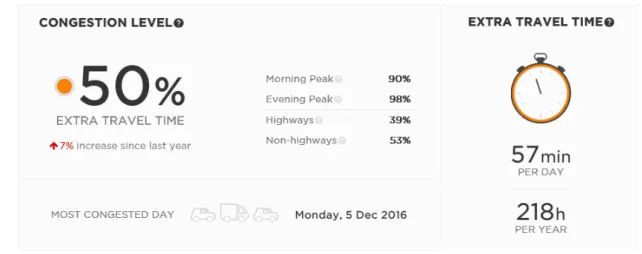
Travel time and related costs are major factors contributing to travel decisions. Travel time is one of the most significant costs of transportation and their evaluation is a very important concept in transport research and policy. Traffic congestion wastes time (increases travel time), energy and causes pollution, decreases productivity and imposes costs on society. According to the recently updated TomTom 2016 Traffic Congestion Statistics8, Bucharest is
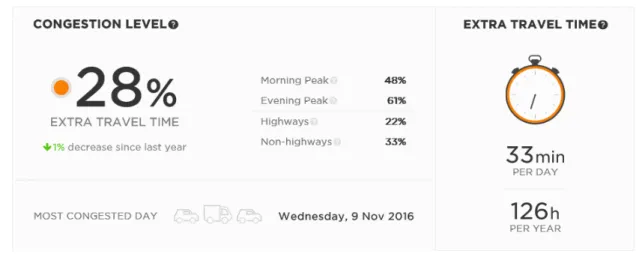
the first European city in the Top 5 of the cities with largest congested level. In particular, Bucharest, in Romania, had a level congestion of 50%, while the city of Coimbra, a medium-sized city of Centro Region in Portugal, presented a congestion level of 17%. Regarding the situation in Stockholm, in Sweden, this city had a congestion level of 28%, and statistics showed a decrease around 1% when compared to the year 2015.
Figure 1-5 Traffic congestion statistics for Bucharest based on TomTom's historical database for 2016.
Figure 1-6 Traffic congestion statistics for Coimbra based on TomTom's historical database for 2016.
8 TomTom Traffic Index – Measuring Congestion Worldwide https://www.tomtom.com/en_gb/trafficindex/ 7
Figure 1-7 Traffic congestion statistics for Stockholm based on TomTom's historical database for 2016.
The value of travel time depends on the type of trip and travel conditions and it is referred to the cost of time spent on travelling. Total travel time cost is the product of time spent travelling and unit costs, and it is usually expressed in euros per hour (Litman & Doherty, 2009). Various studies and organizations have developed estimates of travel time values, although World Bank economist Kenneth Gwilliam, after an extensive review of international studies, recommends that work travel time should be 133% of wage rate per hour, and that a default value for adult personal travel (including commuting) time should be 30% of household income per hour, unless better local data are available (Eurostat, 2016d). Table 1.5 provides indicative values of personal travel time costs for CISMOB’s areas based on the aforementioned values.
Table 1.5 Travel Time Values of CISMOB project areas (€-2010/h)
CISMOB Area Household income per inhabitant Travel Time Value (personal travel)
Stockholm 3.16 0.95 Extremadura 1.20 0.36 Centro Region 1.09 0.33 Bucharest 0.98 0.29 Romania 0.39 0.12 Águeda - -
Source: Income of households by NUTS 2 regions (OECD, 2014) and own calculations for Travel Time Value.
1.7.3 Air Pollution Costs
Air pollution is one of the most important environmental issues of our time. It is a leading cause of many health problems and kills more than 3 million people across the world every year (Korzhenevych et al., 2014). It costs countries many billions per year in diseases and deaths and constrains economic development. Dealing with air pollution and improving air quality has become a top priority for policy makers and environmental agencies.
1.7.3.1 National Air Pollutant Indicators - Contribution of Transport Sector to Air pollution in CISMOB Countries
The following table shows the contribution of transport sector to key air pollutant emissions in the countries of CISMOB partners, namely, NOX, NMVOCs, SO2, NH3, PM2.5, CO, and CH4.
From Table 1.6, it can be observed NOX is the air pollutant whose transport sector has
higher contributions for national emissions in all countries. CO emissions from road transport have also a considerable impact in Portugal and Sweden representing 28 and 29% respectively of total air pollutant emissions. Regarding PM2.5, the impact of transport is more notorious in Spain and Sweden representing more than 20% of total emissions.
Table 1.6 Contribution of the transport sector to key air pollutant emissions in the countries of CISMOB partners
Country NOX NMVOCs SO2 NH3 PM2.5 CO CH4
Portugal 42% 9% 0% 2% 7% 28% 0%
Romania 39% 6% 0% 1% 3% 14% 0%
Spain 34% 5% 0% 1% 20% 11% 0%
Sweden 42% 14% 0% 5% 24% 29% 2%
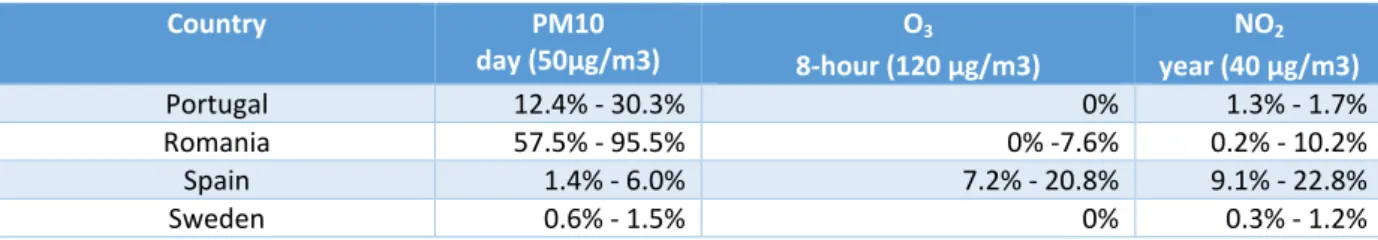
Regarding population exposed to air pollutant concentrations, Table 1.7 shows the minimum and maximum percentage of urban population exposed above the EU air quality objectives in the triennium before 2014 (2011-2013).
Table 1.7 Urban population exposed to air pollutant concentrations above the EU air quality objectives - minimum and maximum range (EEA, 2014)
Country PM10
day (50μg/m3) 8-hour (120 μg/m3) O3 year (40 μg/m3) NO2
Portugal 12.4% - 30.3% 0% 1.3% - 1.7%
Romania 57.5% - 95.5% 0% -7.6% 0.2% - 10.2%
Spain 1.4% - 6.0% 7.2% - 20.8% 9.1% - 22.8%
Sweden 0.6% - 1.5% 0% 0.3% - 1.2%
Romania was clearly the country of the CISMOB consortium presenting worse levels of urban air quality. At least 57% (in the year with better air quality levels) of urban population exposed to air pollutant concentrations (PM10) were above the EU air quality objectives in the triennium 2011-2013. Portugal and Spain also recorded poor air quality levels in terms of PM10 and NO2, respectively, with values raising up to 30% and 23% of urban populations
in the years with the highest pollutions levels. In Sweden, urban population exposed to poor air quality is marginal.
1.7.3.2 Air Quality in CISMOB Regions
This section describes average concentrations of atmospheric pollutants where transport sector is directly (NO2 and PM) and indirectly (Ozone) a main contributor. The type of
monitoring technology, sensors and data processing is distinct among the various regions of the consortium. As far as possible, this section attempts to provide a general picture of the air quality indices of the CISMOB regions.
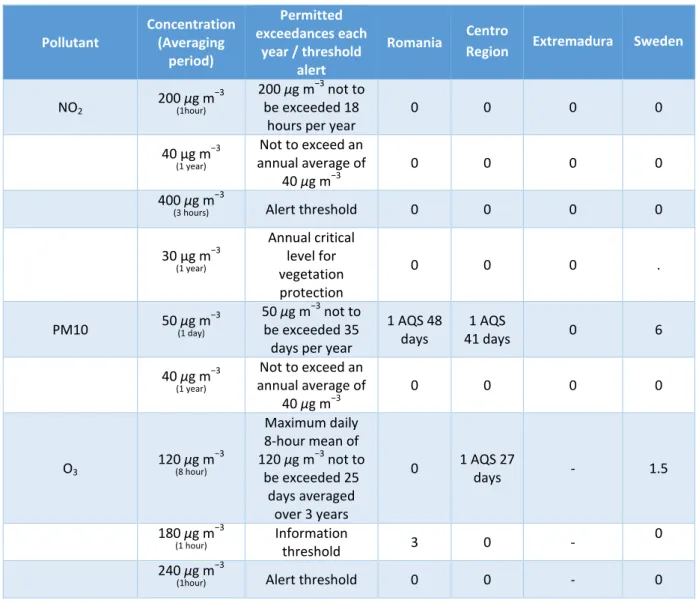
Table 1.8 Exceedance of air quality limit values in CISMOB Regions (2014)
Pollutant Concentration (Averaging period)
Permitted exceedances each
year / threshold alert
Romania Centro Region Extremadura Sweden
NO2 200 μg m(1hour) −3
200 μg m−3 not to be exceeded 18
hours per year 0 0 0 0
40 μg m−3 (1 year) Not to exceed an annual average of 40 μg m−3 0 0 0 0 400 μg m−3
(3 hours) Alert threshold 0 0 0 0
30 μg m−3 (1 year) Annual critical level for vegetation protection 0 0 0 . PM10 50 μg m(1 day) −3 50 μg m−3 not to be exceeded 35 days per year
1 AQS 48
days 41 days 1 AQS 0 6 40 μg m−3 (1 year) Not to exceed an annual average of 40 μg m−3 0 0 0 0 O3 120 μg m(8 hour) −3 Maximum daily 8-hour mean of 120 μg m−3 not to be exceeded 25 days averaged over 3 years 0 1 AQS 27 days - 1.5 180 μg m−3
(1 hour) Information threshold 3 0 - 0
240 μg m−3
(1hour) Alert threshold 0 0 - 0
Source: (ANPM, 2014; Lameiras, 2015; REPICA, 2017)
This table permits to conclude that during 2014, Romania and Centro Region (Portugal) exceeded for more than 40 days the limits of air quality w.r.t. PM10. Additionally, Centro Region exceeded the legal limits w.r.t. O3 for almost 30 days in that year.
1.7.3.3 Monetization of road traffic-related air pollution emissions
Damage costs associated to pollutant emissions reflect the total estimated amount of economic losses produced by the impact of the road traffic-related air pollution. Table 1.9 provides the damage cost values from the most common air pollutants in the corresponding countries to CISMOB areas, while Table 1.11 gives information about estimated costs related to pollutant emissions in each country. Table 1.10 presents the results in terms of pollutant emissions for each country.
Table 1.9 Damage costs of main pollutants from transport, in €-2010 per tonne
Country Rural PM2.5 NOx NMVOC
Area Suburban Area Urban Area
Portugal 18,371 49,095 196,335 1,957 1,048
Romania 56,405 84,380 231,620 22,893 1,796
Spain 14,429 48,012 195,252 4,964 1,135
Sweden 14,578 50,210 197,450 5,247 974
Source: Update of the Handbook on External Costs of Transport (Korzhenevych et al., 2014)
Note: Urban - population density of 1500 inhabitants/km2; suburban - population density of 300 inhabitants/km2; rural - population density below 150 inhabitants/km2
Table 1.10 Air pollutants from transport sector in tonnes (2014)
Country PM2.5 NOx NMVOC
Portugal 3,914.24 67,456.50 15,417.81
Romania 3,573.83 81,315.65 30,451.74
Spain 18,412.49 390,487.05 118,558.34
Sweden 2,856,06 60,651.02 15,913.39
Source: Own calculations
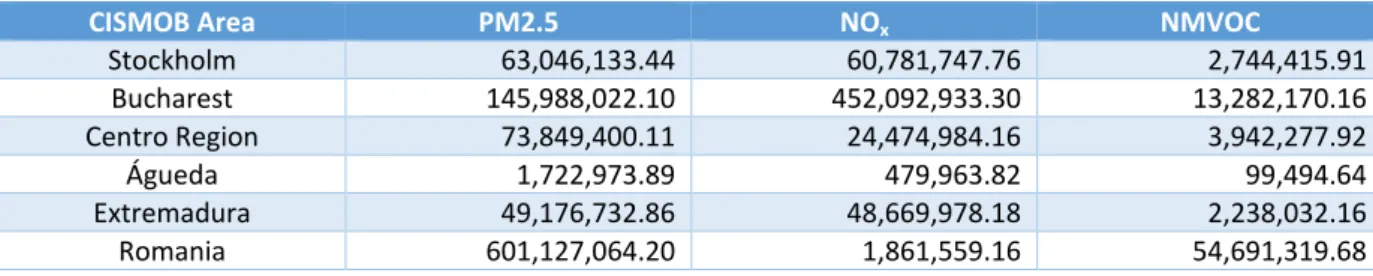
Table 1.11Damage costs of main pollutants from transport in CISMOB Project areas, in €-2010 per tonne
CISMOB Area PM2.5 NOx NMVOC
Stockholm 63,046,133.44 60,781,747.76 2,744,415.91 Bucharest 145,988,022.10 452,092,933.30 13,282,170.16 Centro Region 73,849,400.11 24,474,984.16 3,942,277.92 Águeda 1,722,973.89 479,963.82 99,494.64 Extremadura 49,176,732.86 48,669,978.18 2,238,032.16 Romania 601,127,064.20 1,861,559.16 54,691,319.68
Source: Own calculations
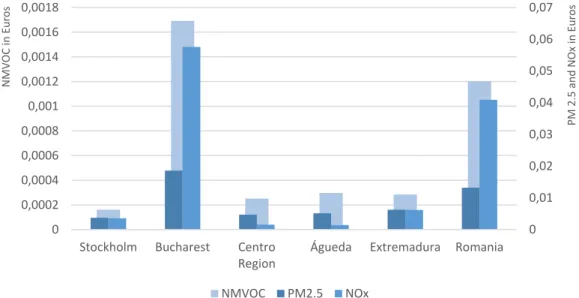
Figure 1-8 gives an overview of the differences among CISMOB Project areas in terms of emission costs per kilometre in Euros (€), based on recent official data from 2014. Vertical axis on left refers to costs of NMVOC, while the right one refers to costs of PM2.5 and NOX.
Figure 1-8 Estimates of emission costs per kilometre in Euros (€), in CISMOB Project areas
It is clear Bucharest presents the highest costs per kilometre for all these pollutants. A closer look shows the lowest costs for NMVOC and PM2.5 are verified in Stockholm, while for NOX
is in Águeda. In terms of NMVOC costs, Águeda and Extremadura values are quite similar.
1.7.4 Noise Costs
Transport sector is the major source of noise, while traffic noise is one of the main local environmental problems in Europe, with around 80 million EU-citizens suffer from unacceptable noise levels (Korzhenevych et al., 2014). It is important that the impacts on noise are fully considered in decision making for any policy, programme or project as noise emissions can affect people’s health, wellbeing, productivity, and the natural environment. The Handbook on External Costs of Transport (EEA, 2015b) provides the updated values for different levels of noise (Table 1.12), while based on Noise Observation and Information Service for Europe data (Korzhenevych et al., 2014)(Table 1.13), we estimated the noise costs in major cities of CISMOB areas (Table 1.14). Regarding Centro Region and the city of Águeda, there were not available data about the number of people in agglomerations exposed to noise from roads.
Table 1.12 Cost factors (central values) for noise exposure (€-2010, factor costs, per year per person exposed)
Country =51 =55 =60 Lden9, dB(A) =65 =70 =75
Portugal 6 29 56 84 113 187
Romania 3 15 29 44 58 97
Spain 8 39 78 117 156 259
Sweden 13 67 133 199 256 411
Source: Update of the Handbook on External Costs of Transport (EEA, 2015b).
9 Lden is the common EU indicator that corresponds to the average noise level throughout the day, evening and night, to which a citizen is exposed over the period of a year.
0 0,01 0,02 0,03 0,04 0,05 0,06 0,07 0 0,0002 0,0004 0,0006 0,0008 0,001 0,0012 0,0014 0,0016 0,0018
Stockholm Bucharest Centro
Region Águeda Extremadura Romania
PM 2 .5 a nd NO x in Eur os NM VO C in Eur os NMVOC PM2.5 NOx 12
Table 1.13 Number of people in agglomerations exposed to noise from roads (Lden) (2012)
City 55-59 Number of people in agglomerations exposed to noise from roads (Lden) 60-64 65-69 70-74 >75
Badajoz 11900 47500 23000 12700 1000
Stockholm 150000 60100 20200 3600 200
Bucharest10 469500 660900 366500 116100 17900
Source: NOISE_Database | ETC Spatial Information and Analysis (Korzhenevych et al., 2014)
Table 1.14 Noise costs in major cities of CISMOB areas (€)
City 55-59 60-64 Cost for noise exposure 65-69 70-74 Total
Badajoz 464,100 3,705,000 2,691,000 1,981,200 8,841,300
Stockholm 10,050,000 7,993,300 4,019,800 921,600 15,790,730
Bucharest 7,042,500 19,166,100 16,126,000 6,733,800 49,068,400 Source: Own calculations
1.7.5 Climate Change Costs
The valuation of climate change costs, i.e., the evaluation of the cost of GHG emissions, according to The Handbook on External Costs of Transport (Eurostat, 2016c) is connected with extremely high uncertainty due to complex global pathways of various effects and long-time horizons involved. However, for the purpose of this report the calculation of the cost of GHG emissions based on the estimates of CO2 costs11 that is provided from the Handbook
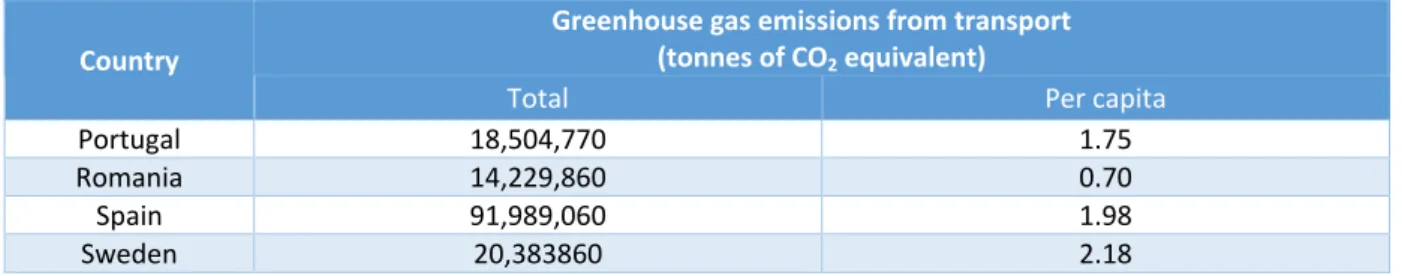
enables the cross-regional comparison. Table 1.15 provides information about the greenhouse gas emissions from transport12 in the year 2010 for the countries that
represented in CISMOB project, while in Table 1.16 results on estimation values of climate change costs in CISMOB Project areas are presented.
Table 1.15 Greenhouse gas emissions from transport (2010)
Country Greenhouse gas emissions from transport (tonnes of CO2 equivalent)
Total Per capita
Portugal 18,504,770 1.75
Romania 14,229,860 0.70
Spain 91,989,060 1.98
Sweden 20,383860 2.18
Source: Greenhouse gas emissions from transport (EC, 2016b) and own calculations
10 Data referred to 2007 results.
11 The mean of CO2 damage cost (€/tonne) for a statistical distribution based on 232 published estimates is 49. 12 Including road, rail, inland navigation and domestic aviation.
13
Table 1.16 Climate change costs in CISMOB Project areas (2010)
CISMOB Area Greenhouse gas emissions from transport (tonnes of CO2 equivalent) Climate Change Costs (€)
Stockholm 4,401,816.76 216,689,021.20 Bucharest 1,583,188.60 77,576,241.40 Centro Region 4,091,127.25 200,465,235.30 Águeda13 83,251.00 4,079,299.00 Extremadura 2,177,227.80 106,684,162.20 Romania 14,229,860 697,263,140.00
Source: Own calculations
1.8 Digital Agenda Scoreboard
The Digital Scoreboard measures progress of each country towards the European digital economy. The Digital Economy and Society Index (DESI) is a composite index that summarises relevant indicators on EU member’s digital performance and tracks their evolution in digital competitiveness. The DESI is structured around five principal dimensions: i) the Connectivity dimension that measures the deployment of broadband infrastructure and its quality, ii) the Human Capital dimension which measures the skills needed to take advantage of the possibilities offered by a digital society, iii) the Use of Internet dimension that accounts for the variety of activities performed by citizens already online, iv) the Integration of Digital Technology dimension measuring the digitisation of businesses and their exploitation of the online sales channel, and finally, v) the Digital Public Services dimension which measures the digitisation of public services, focusing on eGovernment (EC, 2016b).
Figures 1-9 – 1-12 provide information about the digital performance of the countries that represented from CISMOB Project regions and cities. In total, the top performing country is Sweden (0.672), while the bottom performing country is Romania (0.35). Finally, the country that have improved the most from 2015 to 2016 is Portugal (from 0.49 to 0.53) (EC, 2016c).
13 Based on Agueda’s population in 2011.
14
Figure 1-9 Portugal's DESI 2016 (EC, 2016c) Figure 1-10 Romania's DESI 2016 (EC, 2016d)
Figure 1-11 Spain's DESI 2016 (EC, 2016e) Figure 1-12 Sweden's DESI 2016 (EC, 2016f)
1.9 Summary of Current Baseline Situation of CISMOB
Project Areas
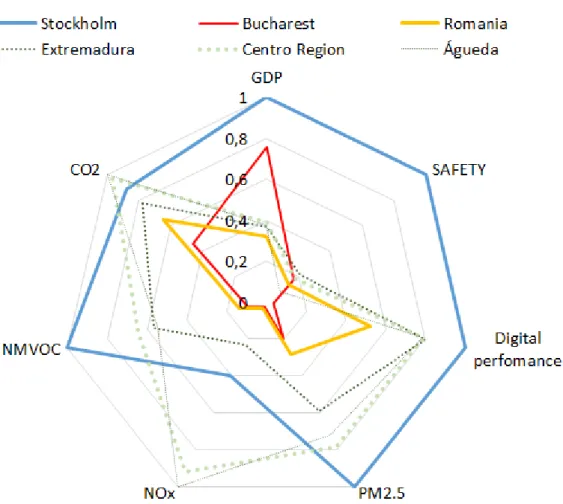
Figure 1-13 describes the current baseline situation for the regions involved in the CISMOB project regarding their GDP, safety, digital performance and air pollution. This type of plot is very important to the baseline analysis, since it permits not only to understand current state, but also future needs.
Figure 1-13 Relative comparison between CISMOB Project areas
Stockholm's baseline scenario stands out as the best among the studied regions in all parameters, except in terms of CO2 and NOX emissions, where Águeda and Centro Region, in
Portugal, perform best. Águeda and Centro Region overall analysis permits to conclude there are some major issues related to safety, especially in Águeda which presents the worst index compared to all CISMOB regions. In fact, it can be observed that all regions, with exception of Stockholm, present serious issues in terms of safety, being Centro Region and Bucharest at the same level. Concerning digital performance, Bucharest has the worst index, while Extremadura, Águeda and Centro Region present quite higher indices, followed by Stockholm. Regarding emissions, Bucharest and Romania present the worst possible scenario w.r.t. NOX, and Stockholm presents low index values, when compared to its overall
picture. In fact, Bucharest and Romania present the worst values for all traffic-related pollutants. Besides all efforts Extremadura has made in order to reduce carbon footprint, the truth is that NOX emissions continue to be a problem which requires attention.
2 Available ITS Tools to Promote
Low-carbon and Sustainable Mobility
Intelligent Transport Systems (ITS) mean applying Information and Communication Technologies to transport sector (EC, 2011b). The use of IT tools in transport has brought significant improvement in transport systems performance and is a key element in reducing carbon footprint and increasing the sustainability on an urban scale. The increasing road transport volumes in the EU are the primary cause of growing congestion and rising energy consumption, as well as a source of environmental and social problems (Urban ITS Expert Group, 2013). According to EC, ITS can contribute to the main transport policy objectives by reducing environmental impacts and save energy through better demand management. Therefore, the primary goals for urban transport should be the promotion of cleaner cars and fuels and the reduction of road accidents and traffic congestion. ITS tools can have a significant role to a cleaner, safer and more efficient transport system. EC with the ITS Directive (2010/40/EU) gave the necessary legal framework to their member states to accelerate the implementation of smart technologies in transport sector, giving the freedom to each country to decide their priorities (Yen & Lyoen, 2012).
Available ITS tools vary in technologies applied, from basic management systems such as car navigation and traffic signal control systems to more advanced applications that enables the use of real-time data and involve various technologies, such as: software and sensor technologies, wireless communications, computing technologies; floating car data/floating cellular data and sensing technologies (Singh & Gupta, 2015). A wide range of communication technologies, such as internet, cellular phones, radio, etc. are implemented in ATIS to assist road users in decision making regarding travel mode and transit route choice (Tempier & Rapp, 2011).
2.1 Multimodal Journey Planners
A Multimodal Journey Planner is a software application usually accessible on computers and smartphones that provides pre-trip travel plan information to users allowing them to use multiple modes of public and private transport (Urban ITS Expert Group, 2013). Over the past few years, many real-time trip planners were developed to overcome the possibility of inaccurate travel plans by taking into account delays caused of accidents, traffic congestion etc. Multimodal Journey Planners, in order to promote sustainable mobility and the use of public transport, provide door-to-door routing with visual maps, information on how to change between modes and allow commuters to easily book and pay for their journey (e.g. with the use of the application or by providing integrated tickets).
Multimodal journey planning systems and services are usually operated by transport authorities or city regions in a small scale (cities) or in a bigger scale (countries). There is also
an alternative approach, where city authorities, governments, transport service providers and network and fleet operators provide their own data under a standardised data exchange format and allow private companies to use it in order to develop applications for journey planning like in Trafiklab, Stockholm (Sweden).
Well known examples of journey planners are: • Destineo (France),
• FromAtoB (Europe),
• Google Transit (with varying coverage around the planet),
• MOTUS (Milan, Italy, a real-time information system for public transport in case of delays and service disruptions),
• Onlymoov (Lyon, France), • Rome2rio (international),
• Trafiken (for specific cities in Sweden),
• Transport for London (London, United Kingdom), • Wisetrip (international).
2.2 In-Vehicle Information Systems
Due to the increasing problems of traffic congestion in urban areas, information and communication systems are increasingly present in road vehicles. In-vehicle Information Systems (IVIS) include navigational and traffic information systems, warning and emergency help systems and can provide drivers with information such as road and traffic conditions, navigation information, emergency road conditions etc.
Real-time traffic information and navigational systems could promote fuel-efficient driving and reduce travel times. Drives base their route choices on real-time and accurate information about traffic conditions and road incidents that could cause delays. Real traffic information on road hazards ahead could reduce accidents, as it could provide type and location of incidents, inform about dangerous road conditions, and suggest alternative safer routes. Recent initiatives focus on developing a new approach called “eco-routing” that provides information about routes that require least amount of fuel and/or produces the least amount of emissions (e.g., MyFord Touch, Garmin, etc.). The aforementioned systems are usually provided form the carmakers and data is collected from road sensors, transport authorities, etc.
2.3 Smart Ticketing
Smart ticketing systems are recently gaining attention as new technologies that can improve overall efficiency, level of service and attractiveness of public transport. Nowadays electronic ticketing schemes can easily be used through smart cards of mobile phones, although they are limited geographically inside a metropolitan area. The implementation of smart ticketing systems across Europe can contribute to the overall improvement of public 18
transport and to the political goal of developing a sustainable transport policy (AECOM, 2011). It has the potential to achieve a significant modal shift from private cars and resulting in reducing congestion, noise pollution and vehicle emissions and in a lower carbon footprint (EY, 2014). In London, the introduction of the Oyster Card in 2003 has contributed to the increase of the distances travelled on public transport by 45% between 2000 and 2010 (Urban ITS Expert Group, 2013).
However, the overall vision of the development of smart ticketing schemes should be the possibility of users to combine trips and services, enabling interoperability between different transport modes with the same ticket or with different tickets on the same smart support system (Urban ITS Expert Group, 2013). The integration of smart ticketing into Multimodal Journey Planners could promote the use of public transport even more. The use of internet tools and information services for providing real-time information to commuters could support the vision of smart ticketing by improving the travel experience. The aim of I integrating ticketing is to encourage people to use public transport by allowing them to change transport modes easily and by increasing the efficiency of the services.
Furthermore, cities in order to enhance the use of smart ticketing, should offer an attractive and simple system, combined with reasonable prices and easily accessible with sales points distributed throughout the city or through internet and mobile phones (TNS Opinion & Social, 2014). Best practises in the area of smart ticketing are listed below:
• BOB Card (Bremen, Germany), aims at non-frequent public transport passengers and allows users easy access to public transport without the need for prepaid tickets or cash. The card is free and users get billed automatically every month based on their trips. It is smart as it provides the commuters the most economical tickets based on the built-in best-price function;
• E-ticket (Riga, Latvia), the use of the card combines travel and social services, such as entrance to schools, school catering services, the provision of free meals by the Welfare department of Riga City Council etc.;
• Octopus Card (Hong-Kong), is also used for paying goods and other services;
• OV-Chipkaart (Nederlands), is a contactless smart card system used for all public transport in the Netherlands, offering the final users the possibility to acquire different tickets that will permit them to use a combination of trips and services. The card gradually replaces the traditional ticketing systems;
• Mobility card (Netherlands), it is smart card providing access to several business travel options, like public transport, taxis and shared cars. This smart card is provided by a commercial organisation;
• Oyster Card (London, United Kingdom), is a smart card used on public transport in Greater London which can hold pay as you go credit;
• Mobib-pass (Brussels, Belgium), is a smart card that can be used to access public transport and hire bicycles;
• Navigo (Paris, France), is a multimodal smart card to use in public transports in Paris; • MITT (Trentino, Italy), is a smart card that can be used to access public transport and
interchange parks;
• T:card (Trondheim, Norway), it is a smart card that can be used to access buses, trams and regional coaches;
• Coimbra conVida (Coimbra, Portugal), is a multimodal smart card for travellers to have access to buses and car & park facilities. The scheme may be extended in the future to rail transport and bike/car sharing schemes;
• SL Access Card (Stockholm, Sweden), is a smart card that is used for electronic ticketing in the Stockholm county;
• Resplus (Sweden), it is a smart ticketing system that includes combined tickets for all long-distance train traffic, regional and local trains, trams and the underground as well as a broad selection of both commercial bus and boat transport. Resplus even includes taxis reserved in advance in sparsely populated areas as well as museum railways.
2.4 Real-Time Passenger Information
Travel information is a key aspect of ITS deployment in public transport. As already mentioned, the real-time passenger information systems are a common application of AVL tools. These systems can provide information about arrivals and departures times of public transport vehicles base on AVL data, through visual, voice or touchable media on street displays or available online. Even more, they could inform travellers about delays, alternative route or mode choices, the available capacity of vehicles etc. Real time information about all the available transport modes and services allows users to manage efficiently their journey by taking into account their own preferences (e.g. choosing modes with greater capacity or faster routes etc.)
Transit authorities by providing real time information to commuters about their services enhance their reliability and encourage greater use of public transport. The need for high quality and up-to-date information is essential to maintain the competitive position of public transport relative to private vehicle. IT role is to increase the availability and quality of the required data and contributes in that way to the creation of a more integrated transport system that will promote sustainable mobility.
2.5 Automatic Vehicle Location
ITS have an important role to play in modal shift, as frequent services (27%), better coverage (26%) and cheaper or seasonal ticket options (25%) are the main reasons that could affect travellers to leave their cars and use public transport (Peng, Yu, & Beimborn, 2002). Automatic Vehicle Location (AVL) is one of the emerging applications in the field of public transport that could contribute in the overall improvement of its services. They have been increasingly used during the last years by public transport authorities in fleet management and in passenger information systems as a means of tracking the locations of vehicles in real-time (Predic, Rancic, & Milosavljevic, 2010).
Tracking vehicle location is the most common function of AVL systems, giving to public transit authorities the possibility of real-time monitoring of their fleet and allow them to quickly respond to emergency situations in the field. The provision of accurate and reliable travel time and location information can also assist commuters in their travel decisions. By having knowledge of the expected arrival and departure times of vehicles, as well as on-route information can help them in gaining time savings and also result in making public transport services more attractive (Persad, Walton, & Hussain, 2006). Moreover, AVL systems have the potential to increase operational performance, reduce cost of running services and fuel demand, improve the fleet management, minimize traveling and waiting times and increase reliability by providing real-time information.
Notable examples of AVL systems in public transport services are:
• ATI - Saluzzo (Cuneo, Italy), a comprehensive public transport system combining electronic ticketing system with AVL system, managing effectively over 400 buses, • Malmö, Sweden, city buses and some regional buses were equipped with AVL units
providing its exact position and time on bus stop signs informing commuters about the exact time of their arrival,
• Park for Truro (Truro, United Kingdom), a dedicated park and ride service for people who visit city centre. Bus are equipped with AVL systems providing passengers the exact time of their arrival,
• Sabimos (Almelo, Nederlands), travel information system using AVL technologies with traffic intersection priority system, providing real-time information about trains, regional and city buses to travellers and transport companies.
2.6 Electronic Fee Collection
Urban toll schemes were developed as a measure to decongest downtown areas, while the use of Electronic Fee Collection (EFC) systems and video recognition technologies was a revolutionary step toward that target. EFC systems offer the possibility of charging road vehicles in congested urban areas in a flexible way by electronically debits the accounts of the passing vehicles owners, aiming at eliminating the delay on toll roads.
The implementation of EFC systems could contribute in improving the speed and efficiency of traffic flows, travel time savings and reducing congestion and air pollution (EC, 2008). Moreover, they could play an essential role in the greening of transport as a way to influence traffic demand (Evenepoel, Van Ooteghem, Verbrugge, Colle, & Pickavet, 2014). The main technologies used in EFC today across Europe today are the dedicated short range communications (wireless communication channels specifically designed for automotive use) and the video-based charging, which recognise the plate number of the vehicle automatically. Types of EFC are the Open Road Tolling, which allows the toll collection without the use of toll booths and the GNSS (Global Navigation Satellite System) Tolling with the use of sensors inside vehicles allowing tolling by distance. Examples of European EFC are:
• AutoPass (Norway), uses electronic radio transmitters, allowing road tolls collection automatically from cars,
• Congestion Charge (London, United Kingdom), launched in 2003 and combined with the introduction of 300 extra buses,
• Milano Area C (Milan, Italy), a combined Low Emission Zone and urban road charging scheme, where vehicles entering the Area are detected by a system of 43 electronic gates equipped with Automatic Number Plate Recognition) technology, • Stockholm Congestion Charge (Stockholm, Sweden), payment is allowed by direct
debit triggered by the recognition of the on-board electronic tag that is loaned to drivers,
• Via Verde (Portugal), the first EFC system that was applied in a whole country.
2.7 Smart Parking
Smart parking Systems can improve the traffic flow, reduce congestion and fuel emissions, and contribute to the more efficient parking space management by helping to locate available on street parking places. Drivers searching for a vacant parking spot is an important factor to traffic congestion (up to 30%), while vehicles stuck in traffic result in air pollution and greenhouse gas emissions (ITS America, 2013). The more efficient approach in the management of street parking can minimize the need for investments in infrastructure and improve the use of the existing transport systems. Current transportation infrastructure and car parking facilities are unable to deal with number of vehicles on the streets and the extensive deployment of smart parking systems could be a key tool to reduce carbon footprint and improve sustainable mobility in urban areas, as they reduce parking’s environmental footprint (Evenepoel et al., 2014). With the use of smart parking applications drivers could easily be guided to empty slots saving time and fuel, through a mobile app. Sensors technologies are currently widely applied in smart parking systems as is entirely placed underground and do not interfere with road users or suffer from vandalism or extreme weather conditions. The sensors are able to detect the presence of vehicles and to inform the driver about the nearest available parking space. Although, the use of these systems are highly employed because of their high performance among operators of off-street parking lots, city wide monitoring of on-off-street parking space however is not as common (Ranjini & Manivannan, 2013) as they consume a significant amount of power to transfer the information (Busher, Doody, Webb, & Aoun, 2014) and require higher deployment costs. Below are listed some notable examples:
• SPIN (Street Parking Information Network) is an on-street smart parking solution from VehicleSence for parking management systems. SPIN provides both real-time and historical information on parking occupancy, turnover, and other information that allows parking operators to better manage their systems.
• Another approach in infrastructure-based sensor system is the Siemens Integrated Smart Parking Solution. Siemens developed an integrated smart parking system that can support multiple applications such as traffic and light management. The system 22
also allows you to have a clear picture of the available parking places and for how long each space has been occupied for.
• Parker is one of the various mobile applications developed by Streetline, a smart parking company. The application helps the user to find vacant parking spaces with real time information and also provide directions to return back to your vehicle. • SFpark (San Francisco, United States) is another initiative of smart parking that takes
advantage of sensor and wireless communication technologies to collect and share real time information about the number and location of available parking spots. It uses innovative technology and advanced pricing strategies to reduce circling and double-parking in congested areas. SFpark has significant impact in dealing with phenomena of overcrowding or low occupancy blocks. (Hanfried et al., 2013).
2.8 Traffic Signal Control
Traffic Signal Control Systems were one of the first traffic management solutions used in urban areas. They function were based on fixed cycle times with their initial role inevitably limited in separating conflicting movements at individual junctions. The introduction of advanced technologies enables the development of features such as the use of traffic data to optimise traffic flow, public transport prioritization and the control and management of a wider network area.
Traffic Signal Control Systems can contribute in improving vehicle journey times, reducing congestion, and promote the use of public transport, while the use of floating vehicle data and cellular data could minimize the need for road infrastructure (e.g. detectors) (Hanfried et al., 2013). The most two common traffic management strategies are the dynamic control and the adaptive traffic control. In the first occasion, based on data from the detectors, traffic control centres can change the signal timing and phasing within the time limits of the programme giving priority to the lanes that are experienced heavy traffic. On the latter occasion, traffic signal timing is continuously adjusting based on real traffic demand, changing also the green time to each approach from cycle to cycle.
2.9 Pollution Monitors
The last few years a new approach in traffic management is employed aiming at optimizing traffic flow and minimizing air pollution. This innovative solution deploys air quality monitoring systems to measure air pollution and provide traffic management authorities with real-time data about vehicles emissions. The use of pollution monitors contributes in developing strategies to alleviate congested urban areas by redirecting traffic away from those areas (Edwards & Evans, 2010).
The data collected from pollution monitors except of assisting transport authorities in deploying informed traffic strategies, can also influence transport policies, governments priorities and helping local authorities meeting their policy targets (Edwards & Evans, 2010). Notable examples of using pollution monitors for traffic management are: i) the Swansea 23
Project (Swansea, United Kingdom) aimed to develop a working traffic emissions forecast model (Nowcaster) that would have the ability to estimate air quality conditions in advance, contributing in a more efficient traffic management control and (Edwards & Evans, 2010), ii) Leicester Area Traffic Control Centre (Leicester, United Kingdom) which deploys 13 pollution monitors as traffic management tool (Andersen & Muhammed, 2013).
2.10 Automatic Incident Detection
Automatic Incident Detection (AID) technologies have the ability to provide accurate and real time information about road incidents using radar systems or electromagnetic loops and dedicated algorithms, which deploy video cameras or image analysis. The use of AID systems in transport systems can enhance road safety and improve traffic flow by tracking vehicles position immediately and informing transport authorities to deal with the situation and ensuring the emergency services would arrive on time.
Highway incidents can cause injuries, fatalities, increase traffic congestion and environmental pollution. The deployment of AID in highway management systems permits to improve operators’ response times and save millions in terms of delay and damage. The deployment of AID system in the Limfjordstunnel in Aalborg (Denmark) improved the traffic flow and reduced travel time by detecting immediately stopped or slow driving vehicles inside the tunnel and larger objects on the pavement (Andersen & Muhammed, 2013), while the Video-based Automatic Incident Detection System in the Clem Jones Tunnel (Brisbane, Australia) as a part of the CLEM7 project (a 6.8 km toll way) contributed to reduce travel times by up to 30 percent (Gelencser, Hopkin, Tindall, & Francsics, 2010).
2.11 Cooperative Vehicle Systems
Cooperative Vehicle Systems are currently the main direction towards the future of ITS. Cooperative Intelligent Transport Systems (C-ITS) enable the direct interaction between vehicles, road infrastructure and transport authorities, allowing them to share data and information. This cooperation is empowered by mobile communication networks and aims at improving road safety, transport system efficiency, increasing sustainability and reducing air emissions.
The development of cooperative vehicle systems is also essential to increase the safety regarding the full integration of automated vehicles into transport systems, while major areas of ITS such eco-driving and dynamic passengers information could take advantage of the new capabilities (EC, 2016a). The possibilities that will arise of their instalment, except the introduction of new innovative technologies, include also the more effective use of existing ITS. Cooperative vehicle systems can deploy various services such as hazardous location notifications, signage applications, navigation systems, traffic and parking information etc. (Anderson et al., 2016). Examples of cooperative vehicle systems are the truck platooning, emergency braking, optimal speed advice, etc.
A few years ago, an innovative C-ITS was implemented in Verona (Italy), aiming at improving traffic management and contributing to less congestion and air emissions. A traffic light assistant application was developed, which can be easily downloaded in a smartphone or installed into the on-board unit of any vehicle. The application by communicating with the infrastructure could provide the drivers with information regarding the time-to-green and speed advice to avoid stop and start at traffic lights.
2.12 Automated Vehicles
In recent years, research focus on the development of vehicles that would take full advantage of the capabilities that are offered from the available ITS tools. Automated vehicles deploy a wide range of technologies and services as their function based on informed decision after exchanging data with other vehicles, infrastructure, or traffic centres. These technologies are able to guide the vehicles with minimal or no driver effort providing increased safety and mobility and environmental benefits, as the driving would be more secure, efficient and environmentally friendly. Among the anticipated benefits of automated cars would also be the reduction of road accidents and traffic congestion, the increase of traffic flow, the lower fuel consumption, the travel time savings, etc. (García-Palomares, Gutiérrez, & Latorre, 2012).
Automated vehicles have the potential to change drastically transport systems. These technologies are also find application in public transport. For instance, CityMobil2 was a research project co-funded by the European Commission, designed to support current public transport systems. The project has conducted pilot programs of their driverless electric shuttles in urban areas, offering rides to travellers to bus stations, in order to continue their journey.
2.13 Bicycle Sharing Schemes
In recent years, transport planners and policy makers in order to achieve a modal shift from motorized transport to more environmentally friendly ways have set the promotion of cycling as a top priority (Heinen, van Wee, & Maat, 2010). Bicycles could be an alternative transport choice for daily commuters and a low-cost measure to alleviate transport issues, as their use contribute in reducing motor traffic volumes, less traffic noise and pollution, fewer traffic jams etc. However, only a small proportion of people choose to use a bike to cover their daily mobility needs due to their many disadvantages e.g. riding a bicycle is extremely dangerous and inconvenient especially during rush hour traffic and is not recommended in adverse weather conditions. Moreover, cycling requires a great physical effort and is slower than a private car or public transport, while the distance that a rider can travel depends greatly on these two factors (Olson, Hodges, & Bouget, 2015).
Over the last few years, many cities have launched bike sharing programs in almost every region of the world, although until now they failed to fulfil their primary goal which was to establish cycling as a daily transportation mode. On the other hand, electric bicycles are a 25
promising measure, as they could deal with various factors that limit traditional share systems such as the distance that can be covered, steep terrain, dispersed land use patterns, potential users’ fitness and comfort levels or the level of effort that needs to be expended in making a trip (INE, 2014). A bike sharing scheme usually includes a series of ITS applications such as smart card access, automatic docks and stations, real time information about number of bicycles in use, capability of stations, etc. Below are listed some notable bike sharing programs:
• Vélib (Paris, France) is a smart bike-sharing system with over 23,600 bikes and almost 1,800 stations. The system is easily accessible as bike stations are found every 300 metres and you can buy tickets online or at any station. The system is self-service, available 24 hours a day, with on-screen instructions and the possibility to return the bicycle in any station making it very attractive to commuters.
• Bicing (Barcelona, Spain) is a highly accessible bike sharing service and an important part of the public transport system in the city of Barcelona with around 6,000 bikes, 400 stations every 300 m and the possibility of using also electric bikes. The system provides real-time information on bike availability on the internet and gives you the flexibility to return your bike in every station.
• OV-Fiets (Nederland) is a bike rental scheme running by the Dutch national train company and the users’ card can be combined with public transport card. The service gives you the possibility of using bicycle to reach or leave stations. There are more than 300 rental locations, at many train stations, bus or tram stops and in several cities.
• Styr & Ställ (Gothenburg, Sweden) is a bike sharing service, which is a complement to the public transportation of Gothenburg city. The system is very easy to use, as they are on screen instructions in every station and to return the bike the user has just to use the nearest terminal in his destination.
• Velo’v (Lyon, France) is a self-service bike system with 4,000 rental bikes found at 348 stations in Lyon and Villeurbanne. The service is available 24/7, 365 days a year and each station has a terminal with a touch screen with instructions. The system is using smart technology in order to limit incidents of theft and vandalism, the service is available also through a smartphone application and the user can optimize his route with real time information.