Distance Ratio: an exploratory application to compare
complex networks
Nuno Caseiro1, Paulo Trigo2
1Instituto Politécnico de Castelo Branco/Instituto Universitário de Lisboa - ISCTE, LabMAg,
Portugal ncaseiro@ipcb.pt
2 Instituto Superior de Engenharia de Lisboa; LabMAg, Portugal
ptrigo@deetc.isel.ipl.pt
Abstract. This paper describes an experimental application of the distance ratio measure used to compare individual networks among themselves and to analyze the aggregated network representing the group mental model from the field of emergency management.
The data was obtained by surveying a group of Civil Protection graduates and aggregating all the answers (shared mental model). The data allowed us to deepen the analysis of the resulting network in order to research for differences among networks.
Keywords: complex networks, network comparison, distance ratio, emergency management, mental models
1
Introduction
The study of complex networks are an important tool in different fields of knowledge, with applications from social relations to power grids, from genes and proteins to text analysis. [1–6]
The usual approaches are centered in the statistical proprieties of one network and its components: the nodes and the links between them (edges). In this case, complex networks are taken as individual structures but they are normally dynamic by nature and it’s important to understand the differences or similarities among two or more.
In general, we can compare networks by means of: (i) global property statistics, such as degree distribution, betweenness centrality, assortativity, and clustering coef-ficient; (ii) subgraph enumerating, such as over- and under-represented motifs than in randomized networks, graphlet degree distribution, joint degree correlations of sub-graph, and trained subgraph feature. Each of comparison method has specific carac-teristics, advantages and disadvantages.[7]
When approaching two or more networks that share some elements among them, are taken in several moments in time or in different physical settings the current pro-posals are limited. Two networks even with different substructures can exhibit some similitude regarding global properties. [7]
Some examples of this situation are the network formed by words and phrases in two books in a domain or written by the same author, citations in a field of knowledge in two different years or power grids in different regions (with same equipment). In these cases comparing can be a useful approach to detect differences and similarities between the existing elements and their links.
With the present work we propose to address this gap by applying a measure, Dis-tance Ratio inspired in system analysis.[8] In this context a system is represented by elements connect by causal relations with positive or negative impact within them. It is possible to identify the existence of self-loops, when an element has an impact on itself. But irrespective of the classification, the emerging representation is a different form of network, so our research will test its suitability for complex networks applica-tion.
As a practical application the presented indicator (Distance Ratio) is applied to compare different networks representing mental models of emergency managers. These structures are obtained by relating concepts of this field gathered by inquiry from practitioners. It can be used to verify differences among a shared mental model and the individual ones [9], [10] or to test the similarities between professionals of different emergency agents.
In this application, obtained results can be useful for support training and recruit-ment decisions since they give an indicator of closeness between different recruit-mental models.
As a comparative indicator and methodology it can be extended to contexts like plagiarism, when applied to compare the network of words between different docu-ments or other settings where comparison is required.
1.1 The distance ratio
In the literature there seems to lack a measure that can be used for the purpose of comparing complex networks. We will use an indicator, the Distance ratio (DR), that in its original application, in the domain of system dynamics, was used to calculate two causal maps similarity. Causal maps in systems dynamics are a set of elements that influence each other in a sequence and with a level of intensity. In the language of system dynamics there are more than variables and links. It is possible to identify other constructs such as delayer links, non-linear links, stock variables or rate varia-bles and also feedback loops. [11] The distance ratio is used to compute to what ex-tend two networks are close in terms of their constituents. Thus, an exex-tended matrix A and B is used, where aij and bij are their elements. The adjacency matrix, with n
varia-bles, will form a n x n matrix with the strength of the links as cell values [12] or a binary representation (0/1) of the existing links if there is no information about weights.
Since causal maps can be seen as a network where an element can be represented as a node, the influence to other elements are links and the level of intensity is the weight of that link, it is our belief that the DR measure can be extended and applied to complex networks.
∑ ∑ ( ) ( ) ( ( ) ) (( ) ( )) ( ) Where ( ) { ( ) ( ) | | | | ( ) and ( ) { ( )
The result obtained by the formula can vary between 0 and 1, where 0 means com-pletely similar and 1 totally different (distant).
A group of parameters are denoted by the Greek letters (α,β,γ,δ,ε) and are used to adjust the formula to different contexts. The α parameter can be set to 0 or 1, whether self-loops are allowed or not. To reflect differences in weight between nodes in the networks we pass the max weight to parameter β.
ε accounts for the number of polarities in the matrix and it can take the value 1 or 2 (one polarity - only positive or negative or two polarities – positive and negative).
If δ=0, we do not differentiate situations where different weights create the same difference values. For instance, a difference between a weight of 4 and 1 is the same as for -2 and 1 as per equation 2. In the latter, since a negative and a positive value is involved, a value δ is added.
The parameter γ is set for how to interpret matrix cells for which one of the maps does not have an edge because there is a mismatch of nodes. In the context of concept maps the inexistence of a node is a result of the one that creates more difficulties. If we do not want to deduce anything from the absence of nodes, we will set γ=0. If we wish to assign meaning to the fact that one person as mentioned one concept (node) and another does not, the value of γ=1 signaling that this difference should be taken into account.
1.2 Mental models
Mental models are conceived of as a cognitive structure that forms the basis of rea-soning and decision making, and can be seen as a network of associations between concepts in an individual’s mind. Mental models have been described as a form of intuitive knowledge that serve as a frame of reference for interpretation of the world which forms the bases for reasoning and working with problems.[13]
They are built by individuals based on their personal life experiences, perceptions, and understanding of the world. Mental models provide the mechanism through
which new information is filtered and stored. However, the ability to represent the world accurately is always limited and unique to each individual. [14]
There a variety of techniques for eliciting mental models, ranging from brainstorm-ing, to interviews or text analysis. They include concept mappbrainstorm-ing, word association techniques, ordered recall, card sorting procedures, paired-comparison, and the or-dered tree technique. [12], [15], [16]
They can be applied both individually or to a group of people. [10], [15] Most of procedures used are based on the assumption that an individual’s mental model can be represented as a network of concepts and relations. [14]
When working together people must share a part of the mental model to deal effec-tively with each other. Team mental models promote understanding among team members regarding information requirements, the need for communication and coor-dination. [17] In the case of emergency management cycle the individuals involved need to have a common mental structure to deal with information issues. The lack of a common mental model is a common problem referred to in emergency management literature [18–20].
2
Methodology
In order to compute the DR we asked a group of graduate students to identify, or-ganize and relate the concepts they recognized in the emergency management field.
Each element of the survey group was asked to indicate a new level of concepts re-lated to a starting concept. In this situation the initial concept was “Civil Protection”. For each of the concepts in the new group, a new sublevel of concepts was requested. By iterating on the above mentioned steps, it is possible to build several levels of inter-related concepts (as represented in Figure 1). An individual structure is elicited representing the mental model of concepts of the respondents with the respective relations. This structure is representable as a network.
Fig. 1. Model of data gathering.
As the concepts are words, the responses were verified for major spelling mistakes and typos. This is an important step to ensure that the same concept indicated by two different respondents was not coded as different ones because of a mistake. Finally,
individual networks were grouped and processed to create a unique network with all the contributions.
This grouped network can be seen as a shared mental model [10]. In this network, we take into account the number of times a pair of concepts was mentioned by the respondents, because this stresses the importance of that relation within the group. That total was taken as a weight of the edge between concepts.
The data was processed to transform the concepts identified in a network structure, where a node represents a concept and an edge represents a connection between two concepts. Moreover, for each pair of nodes the respective weight was indicated.
3
Results
We compute the DR for each of the networks among subjects. For the current ap-plication the parameters in the formula were set to:
α =1, meaning self-loops were not taken into account, because in the case of com-plex networks a node do not link to itself directly1;
β=max weight, in the present case the value is one, meaning only that there is a link between two nodes;
γ=1, because we want to take into account the fact that one network has a node and another has not, thus valuing the eventual link that can exist;
δ=0, not adding any value to differences;
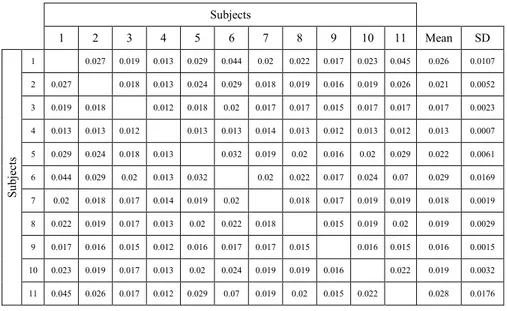
ε=1, because in this case we only have one polarity. All link weights are positive. Table 1. Distance Ratio between subjects.
Subjects 1 2 3 4 5 6 7 8 9 10 11 Mean SD Su bj ec ts 1 0.027 0.019 0.013 0.029 0.044 0.02 0.022 0.017 0.023 0.045 0.026 0.0107 2 0.027 0.018 0.013 0.024 0.029 0.018 0.019 0.016 0.019 0.026 0.021 0.0052 3 0.019 0.018 0.012 0.018 0.02 0.017 0.017 0.015 0.017 0.017 0.017 0.0023 4 0.013 0.013 0.012 0.013 0.013 0.014 0.013 0.012 0.013 0.012 0.013 0.0007 5 0.029 0.024 0.018 0.013 0.032 0.019 0.02 0.016 0.02 0.029 0.022 0.0061 6 0.044 0.029 0.02 0.013 0.032 0.02 0.022 0.017 0.024 0.07 0.029 0.0169 7 0.02 0.018 0.017 0.014 0.019 0.02 0.018 0.017 0.019 0.019 0.018 0.0019 8 0.022 0.019 0.017 0.013 0.02 0.022 0.018 0.015 0.019 0.02 0.019 0.0029 9 0.017 0.016 0.015 0.012 0.016 0.017 0.017 0.015 0.016 0.015 0.016 0.0015 10 0.023 0.019 0.017 0.013 0.02 0.024 0.019 0.019 0.016 0.022 0.019 0.0032 11 0.045 0.026 0.017 0.012 0.029 0.07 0.019 0.02 0.015 0.022 0.028 0.0176
1 We recall that the Distance Ratio formula is adapted from systems dynamics where
The values presented in Table 2 point to a low distance ratio since they are very close to 0, the lowest limit, meaning that networks are very similar among them. This can be due to the nature of the sample used. The subjects were all graduate students, with similar training and level of experience.
In spite of this fact, some differences can be perceived between subjects with some of them with more proximity with the others (subject 4) and lower deviation. Or with more relative distance (subject 6).
Table 2. DR from aggregated network and individual ones. Subjects 1 2 3 4 5 6 7 8 9 10 11 Mean SD G ro up ed N etw or k 0.0 05 5 0.0 05 5 0.0 05 6 0.0 05 6 0.0 05 4 0.0 05 4 0.0 05 9 0.0 05 5 0.0 05 5 0.0 05 6 0.0 05 2 0.0 05 5 0.0 00 1
If we compare the subjects with the group network with the starting concept (the aggregated network mentioned in table 1). We find a mean DR of 0.005 (with stand-ard deviation of 0.0001). The value is lower than the values obtained between subjects (with mean of 0.02).
An possible explanation to this is that the aggregated network is constructed by adding all the individual contributions, therefore when we perform the distance ratio between the aggregated network and the individual ones, each one finds a “piece” of itself in the group network thus having a lower distance.
4
Conclusions
Network analysis seems to be a valid tool to study mental maps since the concepts and their relationships can be represented by nodes and links.
The application of the Distance Ratio to complex networks seems feasible but re-quires a broader sample that can increase potential differences. The sample used led to a low Distance Ratio, meaning that the mental models were very similar within the group under study. The distance ratio approach can be refined to take into account the ranking of concepts (node weight) in the case of aggregated networks.
Since this is an exploratory work that used a sample of graduates as the source of concepts, the computed differences between mental models were not very sharp. Future work will try to replicate this approach with professionals in the Civil Protec-tion field, from different agencies and explore if greater dissimilarities exist.
The understanding resulting from that may be helpful to take decisions regarding training improvement and information sharing among individuals or groups in key organizations in the field.
5
References
[1] C. T. Butts, “Revisiting the foundations of network analysis.,” Science (New York,
N.Y.), vol. 325, no. 5939, pp. 414–6, Jul. 2009.
[2] M. E. J. Newman, “The Structure and Function of Complex Networks,” SIAM Review, vol. 45, no. 2, p. 167, 2003.
[3] S. Boccaletti, V. Latora, Y. Moreno, M. Chavez, and D. Hwang, “Complex networks: Structure and dynamics,” Physics Reports, vol. 424, no. 4–5, pp. 175–308, Feb. 2006. [4] S. N. Dorogovtsev, A. V. Goltsev, and J. F. F. Mendes, “Critical phenomena in
com-plex networks,” Networks, pp. 1–79.
[5] S. N. Dorogovtsev and J. F. Mendes, “Language as an evolving word web.,”
Proceed-ings. Biological sciences / The Royal Society, vol. 268, no. 1485, pp. 2603–6, Dec.
2001.
[6] M. Rubinov and O. Sporns, “NeuroImage Complex network measures of brain con-nectivity : Uses and interpretations,” NeuroImage, vol. 52, no. 3, pp. 1059–1069, 2010. [7] W. Li and J.-Y. Yang, “Comparing networks from a data analysis perspective,”
Com-plex Sciences, no. ii, 2009.
[8] M. Schaffernicht and S. N. Groesser, “A comprehensive method for comparing mental models of dynamic systems,” European Journal of Operational Research, vol. 210, no. 1, pp. 57–67, Apr. 2011.
[9] K. Langfield-Smith and A. Wirth, “Measuring Differences between Cognitive Maps,”
The Journal of the Operational Research Society, vol. 43, no. 12, pp. 1135–1150,
1998.
[10] J. Langan-Fox, “Analyzing shared and team mental models,” International Journal of
Industrial Ergonomics, vol. 28, no. 2, pp. 99–112, 2001.
[11] M. Schaffernicht, “Detecting and monitoring change in models,” System Dynamics
Review, vol. 22, no. 1, pp. 73–88, 2006.
[12] L. Markóczy and J. Goldberg, “A Method for Eliciting and Comparing Causal Maps.,”
Journal of Management, vol. 21, no. 2, p. 305, Jun. 1995.
[13] G. J. Muñoz, R. M. Glaze, J. Winfred Arthur, S. Jarrett, and J. McDonald N., “Driving Mental Models as a Predictor of Crashes and Moving Violations,” in 26 th Annual
Conference of the Society for Industrial and Organizational Psychology, 2011.
[14] N. A. Jones, H. Ross, T. Lynam, P. Perez, and A. Leitch, “Mental Models : An Inter-disciplinary Synthesis of Theory and Methods,” Ecology And Society, vol. 16, no. 1, 2011.
[15] K. M. Carley and M. Palmquist, “Extracting, Representing, and Analysing Mental Models,” Social Forces, vol. 70, no. 3, pp. 601–636, 1992.
[16] M. K. Kim, “Cross-validation study of methods and technologies to assess mental models in a complex problem solving situation,” Computers in Human Behavior, vol. 28, no. 2, pp. 703–717, Mar. 2012.
[17] H. Sayama, D. L. Farrell, and S. D. Dionne, “The Effects of Mental Model Formation on Group Decision making: An Agent-based Simulation,” Complexity, vol. 16, no. 3, pp. 49–57, 2010.
[18] Y. Kai, W. Qingquan, and R. Lili, “Emergency Ontology construction in emergency decision support system,” 2008 IEEE International Conference on Service Operations
and Logistics, and Informatics, vol. 1, pp. 801–805, Oct. 2008.
[19] D. Alexander, Principles of emergency planning and management. Oxford University Press, 2002, p. 340.
[20] B. D. Griffin, “Emergency Management Terms and Concepts,” Higher Education, pp. 1–8, 2009.