ProteInOn: A Web Tool for Protein
Semantic Similarity
Daniel Faria
Catia Pesquita
Francisco M. Couto
Andr´
e O. Falc˜
ao
DI–FCUL
TR–07–6
March 2007
Departamento de Inform´
atica
Faculdade de Ciˆ
encias da Universidade de Lisboa
Campo Grande, 1749–016 Lisboa
Portugal
ProteInOn: A Web Tool for Protein Semantic Similarity
Daniel Faria
[email protected]
[email protected]
Catia Pesquita
Francisco M. Couto
[email protected]
[email protected]
André O. Falcão
Departamento de Informática, Faculdade de Ciências da Universidade de Lisboa Campo Grande, 1749-016 Lisboa, Portugal
ABSTRACT
Bioinformatics arose from the need to manage and extract knowledge from the vast amount of sequence data generated by automated Molecular Biology techniques. One impor-tant step for this was the development of the Gene Ontol-ogy (GO), which provided a unified and structured vocabu-lary to describe proteins, and also a background to compare them, contributing to the integration of knowledge from the sequence level to the system level. Several approaches have been proposed to measure protein similarity in this context, but there are few tools for this purpose available to the sci-entific community.
We present a new web tool, ProteInOn, focused on calcu-lating GO-based protein semantic similarity. It features a stepwise query selection menu, which together with the pos-sibility of selecting results as input for new queries, makes it flexible and customizable. It also incorporates data on pro-tein interactions, allowing for comparative studies between protein similarity and interactions.
The tool implements a preliminary weighting factor which increases the specificity of existing semantic similarity mea-sures, and a score for measuring the representativeness of a GO term within a set of proteins.
ProteInOn is available at:
http://xldb.fc.ul.pt/biotools/proteinon/
Keywords
Protein Similarity, Semantic Similarity, Gene Ontology, Bioin-formatics
1.
INTRODUCTION
In the last decade Molecular Biology has generated a vast amount of data in the form of gene and protein sequences. However, the annotation of these sequences is lagging far behind, since there are still no experimental techniques to characterize genes/proteins to match the high-throughput of the sequencing techniques [8]. Bioinformatics has been used to bridge this gap, mainly through the use of sequence simi-larity to extrapolate annotations from characterized proteins to similar uncharacterized ones. However, this approach has limitations, having been estimated that up to 30% of the an-notations made by sequence similarity may be inaccurate [6]. The knowledge contained in the scientific literature is also an important source for protein annotation, but being written in natural language, it is difficult to explore computation-ally [17, 4]. This has lead to the development of structured and controlled vocabularies (BioOntologies) to describe pro-teins with specific terms which facilitate computational
ap-proaches [22].
Protein comparison is also essential to integrate the knowl-edge from the sequence level to the system level. Sequence similarity, pattern discovery and structural comparisons are among the most common approaches for this purpose, but it is also possible to compare proteins based on their an-notations within a BioOntology [14]. This type of compar-ison, called semantic similarity, is based on the structure of the BioOntology and the relations between its terms, fo-cusing either on a structural comparison or more frequently on the semantic similarity between the terms themselves. The main advantage over the traditional sequence compari-son approach is that it captures similarity between proteins with common functional aspects even if they have low se-quence similarity.
Given that Ontologies can be represented as graphs, there are two main approaches to quantify the semantic similarity between their terms: edge-based and node-based. Edge-based (or conceptual-distance) methods calculate distance between terms as the minimum number of edges between them [16], whereas node-based (or information content) meth-ods focus on the amount of information conveyed by the terms themselves, which can be captured through their us-age frequency within the corpus [18]. The latter are prefer-able in Ontologies where term specificity is not well corre-lated with term depth, which is the case of most BioOntolo-gies. Despite this, the graph structure can still provide rele-vant information, which has lead to the development of hy-brid measures that integrate information content with con-ceptual distance [13, 10].
Being one of the main BioOntologies for annotating pro-teins, the Gene Ontology (GO) has been frequently used as a background for protein semantic similarity, mainly by combining the similarities of the proteins’ GO terms. Sev-eral methods have been used for this combination, including the average, the maximum and the best match average [15, 5, 21, 20]. GO based semantic similarity has been measured with both node-based and hybrid approaches, and correlated with sequence similarity, gene expression and protein family [15, 21, 5]. Among other applications, it has been used to predict and validate protein functional aspects, interactions and cellular location, as well as to validate other comparison methods [7, 24, 12, 1].
Here we present ProteInOn, an online tool for exploring and comparing proteins within the context of Gene Ontology. It implements several semantic similarity measures for calcu-lating protein and term similarity, and combines information on protein-protein interactions and GO term assignment for
protein characterization. It was designed to be simple to use and flexible, in order to be useful for researchers with varied backgrounds and different biological questions.
This paper is organized as follows: section 2 presents the data sources used and the ProteInOn database; section 3 explains the similarity measures used and their implemen-tation; section 4 describes the ProteInOn interface; and sec-tion 5 states the conclusions.
2.
DATABASE
The ProteInOn database is an integrated database of pro-teins and GO terms, which is structured in a relational model (see Figure 1), and implemented in MySQL. The main entities are protein and GO term, and the main re-lationships between them are protein-GO term annotations, protein-protein interactions and GO term-GO term ances-try. The data corresponding to these entities and relation-ships is imported from four public databases:
• UniProt is the source for protein data, including ac-cession numbers, names and sequences.
• GO is the source for GO term data and also GO term-GO term ancestry relationship data.
• GOA is the source for protein-GO term annotations. • IntAct is the source for protein-protein interactions. The database is updated with an automated procedure that can be used after each new release of GO. The data is re-trieved either in XML format (UniProt and Intact) or in tab-delimited text format (GO and GOA) and processed accordingly.
The following subsections describe the data sources in more detail.
2.1
UniProt
The Universal Protein Knowledgebase (UniProt) is a unified database of protein sequence and functional data, created by joining the information in SwissProt, TrEMBL and PIR databases [23]. It aims at being a high quality database to serve as a stable, comprehensive, fully classified, richly and accurately annotated protein sequence knowledgebase, with extensive cross-references. As of December 2006, it contained 3, 801, 928 sequence records. The level of anno-tation of entries varies according to its source: while Swiss-Prot entries have extensive cross-references, literature cita-tions, and computational analyses provided by expert cu-rators, TrEMBL (Translated EMBL Nucleotide Sequence Data Library) entries are less detailed, having been created to provide automated annotations for those proteins not in Swiss-Prot.
2.2
Gene Ontology
The Gene Ontology is one of the major efforts in Molec-ular Biology for constructing an ontology of broad scope and wide applicability for annotating proteins [9, 2]. It is divided in three different aspects or GO types: molecular function, biological process and cellular location. Each as-pect is structured as a directed acyclic graph (DAG), with
nodes representing terms and edges representing the rela-tionships (is-a or part-of) between them. A term can have several parents as well as several children (see Figure 2). As of its release of November 2006, GO comprises 22, 521 distinct terms.
2.3
GOA
The Gene Ontology Annotation database (GOA) is the cen-tral source for gene/protein-GO term annotations [3]. It is committed to the comprehensive annotation of a set of disease-related gene products in human, mouse and rat species, but it also stores annotations for genes/proteins from most current biological databases (e.g. UniProt, NCBI).
Annotations in GOA have a code to indicate the type of ev-idence that supports it, which includes several experimental techniques, computational methods, literature sources and annotations inferred electronically. The reliability of the an-notation varies with the evidence code, for instance, many researchers disregard electronically inferred annotations in their studies.
Proteins can have several annotations (even within the same GO type) which represent different aspects, but many have also redundant annotations, being annotated to both a term and one or more of its ancestors, albeit with different evi-dence codes (see Figure 2). Note that ancestral terms inherit the annotations of their descendents.
In ProteInOn, we use the GOA-UniProt release, which con-tains only data corresponding to proteins present in the UniProt database.
2.4
IntAct
IntAct is an open source database and software suite for modelling, storing and analyzing molecular interaction data [11]. It is focused on the curation of protein-protein interac-tions, containing over 700, 000 binary interactions as of its November 2006 release. The data it provides is manually annotated by experts and derives from published literature to ensure a high level of detail.
The inclusion of protein-protein interactions in ProteInOn provides an interesting background for comparing protein re-lationships with protein semantic similarity, since proteins which interact with each other are likely to have similar biological process terms, and proteins sharing common in-teractors are likely to have similar molecular function terms.
3.
SEMANTIC SIMILARITY MEASURES
ProteInOn implements several measures for semantic simi-larity applied to GO, all of which are information content based, given the fact that edge-distance in GO doesn’t re-flect semantic distance.
3.1
Information Content
The information content (IC) of a term can be given by the expression:
IC(c) = − log2(p(c)) (1)
where p(c) is the probability of usage of the term in the cor-pus [18]. A term that occurs less often is considered more 4
Figure 1: Simplified UML schema of the ProteInOn Database.
The main entities are protein and GO term, with data coming from the UniProt and GO databases respectively. The key relationships are protein-GO term annotations (data from GOA), protein-protein interactions (data from IntAct) and GO term-GO term ‘is a’ and ‘part of’ relationships (data from GO also).
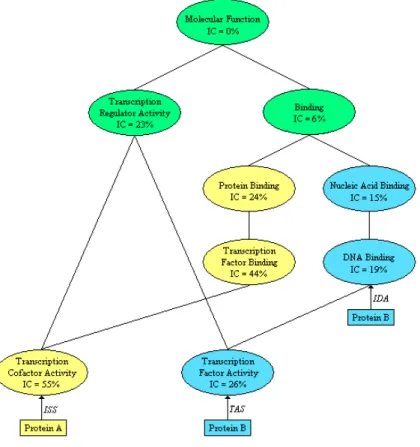
Figure 2: Fragment of the GO ‘Molecular Function’ Graph, including the information content of the terms (IC) and with annotations for two hypothetical proteins.
Arrows indicate direct annotations, yellow terms are annotated only to Protein A (directly or inherently), blue ones only to Protein B and green ones to both proteins. The figure illustrates the graph structure of GO, with examples of multiple ancestry and descendency, and the properties of GOA annotations. Protein A is directly annotated with the term ‘Transcription Cofactor Activity’ (with the evidence code ISS ) and is inherently annotated to all terms ancestral to that term. Protein B is directly annotated to two terms, one of which (‘DNA Binding’) is ancestral to the other (‘Transcription Factor Activity’) and therefore redundant. It also illustrates the notions of most informative common ancestral (MICA) and disjunctive ancestral. The MICA of the terms ‘Transcription Factor Activity’ and ‘Transcription Cofactor Activity’ is the term ‘Transcription Regulator Activity’, since it has a higher IC than all other common ancestors (terms in green). These terms have one other disjunctive ancestor, the term ‘Binding’, since the path to that ancestor is distinct from the path to the MICA.
informative and vice-versa. When applied to the Gene On-tology, the probability of usage corresponds to the frequency with which the term is annotated. The previous expression, however, doesn’t produce uniform values (in a 0-1 scale), which makes the comparison of IC values from different GO types or different versions of GO (after new annotations are added) difficult. Uniform IC values can be obtained using the equation:
ICU(c) =
IC(c)
log2N (2) with N being the total number of annotations within the same GO type.
In ProteInOn we first compute the number of annotations for each term (with and without weak evidence annotations) which requires finding both direct and inherited annota-tions. We ignore redundant direct annotations to avoid over-counting, and assume that terms with no direct or inherited annotations have one annotation for IC calculations, since otherwise the IC would not be computable (it would be the logarythm of zero). We then compute the term frequen-cies by dividing by the total number of annotations within the corresponding GO type. Finally, we calculate the uni-formized information content according to equation 2, which is stored in the database and recalculated with each update. We also extend the use of IC to compute a score which re-flects the relevance of a term within a set of proteins. Given a set of m proteins, if a term c has a probability of anno-tation p(c), then the probability that it is annotated to n proteins in that set is p(c)n. Transforming this probability into an IC value and uniformizing it leads to the equation:
ICset(c) =
n × ICU(c)
m (3)
This score is a measure of how a given term is representative of a set of proteins, since it combines the informativeness of the term itself with its frequency within that set.
3.2
Resnik’s Measure
Resnik defined similarity between two terms as the IC of their most informative common ancestor (MICA):
simRes(c1, c2) = IC(cM ICA) (4)
where c1 and c2 are the terms being compared and cM ICA
is the MICA [19] (this notation will be used throughout this section). The rationale behind this measure is that the sim-ilarity between two terms is reflected in the amount of in-formation they have in common, which is conveyed by their most specific common aspect. The more informative is the common ancestor, the greater the information shared by the terms, and consequently their similarity.
As we implement this measure using ICU values, the
simi-larity values obtained are also uniformized.
3.3
Lin’s Measure
Lin defined semantic similarity in information-theoretic terms and based on a series of assumptions following a probabilis-tic model [13]. Lin’s measure focuses on the relation between the IC of the common ancestor and that of the terms being compared, according to the equation:
simLin(c1, c2) =
2 × IC(cM ICA)
IC(c1) + IC(c2)
(5) This measure reflects how close the terms are to their ances-tor rather than just how specific that ancesances-tor is. Since it is a relative measure, it always produces uniformized values.
3.4
Jiang and Conrath’s Measure
Jiang and Conrath developed a hybrid approach to mea-sure semantic distance (rather than similarity), derived from edge-based notions with information content as a decision factor [10]. Its most common form is:
distJ C(c1, c2) = IC(c1) + IC(c2) − 2 × IC(cM ICA) (6)
where distance corresponds to the length of the shortest path between the terms (through the MICA), but with length being defined as a difference in IC rather than simply the number of edges. The authors suggest that similarity can be calculated by subtracting the maximum graph distance by this distance, which when using ICU values and after
uniformization results in the expression:
simJ C(c1, c2) = 1 + IC(cM ICA) −
(IC(c1) + IC(c2))
2 (7)
3.5
GraSM Approach
One limitation of the measures previously described, when applied to a DAG such as GO, is that only one common aspect of the terms (the MICA) is considered, regardless of how many and how informative other common aspects (an-cestors) may be. To deal with this limitation Couto et al. [5] proposed the GraSM approach, which can be applied to any of the three measures, and replaces the IC of the MICA by the average IC of all disjunctive common ancestors. Given two terms, two of their common ancestors are considered disjunctive if each has at least one path to at least one of the terms which is independent of the other, meaning that disjunctive ancestors correspond to distinct shared aspects. This approach was evaluated using protein family, and pro-duced superior results to those obtained with the unmodified measures.
3.6
Weighted Similarity Measures
Another limitation of these measures is that they are dis-placed from the graph since they do not consider the speci-ficity of the terms being compared (Resnik) or consider it 6
only in relation to the MICA (Lin, and Jiang and Conrath). The issue with this is that different term pairs with very distinct IC values can have an identical similarity value if they share the same MICA (Resnik) or are at the same dis-tance from their MICA (Lin, and Jiang and Conrath). This is specially relevant for protein similarity, where you would usually expect proteins with shared or similar specific terms to have higher semantic similarity than proteins with shared or similar very general terms.
In this context, Schlicker et al. [20] have recently proposed the relevance similarity measure, which is based on Lin’s measure, but uses the probability of annotation of the MICA as a weighting factor for graph placement.
simRel(c1, c2) = simLin(c1, c2) × (1 − p(cA)) (8)
While we agree with the necessity of a weighting factor, we found it more meaningful to use the terms themselves rather the MICA. Furthermore, we wanted a weighting factor ap-plicable to all three measures, and whereas for Lin’s measure the difference is small, using the probability of the MICA for Resnik’s measure is redundant and doesn’t solve its graph displacement. Also, applying this weighting factor when us-ing the GraSM approach would be unnecessarily complex. In ProteInOn we use a preliminary weighting factor, which combines the probability of annotation of the terms being compared.
3.7
Semantic Similarity Applied to Proteins
The most common approaches to measure protein semantic similarity are the average and the maximum of the seman-tic similarities between the proteins’ terms [15, 21]. These approaches, however, are biased and somewhat reductionist: the maximum reduces the proteins to a single functional as-pect and is biased towards high similarity values, since only the most similar term of the proteins is compared; the av-erage, on the other hand, considers the proteins as random collections of aspects and is biased towards low similarity values, by comparing all combinations of the proteins’ terms, rather than trying to match similar terms.
To illustrate this problem, consider two proteins (A and B), each with the same two completely distinct terms (t1 and t2), and another protein (C) with only one of those terms (t1). One would expect that, by sharing two terms, A and B have a higher semantic similarity than either has with C, however with both the maximum and the average all three would be equally similar. With the maximum, having a term in common is all that matters, whereas with the average it doesn’t matter that both terms are equal between proteins A and B, since the similarities between t1 of protein A and t2 of protein B and vice-versa are also averaged.
One possibility to deal with this issue is an intermediate approach: rather than computing similarities between all possible combinations of terms of two proteins, similarities are computed only for each term and the best matching term of the other protein [5]. This way, all functional aspects of each protein are considered, but only similar aspects of the proteins are matched. A single similarity score can be cal-culated with this approach through a simple or composite
average [5, 20], but for the ProteInOn tool we opted for re-turning the similarities between all the term pairs matched, since these give additional information on what aspects the proteins have in common.
4.
PROTEINON INTERFACE
The ProteInOn interface comprises a webpage implemented in PHP-HTML and a set of query processing programs im-plemented in Java. The webpage is divided into four steps: input entry, query selection, query options and results. First, it receives the input from the user and checks for its presence in the database, and then displays the available queries and options for that input. Finally, it invokes the Java program for the chosen query, which queries the database, processes the output, and parses it into HTML to be read directly into the results page (see Figure 3). Some of these results can be selected as input for new queries, which allows com-plex queries to be built through a sequential combination of simpler ones.
4.1
Input
In the input entry step, the user chooses the type of input (proteins or GO terms) and then enters up to five accession numbers of the appropriate type, UniProtKB for proteins and GO id for GO terms. This limit of five is just a com-promise with the computation resources available.
4.2
Queries
After the input is verified, the user can select one query from a list of available ones, which depend both on the type and number of inputs.
The queries for GO terms are:
• ‘get information content’ which returns a list with the accession number, name and information content of each of the terms entered.
• ‘calculate term similarity’ which is available for two or more terms only, and returns for each pairwise com-bination of the terms entered, the semantic similarity score between them.
The queries for proteins are:
• ‘find assigned GO terms’ which lists all GO terms di-rectly assigned to each of the proteins entered, and the evidence code(s) for that assignment.
• ‘find interacting proteins’ which returns a list of all proteins known to interact with each of the proteins entered.
• ‘calculate protein similarity’ which is available for two or more proteins only, and returns for each pairwise combination of the proteins entered a set of semantic similarity scores between them. These scores are simi-larity scores between each term of the first protein and the best matching (more similar) term of the second, and vice versa.
Figure 3: Use-Case Diagram of the ProteInOn Tool.
The user enters the input (proteins or GO terms) and selects the query (and options). Processing the query includes retrieving data from the ProteInOn database.
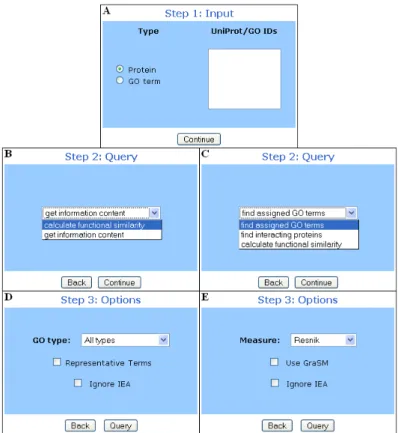
Figure 4: Query selection in the ProteInOn interface, with examples of the three steps.
A - input entry; B - query selection for an input of GO terms; C - query selection for an input of proteins; D - options for the query ‘find assigned GO terms’; E - options for ‘calculate functional similarity’ query for GO terms.
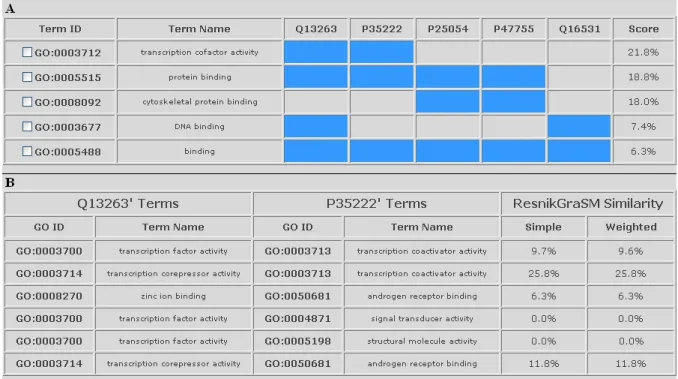
Figure 5: Query result examples in the ProteInOn interface.
A - results for the query ‘find assigned GO terms’ with the option ‘representative terms’ and an input of five proteins: cells in blue indicate that the protein in that column is annotated with the term in that line, and checkboxes in the term
accession numbers allow the user to select them to make further queries; B - results for the query ‘calculate protein similarity’ query with Resnik’s measure, the GraSM approach, and an input of two proteins: the terms of each protein are
compared with the best matching term of the other one, and both weighted and unweighted similarity scores are shown.
4.3
Options
Following the choice of the query, the user can select from a number of options for further specificity. The options, and the queries for which they are available, are:
• ‘GO type’ which limits queries to one of the three as-pects of GO and is available for the protein queries ‘find assigned GO terms’ and ‘calculate protein simi-larity’.
• ‘ignore IEA’ which is available for all queries except ‘find interacting proteins’. For GO term queries, elec-tronic and other weak evidence annotations (codes IEA, NAS, NA and NR) are ignored when calculating infor-mation contents (and consequently similarities). For Protein queries, GO terms assigned with these evi-dence codes are also excluded from the results. • ‘measure’ which is available for similarity queries, and
allows the user to select one of the three semantic sim-ilarity measures available (Resnik’s, Lin’s, and Jiang and Conrath’s).
• ‘use GraSM’ which is also available for similarity queries and implements the GraSM approach to the similarity measure selected.
• ‘representative terms’ which is available for the query ‘find assigned GO terms’ when two or more proteins are entered. It lists the GO terms that better represent
the set of proteins entered, according to the represen-tativeness score described in equation 3.
• ‘shared proteins only’ which is available for the query ‘find interacting proteins’ when two or more proteins are entered, and limits the results to proteins that in-teract with all of the proteins entered only.
4.4
Results
After submitting the query, the results page will load in five seconds. This delay is deliberate to prevent abusive access to the tool, since all queries are processed in under one sec-ond. The results are presented in easy to read tables, with entries (either proteins or GO terms) including the name be-sides the accession number, to make them more informative. The accession numbers link to the corresponding entries in the source databases (UniProt for proteins and GO for GO terms).
The results of the query ‘find assigned GO terms’ and both results and input of the query ‘find interacting proteins’ can be selected as input for further queries (see Figure 5), which allows continuous navigation and sequential building of com-plex queries .
The results of the query ‘find assigned GO terms’ with the option ‘representative terms’ are colour coded for easier in-terpretation: each line corresponds to a GO term and each line to a protein, cells are coloured in blue if the protein in that column is annotated to the term in that line, and left uncoloured (gray) otherwise (see Figure 5). The cells also contain invisible 0’s and 1’s for accessibility purposes, and
each term is assigned its representativeness score as shown in equation 3.
Similarity scores appear in percentage, for easier interpreta-tion, and both weighted and unweighted are presented (see Figure 5).
5.
CONCLUSIONS
We have built an online tool, ProteInOn, for integrating protein knowledge within the context of the Gene Ontol-ogy. It features a guided step-by-step query construction procedure, which makes it flexible and costumizable, and allows the use of results as input for further queries, so that complex queries can be built by a sequential combination of simpler ones.
The tool can be used to compute semantic similarity be-tween proteins or GO terms, using one of the three measures implemented (Resnik’s, Lin’s and Jiang and Conrath’s) with or without the GraSM approach. Furthermore, it introduces a preliminary weighting factor to improve the specificity of these measures for protein semantic similarity, addressing the issue of their displacement from the GO graph. It can also be used to find GO terms assigned to one or more proteins or GO terms representative of a set of proteins. A preliminary score is used to measure the representativeness of a term for a set of proteins, based on the number of pro-teins the term is annotated to and its probability of anno-tation.
Finally, it can be used to find proteins that interact with one or more other proteins, which enables the integration of knowledge on protein interactions with functional and pro-cessual knowledge: proteins that share a group of interactors should have a similar molecular function whereas a group of interacting proteins should be involved in similar biological processes.
We will be expanding ProteInOn, namely to include more queries with selectable results, like ‘find related terms’ and ‘find annotated proteins’. This should improve its flexibil-ity, by allowing a greater number of query combinations and consequently more complex queries. Other additions will include increasing the limit on the number of input en-tries and implementing new measures for protein semantic similarity. We will be evaluating the preliminary weighting factor as well as new similarity measures for proteins by cor-relating protein semantic similarity with sequence similarity and also with Pfam and EC classification. The represen-tativeness score will be evaluated using sets of interacting proteins and/or microarray results and comparing the GO terms obtained as representative with those obtained with other methods and applications.
6.
AUTHORS’ CONTRIBUTIONS
DF and CP designed and implemented the web tool and wrote the manuscript. DF and FMC implemented the database. FMC and AOF supervised the work and revised the manuscript. All authors read and approved the final manuscript.
7.
REFERENCES
[1] Azuaje, F., Wang, H., and Bodenreider, O. Ontology-driven similarity approaches to supporting gene functional assessment. In Proceedings of the ISMB2005 SIG meeting on Bio-ontologies (2005). [2] Bada, M., Stevens, R., Goble, C., Gil, Y.,
Ashburner, M., Blake, J., Cherry, J., Harris,
M., and Lewis, S. A short study on the success of the gene ontology. Journal of Web Semantics 1, 1 (2004), 235–240.
[3] Camon, E., Magrane, M., Barrell, D., Lee, V., Dimmer, E., Maslen, J., Binns, D., Harte, N., Lopez, R., and Apweiler, R. The gene ontology annotation (goa) database: sharing knowledge in uniprot with gene ontology. Nucleic Acids Research 32 (2004), D262.
[4] Couto, F. M., and Silva, M. J. Advanced Data Mining Technologies in Bioinformatics. Idea Group Inc., 2006, ch. Mining the BioLiterature: towards automatic annotation of genes and proteins.
[5] Couto, F. M., Silva, M. J., and Coutinho, P. M. Semantic similarity over the gene ontology: Family correlation and selecting disjunctive ancestors. In Proc. of the ACM Conference in Information and Knowledge Management as a short paper (2005). [6] Devos, D., and Valencia, A. Practical limits of
function prediction. Proteins: Structure, Function, and Genetics 41 (2000), 98–107.
[7] ensen, L., Gupta, R., Staerfeldt, H., and Brunak, S. Prediction of human protein function according to gene ontology categories. Bioinformatics 19, 5 (2003), 635–642.
[8] Friedberg, I. Automated protein function prediction-the genomic challenge. Briefings in Bioinformatics 7, 3 (2006), 225–242.
[9] GO-Consortium. The Gene Ontology (GO) database and informatics resource. Nucleic Acids Research 32, Database issue (2004), D258–D261.
[10] Jiang, J., and Conrath, D. Semantic similarity based on corpus statistics and lexical taxonomy. In Proc. of the 10th International Conference on Research on Computational Linguistics (1997). [11] Kerrien, S., Alam-Faruque, Y., Aranda, B.,
Bancarz, I., Bridge, A., Derow, C., Dimmer, E., Feuermann, M., Friedrichsen, A., Huntley, R., Kohler, C., Khadake, J., Leroy, C., Liban, A., Lieftink, C., Montecchi-Palazzi, L., Orchard, S., Risse, J., Robbe, K., Roechert1, B.,
Thorneycroft, D., Zhang, Y., Apweiler, R., and Hermjakob, H. Intact - open source resource for molecular interaction data. Nucleic Acids Res (2006). [12] Lei, Z., and Dai, Y. Assessing protein similarity with
gene ontology and its use in subnuclear localization prediction. BMC Bioinformatics 7, 491 (2006). [13] Lin, D. An information-theoretic definition of
similarity. In Proc. of the 15th International Conference on Machine Learning (1998).
[14] Lord, P., Stevens, R., Brass, A., and Goble, C. Investigating semantic similarity measures across the Gene Ontology: the relationship between sequence and annotation. Bioinformatics 19, 10 (2003), 1275–1283. [15] Lord, P., Stevens, R., Brass, A., and Goble, C.
Semantic similarity measures as tools for exploring the gene ontology. In Proc. of the 8th Pacific Symposium on Biocomputing (2003).
[16] Rada, R., Mili, H., Bicknell, E., and Blettner, M. Development and application of a metric on semantic nets. In IEEE Transaction on Systems, Man, and Cybernetics (1989), vol. 1.
[17] Rebholz-Schuhmann, D., Kirsch, H., and Couto, F. Facts from text - is text mining ready to deliver? PLoS Biology 3, 2 (2005).
[18] Resnik, P. Using information content to evaluate semantic similarity in a taxonomy. In Proc. of the 14th International Joint Conference on Artificial
Intelligence (1995).
[19] Resnik, P. Semantic similarity in a taxonomy: an information-based measure and its application to problems of ambiguity in natural language. Artificial Intelligence Research 11 (1999), 95–130.
[20] Schlicker, A., Domingues, F. S., Rahnenfhrer, J., and Lengauer, T. A new measure for functional similarity of gene products based on gene ontology. BMC Bioinformatics 7, 302 (2006).
[21] Sevilla, J. L., Segura, V., Podhorski, A., Guruceaga, E., Mato, J. M., Martnez-Cruz, L. A., Corrales, F. J., and Rubio, A. Correlation between gene expression and go semantic similarity. In IEEE/ACM Transactions on Computational Biology and Bioinformatics (2005).
[22] Stevens, R., Wroe, C., Lord, P., and Goble, C. Handbook on Ontologies. Springer, 2003,
ch. Ontologies in Bioinformatics.
[23] Wu, C., Apweiler, R., Bairoch, A., Natale, D., Barker, W., Boeckmann, B., Ferro, S.,
Gasteiger, E., Huang, H., Lopez, R., Magrane, M., Martin, M., Mazumder, R., O’donovan, C., Redaschi, N., and Suzek, B. The universal protein resource (uniprot): an expanding universe of protein information. Nucleic Acids Res (2006), D187–D191. [24] Wu, X., Zhu, L., Guo, J., Zhang, D.-Y., and Lin,
K. Prediction of yeast proteinprotein interaction network: insights from the gene ontology and annotations. Nucleic Acids Research 34, 7 (2006), 21372150.