1
Inside debt compensation and
its effect on corporate financial
policy choices
Dimitrios Kanelis
Dissertation written under the supervision of Dr.
Zoltan Novotny-Farkas
Dissertation submitted in partial fulfilment of requirements
for the International MSc in Management, at Universidade
2
Abstract
This dissertation examines the effects of inside debt compensation on managerial risk-seeking behaviour. Extant literature argues that besides equity and cash, managers are also compensated with debt-like instruments such as deferred compensation and pensions. These compensation components are typically unfunded and unsecured and expose the CEO to default risk similar to that faced by external debtholders (Edmans and Liu, 2011). As a result, managers with large inside debt holdings are expected to display lower financial risk tolerance (Cassel et al., 2012). Motivated by this argument, I first examine the effects of CEO inside debt compensation on corporate financial policy choices. I document a negative association between inside debt holdings and firm book leverage and a positive relationship between CEO inside debt holdings and firm solvency. Subsequently, I examine whether women, who are perceived to possess a risk profile similar to a manager with significant inside debt holdings receive similar inside debt compensation to men. However, I document no evidence of a difference in the inside debt compensation between genders.
JEL classification: G31, G32, G33, J33
Keywords: Executive compensation, inside debt, deferred compensation, pensions,
3
Table of Contents
Chapter 1 Introduction ... 7
Chapter 2 Literature review ... 11
2.1 The agency dilemma ... 11
2.2 The role of executive compensation ... 12
2.2.1 Executive compensation equity incentives ... 13
2.2.1 Inside debt compensation incentives... 16
2.3 Hypotheses Development ... 19
Chapter 3 Large sample analysis ... 22
3.1 Overview ... 22
3.2 Data and Sample Selection ... 22
3.3 Empirical design ... 24
3.4 Variable measurement ... 25
3.5 Descriptive statistics ... 27
3.6 Findings ... 32
3.6.1 The association between CEO inside debt holdings and firm financial policies ... 32
4
3.6.2 The relation between CEO inside debt holdings and firm solvency35
3.7 Findings discussion and future research possibilities ... 39
3.8 Limitations ... 40
Chapter 4 Small sample analysis ... 42
4.1 Motivation and theoretical background ... 42
4.1.1 CEO gender and executive compensation ... 43
4.2 Data and sample selection ... 45
4.3 Empirical design ... 47
4.4 Variable measurement ... 48
4.4.1 Dependent variables ... 48
4.4.2 Firm specific characteristics... 48
4.4.3 CEO characteristics ... 48
4.5 Findings ... 49
4.5.1 Univariate analysis ... 51
4.5.2 Multivariate analysis ... 54
4.6 Findings discussion and future research possibilities ... 58
4.7 Limitations ... 58
5
Appendix ... 62 References ... 64
List of Tables
Table 1 Large sample analysis sample distribution by year ... 23
Table 2 Descriptive statistics (Large sample analysis) ... 28
Table 3 Pearson correlations ... 31
Table 4 The assosiation between CEO relative leverage and Book leverage.33 Table 5 The assosiation between CEO relative leverage and ICR ... 37
Table 6 Descriptive statistics (Small sample analysis) ... 49
Table 7 Tests of difference on the means and medians ... 53
6
Glossary
ALTZ Altman Z-score
CEM Coarsened exact matching
CEO Chief executive officer
CFO Chief financial officer
CRSP Center for Research In Security Prices
GVKEY Global Company Key
ICR Interest coverage ratio
LTIP Long term incentive plans
SEC Securities and exchange commission
OLS Ordinary least squares
ROA Return on assets
7
Chapter 1 Introduction
Executive compensation is a complex and fascinating subject which has managed to remain relevant in academic literature and public debates for the better part of the past century. Following the global financial crisis, the high level of executive pay, and its often weak link to corporate performance has been treated by many as the main suspect for the near-collapse of the global financial system and has spurred intense discussions. Also, besides public scrutiny executive pay packages have provoked the reaction of regulators as well as institutional investors globally as evidenced by recent legislative initiatives such as the Dodd-Frank Act and the Government Pension Fund of Norway (often referred to as “The Oil Fund”) declaration to target high executive pay votes.
The effect of executive compensation channels on corporate performance and how they can both mitigate or exacerbate agency costs has been an extensively discussed topic in academia. Prior literature on the subject primarily emphasises the role equity-based compensation instruments and managerial ownership and how they provide incentives to executives to exert greater effort or implement riskier investment and financial policies (Guay, 1999; Coles et al., 2006). Nevertheless, as recent empirical findings suggest, CEOs are also compensated in the form of pension allowances and deferred compensation (Sundaram and Yermack, 2007; Wei and Yermack, 2011). Since these compensation instruments resemble unfunded and unsecured firm liabilities, they expose managers to default risk similar to that faced by external creditors. As a result, they are commonly referred in academic literature as inside debt.
8
According to previous research, CEOs with large inside debt holdings become more aligned with debtholders rather than shareholders (Edmans and Liu, 2011). In particular, when the CEOs become overly incentivised by inside debt, they tend to become more risk-averse. As a result, they take measures that reduce the risk levels of the firm and can potentially result in a transfer of wealth from shareholders to debtholders (Sundaram and Yermack, 2007; Wei and Yermack, 2011).
Consistent with this argument, Eisdorfer et al. (2013) report that CEOs with significant inside debt holdings implement less risky investment policies. Furthermore, Cassel et al. (2012) also document a negative association between CEO inside debt holdings and firm investment policy risk. In addition, they examine the association between inside debt incentives and firm financial policies. However, while they document a negative relationship between inside debt incentives and firm leverage, their results are not entirely consistent with extant literature on executive compensation. More specifically, some of their control variable coefficients1 display signs that are inconsistent
with their theoretical predictions. Furthermore, over 25% of their sample consists of utility and financial firms, which are known for their peculiar capital structure and regulated status (Fama and French, 1984).
As a result, for my initial hypothesis, I proceed to re-examine the relationship between CEO inside debt holdings and firm financial policy risk in an updated multivariate setting. Furthermore, unlike Cassel et al. (2012), I employ a more comprehensive sample which covers the years 2006-2014 and also exclude financial and utility firms from my analysis. Overall, I document a negative and significant association
1 In particular, it is their CEO Vega/Delta ratio, a control for the equity incentives of the
9
between CEO inside debt holdings and book leverage. I also report a positive and significant relationship between CEO inside debt holdings and firm interest coverage ratio (a measure of the firm’s ability to service its interest obligations in a given period). Collectively, my large sample analysis results are consistent with prior research which suggests that as the inside debt holdings of the CEO increase, he becomes more risk-averse and implements safer corporate policies (Wei and Yermack, 2011; Cassel et al. 2012; Eisdorfer et al., 2013).
Overall, in the large sample analysis, I document that inside debt compensation can affect the risk of corporate financial policies. At the same time, according to prior research, an additional factor which can affect the risk of corporate policy choices is the gender of the CEO (Faccio et al., 2015; Malmendier et al., 2011). Specifically, extant literature suggests that women are inherently more risk-averse relative to men, in particular with concern to financial risk (Huang and Kisgen 2013). Consistent with this argument, Martin et al. (2009) report a reduction in firm risk following the appointment of female CEOs, while they also argue that financially constraint firms are more likely to appoint a female CEO. These results are supported by Faccio et al. (2015) who document that female CEO firms display lower leverage levels and a higher probability of survival relative to male CEO firms. These findings suggest that gender can also condition the behaviour of the CEO and that women CEOs exhibit risk-averse behaviour even at top managerial positions. Therefore, one could argue that women CEOs tend to display similar characteristics with CEOs who hold significant inside debt holdings. Therefore, for my small sample analysis, I take advantage of this interesting premise and examine whether female CEOs are compensated with less inside debt compensation. Since female executives are perceived to inherently possess a lower risk tolerance, one could be
10
inclined to expect boards to compensate them with less inside debt. Nevertheless, I do not document any indication of a difference on the inside debt holdings between male and female CEOs. These results suggest that gender is not a determinant of inside debt compensation and are more in line with studies which suggest that gender pay disparities cease to exist when an individual achieves the rank of CEO (Bugeja et al., 2012).
The remaining of this dissertation is organised as follows. Chapter 2 presents a summary of the relevant literature on executive compensation and CEO inside debt and develops my main hypotheses. Chapter 3 presents my large sample analysis. My small sample analysis is presented in Chapter 4. Lastly, I present my conclusions in Chapter 5.
11
Chapter 2
Literature review
2.1 The agency dilemma
According to traditional agency theory, an agency refers to the relationship between two parties, the principal and the agent. In most cases, principals hire the agents’ services and allow them to take decisions on their behalf. However, by delegating some of their decision-making authorities, principals place their trust on the agent’s abilities but cannot guarantee that the latter’s course of action will be taken with their best interest in mind (Eisenhardt, 1989).
This dilemma serves as the foundation of the agency problem and arises because the interests of the principal may not be congruent with those of the agent. In particular, shareholders invest their money in the company and wish to maximise their investment. At the same time managers, who shareholders hire to operate the firm on their behalf, invest their time and effort and naturally expect a return as well. Thus, managers may often choose to behave in an opportunistic manner and take suboptimal actions to maximise their investments return at the expense of shareholder wealth (Jensen and Meckling, 1976; Eisenhardt, 1989).
Furthermore, even if shareholders are the owners of a firm, they only possess residual ownership over their companies’ assets. More specifically, an additional party who has an active interest is corporate assets are debtholders. Like shareholders, debtholders also invest in company operations by acquiring debt issued by the firm. In exchange for their
12
investment, they demand returns in the form of interest payments and also gain priority claim on the issuing firm’s assets in the event of bankruptcy. However, interest payments are typically based on the firm’s existing risk level at the date of the financing agreement and usually remain fixed subsequently. Thus, unlike shareholders whose payoffs are convex, debtholders possess limited upside potential in the value of their claims (Jensen and Meckling, 1976; Dewatripont and Tirole, 1994). Therefore, in cases where firms perform exceptionally well, debtholder payoffs remain fixed whereas shareholder payoffs have unlimited upside potential. Furthermore, for any company with significant debt as the value of shareholders’ equity decreases debtholder stake in the enterprise increases. As a result, shareholders have incentives to take on riskier projects and shift the downside risk of their investments to debtholders. (Dewatripont and Tirole, 1994).
In general, most corporations are leveraged and regularly employ external debt to fund their operations. Therefore, agency conflicts can also arise between shareholders and debtholders (Brigham and Ehrhardt, 2013; Damodaran, 2010). These conflicts stem from the distance between the risk preferences of shareholders and debtholders and are known as agency conflicts of debt. In particular, agency conflicts of debt occur when managers increase firm risk through business investment and financing policies in ways that favour shareholders over debtholders (Dewatripont and Tirole, 1994).
2.2 The role of executive compensation
Overall, conflicts of interest between managers and company stakeholders can result in agency problems (Damodaran, 2010). The expenses associated with mitigating these problems are known as agency costs. One the most prominent measures used to manage
13
agency conflicts and minimise these costs in corporations is executive compensation. Shareholders typically design executive compensation contracts with the purpose of aligning their interests with the ones of managers. More specifically, in its capacity of addressing agency conflicts, the role of executive remuneration packages is threefold. In particular, its purpose is to attract talented individuals at the lowest possible cost; reduce executive turnover and motivate executives to take value-adding actions that will maximise the wealth of shareholders.
Executive compensation packages typically involve a mixture of short-term and long-term incentives. The most commonly identified part of compensation packages is base salary, which corresponds to the standard wage paid to an executive and typically takes the form of cash. In addition to base salary, managers often receive bonuses for achieving corporate set milestones. These bonuses are usually cash-based or equity-based and serve as short-term incentives. Furthermore, executives also enjoy non-pecuniary rewards that involve benefits and perquisites such as the use of corporate jets and chauffeur services. Finally, corporations use incentives that are tied to equity or enterprise value to align the interest of managers with the long-term corporate wellbeing (Murphy, 1999).
2.2.1 Executive compensation equity incentives
According to Jensen and Meckling (1976), to mitigate agency conflicts with managers, shareholders should tie the wealth of the former group to the value of the firm’s equity. One of the ways shareholders can achieve this is through the use of equity-based pay. What sets equity-based compensation apart from other pay package components is the fact that it does not explicitly involve cash but uses equity-based instruments like
14
stock, restricted stock and stock options as employee compensation. As a result, it provides a direct link between the interests of shareholders and managers since executives receive ownership rights of the firm instead of cash (Murphy, 1999). Therefore, equity-based incentive compensation can increase the sensitivity of the CEOs wealth to the stock price, also known as delta which can reduce agency conflicts of equity (Jensen and Murphy, 1990). Overall, equity incentives can reduce agency conflicts of equity also urge managers to exert more effort and increase the value of equity since their rewards are tied directly to the firm’s stock performance (Jensen and Meckling, 1976; Fama and Jensen, 1983).
However, besides directly linking the rewards of managers to the wealth of shareholders, equity-based compensation also shifts some of the risks borne by the latter group to the former. In particular, equity incentive compensation exposes executives to additional risks since a part of their wealth is in the form of equity-based instruments. Unlike shareholders who can be considered as risk neutral since they are well diversified, managers are often undiversified and potentially disallowed from hedging their risk by being required to maintain a specific shareholding in their companies. Therefore, if the company underperforms, their rewards will decline, and their shareholding will hold a lower nominal value.
As a result, equity-based compensation can not only tie their rewards to corporate performance but also make them more averse. To reduce the equity-induced risk-aversion of managers, equity-based compensation can be structured to increase the sensitivity of managerial wealth to stock-return volatility. Specifically, shareholders provide equity instruments to managers’ that can structure the latter group’s payoffs to be a convex function of firm performance. Therefore, by increasing the sensitivity of the
15
CEOs wealth to the volatility of the firm’s performance, also known as Vega, shareholders can mitigate the risk aversion that can result from high delta and incentivise the manager to implement riskier corporate policies (Coles et al., 2006).
As was mentioned before, in the modern corporate setting agency relationships are complex and often involve more parties, like debtholders. These parties all invest in different ways in corporations and naturally demand a return on their investments. In that effect, executive compensation besides mitigating some agency conflicts may very well exacerbate others. In particular, although equity-based incentive compensation is designed to align the interests of managers and shareholders, it can also incentivise them to do so at the expense of other stakeholders, and in particular debtholders (Dewatripont and Tirole, 1994). However, this can result in increased agency costs of debt. Specifically, to safeguard their position and avoid potential expropriation of their wealth, bondholders take protective measures like demanding higher interest rates or imposing restrictive covenants (Chava et al., 2010). Therefore, to mitigate these agency costs of debt, prior literature suggests that shareholders should try design managerial compensation contracts that induce managers to consider the interests of debtholders (Brander and Poitevin, 1992).
Consequently, for the corporation to mitigate agency costs resulting from both equity and debt, managerial interest alignment levels need to be in equilibrium with not only the interests of firm owners’ but also the interests of debtholders (Jensen and Meckling, 1976; Eisdorfer et al., 2013). As a result, the role of executive compensation in addressing agency problems becomes even more pronounced.
16
2.2.1 Inside debt compensation incentives
Jensen and Meckling (1976) are the first to introduce the concept of aligning managerial incentives with those of debtholders through the use of incentive compensation. In a brief section of their seminal study, they note that having the manager hold debt and equity in a similar proportion to that of the firm’s capital structure, can mitigate the risk-shifting problems associated with external debt.
Recent theoretical investigation has revisited the work of Jensen and Meckling (1976). Edmans and Liu (2011) offer a theoretical framework to justify the use of debt as a channel of optimal pay. Furthermore, they argue that CEO inside debt holdings, denoted as the sum of the pension benefits and the deferred compensation of the CEO, are sensitive not only to the probability of bankruptcy but also to the liquidation value of the firm. Therefore, CEOs can face default risk similar to that of outside creditors when it comes to their inside debt position.
Consistent with this theoretical prediction, Anantharaman et al. (2014) argue that pension and deferred compensation can effectively function as inside debt. However, they note that in order for these compensation components to constitute inside debt they need to be fixed and proportional to the firm’s liquidation value in the cases of solvency and insolvency respectively. In addition to they should not be senior to any other debtholder claims.
Early literature on compensation rarely explored the impact of CEO debt holdings on managerial behaviour, focusing on the effect of equity-based compensation incentives instead. Nevertheless, according to recent studies, inside debt compensation is more widely adopted in publicly traded companies that otherwise believed. Specifically, Wei
17
and Yermack (2011) document that 84% of CEOs in their study are compensated with some form of inside debt.
Along this line, Sundaram and Yermack (2007) report that for 13% of the CEOs in their sample the percentage of their debt stake exceeds the equivalent percentage of their equity stake. Furthermore, they argue that as their inside debt holdings increase, CEOs start to act more akin to a debtholder and take measures to reduce overall firm risk and the probability of a debt default. However, it should be noted that they examine only the effect of CEO’s pension balances and do not take deferred compensation into account. Nevertheless, their findings suggest that inside debt compensation can align the interests of managers and debtholders and mitigate agency costs of debt.
Overall, empirical results indicate that as the CEOs inside debt holdings increase, they become more aligned with bondholders and more risk averse (Edmans and Liu, 2011). According to Wei and Yermack (2011), investors also seem to hold a similar opinion. In their study, they take advantage of the SECs new disclosure requirements concerning inside debt holdings in 2007 and examine the respective reactions of investors. They report a decrease in the value of equity and an increase in the value of debt for companies which report a high inside debt position for their CEOs. Furthermore, the stock volatility for these companies decreases in the following months, while their credit default swap spread also narrows. These results indicate that the market perceives companies where the CEO possesses a high relative leverage ratio as less risky. Furthermore, they also report that the decrease in equity value is larger than the increase in the value of debt. Therefore, these results suggest that when CEOs become overly incentivised by inside debt, they exhibit more conservative behaviour and take sub-optimal decisions that can adversely affect shareholder wealth.
18
These findings are in agreement with Liu et al. (2014) who find that CEO debt-like compensation is associated with higher firm cash balances. Prior research suggests that, it is creditors who demand higher cash balances and asset liquidity as a countermeasure to managerial risk taking incentives (Liu and Mauer, 2011). Therefore, by building up their firm’s cash reserves, managers act more like creditors since they are effectively hedging the risk they run to lose their debt-like compensation by diminishing the likelihood of a credit event. However, shareholders may be negatively affected by this, since the most common option managers use to increase cash reserves without defaulting on any payments, is the reduction of pay-outs to equity holders or passing up the opportunity to invest in risky projects (Cassel et al., 2012; Eisdorfer et al., 2015).
Consistent with this argument, Eisdorfer et al. (2013) report that as the CEOs inside debt holdings increase, they underinvest, which results in a transfer of wealth form shareholders to debtholders. At the same time, they report that when the managers’ equity position is significantly higher than their inside debt position, they over-invest and expropriate debtholders instead. Overall, they note that the personal leverage2 of the CEO
can adversely drive their investment decisions and affect firm policies. As a result, they argue that agency conflicts stemming from both debt and equity may be mitigated when the relative leverage3 of top executives, is set as close to unity as possible.
2 Eisdorfer et al. (2013) follow Sundaram and Yermack (2007) and denote the CEOs personal leverage as
their inside debt claims divided by their equity portfolio claims.
3 According to Eisdorfer et al. (2013) the CEOs relative leverage is denoted as their personal leverage (CEO
19 2.3 Hypotheses Development
As mentioned above Eisdorfer et al. (2013) report that, as the CEOs relative leverage increases, they deviate from optimal investment policies and underinvest in order to reduce firm risk. In addition, Cassel et al. (2012) examine the association between CEO inside debt and financial and investment policy risk and report a negative association. In that effect, they argue that managers exercise their control over investment and financial policies to reduce the volatility of the firm’s performance. As a result, they posit that managers with a high CEO relative leverage will implement safer policies and try to reduce the overall debt burden of the firm to mitigate the probability of a credit event.
Although Cassel et al. (2012) document a significant and negative relationship between inside debt incentives and firm investment policies, their results with regard to external firm financing policies are more ambiguous. More specifically, while their results are consistent with their theoretical prediction that inside debt induces CEOs to reduce their firm’s debt burden, the interpretations of their control variables are inconsistent with prior literature. A possible explanation for these inconsistencies is the construction of their sample. More specifically, over 21% of their sample consists of financial services companies. According to Fama and French (1992), financial firms deal with debt and financial instruments and as a result, possess significantly higher leverage than firms in other industries. Also, their sample covers the period 2006-2008 which corresponds to the global credit crisis. According to prior research, major financial crises can result in a period of deleveraging. More specifically, the 2007 global financial crisis triggered liquidity shortages which severely affected the ability of companies to draw funds from external creditors. As a result, a lot of companies had to involuntarily deleverage (Claessens et al., 2010). Therefore, it is possible the results documented by
20
Cassel et al. (2012) are driven by the construction of their sample. Taking these factors into consideration, I proceed to re-examine the hypothesis first introduced by Cassel et al. (2012) on the association between firm financial policies and CEO inside debt incentives using a more comprehensive research design and a different sample of observations.
Consistent with prior theory on CEO inside debt holdings and risk-aversion, I expect firm leverage to be negatively associated with CEO inside debt holdings. More specifically, the increased risks of bankruptcy associated with high leverage should induce managers with high inside debt to reduce the debt burden of their firm, as a way of securing both their managerial position and inside debt claims.
H1: There is a negative association between CEO inside debt holdings and firm leverage Following the financial crisis, a matter of great concern was how companies, that were otherwise perceived to be healthy financially, were severely affected by the sudden economic downturn. Subsequently, firm solvency, which is the ability of a company to service its obligations and produce cash flows that are sufficient to meet its short-term and long-term liabilities, became a very hotly debated topic. A company that is insolvent will inevitably enter bankruptcy or reorganise. However, a firm can also enter bankruptcy when it lacks liquidity.
Furthermore, prior literature suggests that CEOs with significant inside debt positions try to alleviate their firms’ debt burden and increase their firms working capital (Cassel et al., 2012). What they potentially aim to achieve by this is to reduce the probability that an unforeseen credit event takes place. More specifically, they increase
21
asset liquidity to ensure that even when an unexpected event affects company operations negatively, the firm will still be able to service its short-term obligations.
A reduction in firm leverage will serve no purpose neither to highly leveraged managers nor stakeholders if it is not accompanied by sufficient operating cash flows to service its long-term as well as its short-term commitments. In this regard, a company’s ability to service immediate interest payments could be considered as an efficient proxy for firm solvency.
Therefore, I extend the scope of my initial hypothesis and proceed to examine whether managers with large inside debt holdings take measures to increase their firm’s ability to service its short-term debt, so as to avoid any potential credit event. Therefore, for my second hypothesis, I expect a positive association between CEO inside debt holdings and firm financial sustainability.
H2: There is a positive association between CEO inside debt holdings and firm financial
22
Chapter 3 Large sample analysis
The effect of inside debt holdings on corporate financial
policies
3.1 Overview
In this chapter, I focus on the risk-reducing effects of inside debt compensation on corporate policy choices. For this reason, I empirically examine the relationship between the inside debt incentives of the CEO and firm financial policies by conducting a multivariate regression analysis on two different model specifications. First, I examine the relationship between CEO inside debt incentives and firm book leverage. Second, I empirically examine the relationship between CEO inside debt incentives and firm solvency using the company’s interest coverage ratio (ICR) as a proxy. I document a negative association between CEO relative leverage and book leverage and a positive association between inside debt incentives and firm solvency; both relationships are statistically significant.
3.2 Data and Sample Selection
Since the Securities and Exchange Commission (SEC) new disclosure requirements concerning pension and deferred compensation plans came into effect in 2006, my sample period is limited and covers the years 2006 to 2014. Consistent with previous research Utilities (SIC 4900–4999) and Financial firms (SIC 6000–6999) are excluded from the sample due to their highly regulated nature. Since I focus my analysis on the CEO’s
23
pension benefits and deferred compensation, I identify firms with complete inside debt data from the Execucomp database. Furthermore, I use accounting data from Compustat and CRSP to derive the dependent and control variables used in my analysis. All continuous variables are winsorised at their 1st and 99th percentiles to mitigate the influence of outliers4. After merging the databases and removing observations with
missing values, my primary sample consists of 4,906 firm-year observations, representing 815 individual firms.
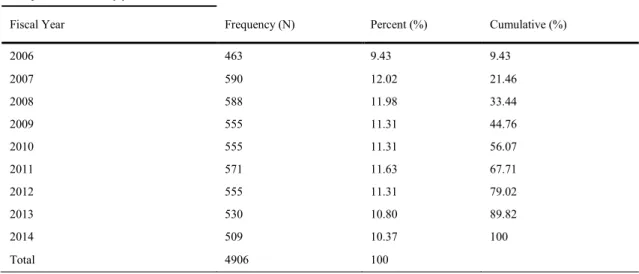
Table 1 provides the distribution of my sample firms across years. Overall, my sample company observations appear evenly distributed from 2006 to 2014.
Table 1
4 For additional details on the calculation of all variables, the reader is referred to the Appendix.
Sample distribution
This table provides the sample distribution by year. Since the SEC’s expanded executive compensation disclosure requirements became effective for 2006 fiscal year-ends, the sample period begins in 2006. I collect observations from 2006 to 2014 and identify all firms with complete compensation data necessary to calculate the relative CEO leverage measures (from the Standard and Poor’s Execucomp database) and with sufficient information in the Compustat database to estimate the dependent and control variables in my models. Utility (SIC 4900–4999) and Financial firms (SIC 6000–6999) are excluded from the sample. As a result, my primary sample consists of 4,906 firm-year observations, representing 815 unique firms.
Sample distribution by year
Fiscal Year Frequency (N) Percent (%) Cumulative (%)
2006 463 9.43 9.43 2007 590 12.02 21.46 2008 588 11.98 33.44 2009 555 11.31 44.76 2010 555 11.31 56.07 2011 571 11.63 67.71 2012 555 11.31 79.02 2013 530 10.80 89.82 2014 509 10.37 100 Total 4906 100
24 3.3 Empirical design
To empirically test my hypotheses, I follow prior research and develop models to examine the impact of CEO inside debt holdings on firm book leverage and firm solvency. More specifically to test H1 and H2, I introduce the following empirical models5.
Model (1)
𝐵𝑜𝑜𝑘 𝑙𝑒𝑣𝑒𝑟𝑎𝑔𝑒 = 𝛼 + 𝛽1∗ 𝐶𝐸𝑂 𝑟𝑒𝑙𝑎𝑡𝑖𝑣𝑒 𝑙𝑒𝑣𝑒𝑟𝑎𝑔𝑒𝑖𝑡+ 𝛽2∗ 𝐶𝑜𝑛𝑡𝑟𝑜𝑙𝑠 + 𝑦𝑒𝑎𝑟 𝑒𝑓𝑓𝑒𝑐𝑡𝑠𝑖𝑡+ 𝜀
Model (2)
𝐼𝐶𝑅 = 𝛼 +𝛽1∗ 𝐶𝐸𝑂 𝑟𝑒𝑙𝑎𝑡𝑖𝑣𝑒 𝑙𝑒𝑣𝑒𝑟𝑎𝑔𝑒𝑖𝑡+ 𝛽2∗ 𝐶𝑜𝑛𝑡𝑟𝑜𝑙𝑠 + 𝑦𝑒𝑎𝑟 𝑒𝑓𝑓𝑒𝑐𝑡𝑠𝑖𝑡+ 𝜀
I consider the variables of interest in my primary models to be exogenously determined. Nevertheless, endogeneity is a serious concern and could potentially be driving my results. The possibility exists that CEO inside debt holdings and my dependent variables are jointly determined. I acknowledge this possibility and run separate regressions with all my explanatory variables lagged by one fiscal year to mitigate reverse causality concerns. Since pooled Ordinary Least Squares (OLS) regressions can produce substantially inflated t-statistics and underestimate standard errors, to reach valid statistical inferences, I run both pooled OLS regressions as well as fixed effects
5 In addition to my control variables, I add year dummies to my regressions to account for any annual
25
regressions. I use the fixed effects model (FE) to address any unobserved firm heterogeneity. In addition to controlling for time-invariant firm characteristics, robust standard errors are clustered at the company level (gvkey) in all my models to correct potentially inflated t-statistics due to serial correlation.
3.4 Variable measurement
Leverage
Following Sundaram and Yermack (2007) I use the firm’s book leverage as a proxy for the company’s capital structure. I do not use market leverage to mitigate the probability that my results are affected by a mechanical relation with my variable of interest, CEO relative leverage. I measure leverage as the book value of total debt divided by total assets.
Firm Solvency
For my second hypothesis, I use an income statement ratio, the interest coverage ratio (ICR) as a proxy for firm solvency. I define ICR as operating income divided by interest expense. Interest coverage ratios have been used in the past as a measure of financial distress (Asquith et al., 1991; Ezzell and Vora, 2001), while Leland (1994,1998) shows that ICR covenants may mitigate the incentive of stockholders to increase asset volatility. Additionally, Dothan (2006) argues that ICR can serve as an optimal covenant and may also lessen managerial incentives to increase firm risk. For these reasons, I employ this ratio as a measure of firm solvency, since it serves as an indicator of the company's ability to pay the interest on its debt, a higher ratio indicating greater solvency.
26
Furthermore, I control for the effects of variables that have been documented to be associated with my dependent variables. With regard to equity compensation incentives, prior literature notes a positive association between Delta (defined as the sensitivity of the value of the CEO’s accumulated equity-based compensation to a one-percent change in the stock price), and effort exerted by managers since their gains are directly related to the firm’s stock price (Guay 1999; Coles et al. 2006). Also, Guay (1999) suggests that higher delta increases the risk born by managers, while John and John (1993) argue that higher delta incentivises managers to shift risk to debtholders. Furthermore, according to Coles et al. (2006) CEO Vega (defined as the sensitivity of the value of the CEO’s accumulated equity-based compensation to a one-percent change in the volatility of stock prices) can induce managers to take on riskier projects and implement more aggressive financial policies. Hence, I control for the effects of both the Delta, and Vega. I scale Vega and Delta by total current CEO compensation; this helps to capture their relative importance with regards to CEO total pay (Liu et al., 2014). Also, prior research suggests that managers are keen to use internally raised funds available to invest in new projects or pay interest on existing debt (Cassel et al., 2012). For this reason, I employ surplus cash scaled by total assets as an additional control variable. Furthermore, I introduce an indicator variable of a CEO reaching retirement age (NRI) as a control variable as studies have documented a significant relationship between age, risk aversion and financial policies (Selfling, 2014).
Also, I use the market-to-book ratio (Market-to-Book) as a proxy for the investment opportunity set of the company since Murphy (1985) reports that CEO pay is higher for companies with greater growth prospects and also use a tangibility ratio (Coles et al., 2006). Additionally, the natural logarithm of total assets is used as a proxy for firm size,
27
while return on assets (ROA) is utilised as a proxy for firm performance and profitability, factors that according to Core et al. (1999) affect CEO pay. Firm age in a given sample year is the number of years since the first year that the company is reported in Compustat. Lastly, I introduce a proxy on firm’s financial distress Altman Z-score (ALTZ). Furthermore, to control for the potential tax benefits of debt, I add an indicator variable (Tax indicator) equal to one (1) if the company is reporting a negative tax carry forward and zero (0) otherwise.
Finally, I include industry and year fixed effects in my models to control for industry characteristics and other macroeconomic factors over time. For additional information and details on the definition and derivation of each of my model's variables, I refer the reader to the Appendix.
3.5 Descriptive statistics
Table 2 provides summary statistics for my variables of interest. The descriptive statistics indicate that my sample firms are heterogeneous in terms of size (mean and median Total Assets are $11.2 and $3 billion, respectively). They also indicate that Total Assets is heavily right-skewed so its logarithmic transformation is used in the multivariate regression analyses. With regard to the Interest coverage ratio (mean and median are 8 and 47 respectively), I again witness a heavily right skewed distribution. Therefore, I use its logarithmic transformation for the multivariate analyses. I also find that the mean (median) CEO debt/equity ratio is 0.63 (0.15) suggesting that, for the majority of my sample firms, CEO equity portfolio value exceeds their equivalent inside debt position. The average CEO holds more than $8 million in inside debt while a typical CEOs inside
28
debt holdings are close to $3 million. These results are consistent with previous research (Cassell et al., 2012; Liu et al., 2014) and indicate that inside debt makes up a more significant proportion of CEO wealth than otherwise perceived. The CEO to firm debt to equity ratio has mean (median) values of 1.187 (0.252) respectively which are again consistent with the respective findings of Liu et al. (2014). Collectively, I document that the CEO’s relative leverage ratio is less than the firm’s leverage ratio for the majority of my observations which is contradicting the intuition of Jensen and Meckling (1976). However, as Edmans and Liu (2011) argue, equity incentives are needed for the CEO to exert greater effort. As a result, the optimal debt ratio for the CEO should be less than the firm’s. Therefore, I am not surprised that the majority of my observations have a relative debt-to-equity ratio below one.
However, my statistics also clearly indicate that the distributions of my CEO relative leverage measure are right-skewed. Thus, I use its natural logarithm in the multivariate regression analyses for less noisy results. With regards to equity incentives, the typical CEO (who remains in his position for 6 years) possesses a mean (median) Vega of $216,155 ($92,010), and a mean (median) Delta of $1,577,727 ($359,589) respectively. These figures again suggest that equity-based incentives are prominent in my sample observations
Table 2
Descriptive statistics
This table presents descriptive statistics for sample observations for my variables of interest. For variable definitions, the reader is referred to the Appendix.
N Std.dev Mean Q1 Median Q3 Pension benefits (thousand $) 4906 8908.47 4451.58 0.00 462.21 5100.33
29
Deferred compensation Plans
(thousand $) 4906 11561.03 3843.51 161.60 876.47 3015.76 Inside debt (thousand $) 4906 16083.46 8295.09 782.65 2959.18 9139.14 CEO equity holdings (thousand $) 4906 1366695.00 124571.00 8671.45 19456.33 47896.59
CEO Total compensation (thousand $) 4906 7731.25 7160.34 2934.51 5266.01 8899.01 CEO Relative leverage 4906 37.01 1.19 0.08 0.25 0.73 CEO Relative leverage >1
4906 0.38 0.18 0.00 0.00 0.00 CEO inside debt to equity holdings 4906 17.15 0.63 0.04 0.15 0.40 CEO age 4906 6.44 56.22 52.00 56.00 60.00 CEO tenure 4906 6.53 7.66 3.00 6.00 10.00 Near retirement indicator 4906 0.46 0.30 0.00 0.00 1.00 CEO Vega 4906 422.28 216.15 23.00 92.02 250.52 CEO Delta 4906 14141.27 1577.73 146.41 359.59 878.31 Book Leverage 4906 0.16 0.25 0.14 0.23 0.33 Interest Coverage Ratio 4906 1405.08 47.35 4.20 8.10 16.27 Surplus Cash 4906 0.08 0.08 0.04 0.08 0.12 Return on Assets (ROA) 4906 0.07 0.06 0.03 0.06 0.09 Altman Z-score 4906 2.07 3.53 2.23 3.21 4.40 Market-to-Book 4906 0.87 1.77 1.22 1.54 2.04 Total assets 4906 28175.36 11142.17 1242.99 3074.27 8636.90 Tangibility ratio 4906 0.21 0.28 0.12 0.21 0.38 Firm age 4906 17.93 33.42 18.00 31.00 49.00 Total observations 4906
However, my statistics also clearly indicate that the distributions of my CEO relative leverage measure are right-skewed. Thus, I use its natural logarithm in the multivariate regression analyses for less noisy results. With regards to equity incentives, the typical CEO (who remains in his position for 6 years) possesses a mean (median) Vega of $216,155 ($92,010), and a mean (median) Delta of $1,577,727 ($359,589) respectively. These figures again suggest that equity-based
30
Table 3 presents my Pearson correlations. My correlation coefficients show that the interrelations between my key variables used in my analysis are acceptable in terms of significance and size with one potential matter of concern the high correlation between the interest coverage ratio and Altman Z-score (ALTZ). Additionally, there is a high interrelation between ALTZ and the market to book ratio. However, this is somewhat expected as companies with a lot of investment opportunities engage in financially risky activities to pursue them. Because of the high interrelation between ALTZ and ICR and the fact that both have been used before to capture aspects of financial distress costs (Asquith et al., 1991), I exclude Altman Z-score from my second model analysis. The correlation between my relative CEO debt-to-equity ratio measures is 0.591 suggesting that, although there is considerable common variation between them, each captures some unique information. Furthermore, the correlation between leverage and ICR shows that while they share a significant interrelationship (-0.565) both capture and introduce new information in my analysis.
31 Table 3
Pearson Correlations (P values are displayed in parentheses)
(1) (2) (3) (4) (5) (6) (7) (8) (9) (10) (11) Book Leverage 1 Log ICR -0.54 1 (0.00) CEO Relative leverage -0.2 0.2 1 (0.00) (0.00) CEO Relative leverage >1 -0.14 0.2 0.59 1 (0.00) (0.00) (0.00) Surplus Cash -0.19 0.48 0.18 0.18 1 (0.00) (0.00) (0.00) (0.00) CEO Vega -0.01 0.11 0.01 -0.02 0.19 1 (0.49) (0.00) (0.35) (0.52) (0.00) CEO Delta -0.1 0.14 -0.29 -0.1 0.06 0.24 1 (0.00) (0.00) (0.00) (0.00) (0.00) (0.00) Return on Assets (ROA) -0.09 0.53 0.17 0.15 0.5 0.12 0.09 1 (0.95) (0.00) (0.00) (0.00) (0.00) (0.00) (0.00) Altman Z-score -0.47 0.69 0.18 0.19 0.49 0.1 0.17 0.48 1 (0.00) (0.00) (0.00) (0.00) (0.00) (0.00) (0.00) (0.00) Market-to-Book -0.03 0.46 0.14 0.16 0.58 0.16 0.15 0.54 0.66 1 (0.02) (0.00) (0.00) (0.00) (0.00) (0.00) (0.00) (0.00) (0.00) Total assets 0.09 -0.09 0.06 0.04 0.01 0.2 0.02 0.06 -0.21 -0.03 1 (0.00) (0.00) (0.71) (0.00) (0.65) (0.00) (0.26) (0.73) (0.00) (0.05)
32 3.6 Findings
3.6.1 The association between CEO inside debt holdings and firm financial policies
Table 4 presents my empirical results with regard to Hypothesis H1. More specifically, I present information results for six alternate specifications of model 1. Columns 5 and 6 have the dependent variable calculated at time t with the independent and control variables lagged by one fiscal year (t-1). Overall, I find a negative and significant relationship between firm book leverage and CEO relative leverage. However, in specifications 5 and 6 of my model (columns 5 and 6 respectively), while the coefficient of interest is negative as predicted by theory, it is not statistically significant. In columns 1-4 the relationship between CEO relative leverage and book leverage is negative and significant at the 1% level. My findings suggest that CEOs with large inside debt incentives may seek to mitigate the debt burden of their firms. The results presented in columns 5 and 6 though urge me to interpret my results with caution even though the rest of my model results agree with my theoretical expectations and are consistent with prior literature (Cassel et al., 2012). As a robustness check, I repeat my regression analyses using an alternative measure for book leverage as denoted by Cassel et al. (2012)6. My
results (untabulated) are qualitatively similar. More specifically, I find that the coefficient on my variable of interest is negative and statistically significant at the
6 Book leverage=(at-ceq)/at
33
1% level except in specifications 5 to 6, where while the coefficient is negative, it lacks statistical significance.
Concerning the rest of my model's variables, I document a negative relationship between surplus cash and firm book leverage. These results appear to be consistent with the pecking order model as advocated by Myers and Majluf (1984) which suggests that managers prioritise the funding of their investments with internal funds before seeking other sources of financing. Furthermore, a decrease in the CEO pay-performance sensitivity (CEO Delta)7 results in an increase in
leverage results. Additionally, an increase in risk seeking incentives (CEO Vega) results in an increase in firm book leverage. These results are consistent with previous research (Coles et al., 2006). Additionally, an increase in ROA and Market-to-Book results in an increase in firm book leverage. This relationship is expected as borrowing has the potential to affect a company's profitability positively through the development of debt-funded capital assets as dictated by the cost-benefit analysis. However, borrowing may also prove to be a dangerous practice as it raises the financial distress costs of the company, this is evidenced in my analyses by the significantly negative association between book leverage and ALTZ.
7 One possible reason for the weaker significance of Vega in my firm fixed effects specifications according to Coles et al. (2006) is that firm policies and Vega are strongly associated in the cross-section but not in the time series. This lack of association in time series may be the reason for the failure of the fixed effects model to detect a significant relation between risk-taking incentives and firm policies.
34 Table 4
The association between the CEO relative leverage ratio and firm financial policies risk (Book Leverage)
This table presents regression results in which the dependent variable is book leverage. In columns 1–4, the dependent variable is measured in year t. In columns 5–6, the independent variable is measured in year t-1. Variable definitions are provided in the Appendix. Each model includes year fixed effects. p-Values (in parentheses) are based on robust standard errors that are clustered at the firm level (gvkey). ***, **, And * represent significance at the 1 %, 5 %,and 10 % levels respectively.
Book Leverage t Book Leverage t-1
(1)Pooled OLS (2 Pooled OLS (3)FE (4)FE (5)FE (6)FE Log CEO Relative leverage -0.01*** -0.01*** -0.01
(0.000) (0.003) (0.541) (0.000) CEO Relative leverage >1 -0.02*** -0.01*** -0.01
(0.002) (0.005) (0.221) Surplus Cash -0.45*** -0.47*** -0.31*** -0.31*** -0.086** -0.14*** (0.000) (0.000) (0.000) (0.000) (0.019) (0.001) CEO Delta -0.03*** -0.02*** -0.01* -0.001 -0.02*** -0.02*** (0.000) (0.000) (0.091) (0.409) (0.000) (0.000) CEO Vega 0.20** 0.17* 0.09* 0.07 0.073 0.07 (0.028) (0.064) (0.077) (0.148) (0.193) (0.205) Tangibility ratio 0.01 0.01 0.05 0.04 -0.01 -0.01 (0.656) (0.707) (0.375) (0.433) (0.295) (0.389) Return on Assets (ROA) 0.50*** 0.51*** 0.25*** 0.25*** 0.12* 0.12** (0.000) (0.000) (0.001) (0.001) (0.060) (0.049) Altman Z-score -0.06*** -0.06*** -0.05*** -0.05*** -0.03 0.16** (0.000) (0.000) (0.000) (0.000) (0.353) (0.037) Market-to-Book 0.09*** 0.09*** 0.07*** 0.07*** 0.03*** 0.03*** (0.000) (0.000) (0.000) (0.000) (0.000) Tax indicator 0.01 0.01 0.01 0 0 0 (0.388) (0.344) (0.629) (0.773) (0.738) (0.790) Log (Total assets) -0.01 -0.01 0.03*** 0.02** 0.02** 0.02** (0.206) (0.183) (0.007) (0.011) (0.032) (0.026) Near retirement indicator 0.01 0.01 0.01 0.01 -0.01 -0.01
(0.911) (0.761) (0.621) (0.865) (0.704) (0.647) Firm age -0.01*** -0.01*** 0.01 0.01 0.01*** 0.01*** (0.000) (0.000) (0.731) (0.945) (0.010) (0.006) Intercept 0.26*** 0.29*** -0.02 0 0.06 -0.06 Observations 4906 4906 4906 4906 3892 3892 Adjusted R-squared 0.44 0.42 0.38 0.37 0.11 0.11
35
I also document a significant and positive relationship between firm leverage and firm age which is consistent with more mature businesses having easier access to debt funding. Regarding firm size, I only document a significant and positive relation in the fixed effects models. This lack of significance in my pooled OLS models could be potentially attributed to its effects being captured by other controls and the fact that firm size is not time-variant.
Lastly, I find no statistically significant relationship with my tangibility proxy and the tax and near retirement indicators. Collectively, my findings suggest that there exists a negative association between CEO relative leverage and firm book leverage. These results are in agreement with prior work who argue that inside debt incentives can promote managers to follow less risky corporate policies (Cassel et al. 2012; Eisdorfer et al., 2013)
3.6.2 The relation between CEO inside debt holdings and firm solvency
For my second hypothesis, I empirically test the association of the CEOs relative leverage with the firm’s interest coverage ratio. I employ ICR as a measure of a firm's solvency since it provides a decent assessment of a company’s short-term financial health while it can at the same time capture elements of its profitability.
Table 5 presents results for six alternative specifications of my model (model 2) with the logarithm of the Interest coverage ratio (LogICR) being the dependent variable. Columns 5 and 6 have the dependent variable calculated at time t with the
36
independent and control variables calculated at time t-1. In all columns, the variable of interest is again the natural logarithm of CEO relative leverage and the indicator variable CEO relative leverage > 1. Although a sensible control for the model 1 regression analysis, ALTZ is excluded from the H2 regressions since it measures financial distress costs which ICR also captures to a great extent.
Overall, I document a positive and significant relationship between ICR and my two proxies of CEO inside debt incentives in all six of my model specifications. Moreover, my results remain not only significant in all my model specifications but also display consistency in their economic magnitudes.
Concerning the rest of my control variables, I document a significant and positive relationship between my dependent variable (LogICR) and Surplus cash which is reasonable since surplus cash represent funds available to invest in new projects which risk-averse managers are known to treat as a contingency measure (Liu et al., 2014). Furthermore, I document a significant and positive relationship between my dependent variable and firm profitability which is expected since ICR are frequently employed as a profitability ratios.
Additionally, though I document a positive and significant relationship at all conventional levels with my investment opportunity set control variable (Market-to-Book) in my fixed effects models only, in the pooled OLS model coefficients lack statistical significance.
37 Table 5
The association between the CEO relative leverage ratio and firm financial policies risk (ICR)
This table presents OLS regression results in which the dependent variable is the Interest Coverage ratio. In columns 1– 4, the dependent variable is measured in year t. In columns 5–6, the independent variable is measured in year t-1. The sample is constructed as described in Table 1 and variable definitions are provided in the Appendix. P-Values (in parentheses) are based on robust standard errors that are clustered at the firm level (gvkey). Pooled OLS denotes pooled OLS regression model while FE denotes a fixed effects panel regression model. ***, **, And * represent significance at the 1 %, 5 %, and 10 % levels respectively.
Dependent variable
(1)Pooled OLS (2) Pooled OLS (3)FE (4)FE (5)FE (6)FE
logICR logICR logICR logICR LogICRt-1 LogICRt-1
Log of CEO Relative leverage 0.09*** 0.08*** 0.03** (0.00) (0.00) (0.02)
CEO Relative leverage > 1 0.33*** 0.21*** 0.19*** (0.00) (0.00) (0.00) (0.00) (0.00) (0.00) Surplus Cash 3.92*** 3.97*** 3.74*** 3.72*** 1.35*** 1.32*** (0.00) (0.00) (0.00) (0.00) (0.00) (0.00) CEO Delta -0.18 0.16 -0.51 -0.28 0.65 0.74 (0.79) (0.81) (0.35) (0.60) (0.16) (0.10) CEO Vega 0.32*** 0.24*** 0.04 -0.01 0.04 0.03 (0.00) (0.00) (0.41) (0.82) (0.19) (0.39) Tangibility ratio -1.03*** -1.01*** -1.72*** -1.64*** -2.07*** -2.00*** (0.00) (0.00) (0.00) (0.00) (0.00) (0.00) Return on Assets (ROA) 6.30*** 6.43*** 3.83*** 3.89*** 3.00*** 3.00***
(0.00) (0.00) (0.00) (0.00) (0.00) (0.00) Market-to-Book 0.15*** 0.15*** 0.26*** 0.27*** 0.33*** 0.33*** (0.01) (0.01) (0.00) (0.00) (0.00) (0.00) Tax indicator 0.03 0.03 0.01 0.02 0.01 0.013 (0.53) (0.52) (0.94) (0.75) (0.97) (0.82) Log(Total assets) -0.08*** -0.08*** 0.01 0.02 -0.34*** -0.34*** (0.00) (0.00) (0.85) (0.75) (0.01) (0.00) Near retirement indicator 0.05 0.06 -0.01 0.01 -0.02 -0.03
(0.31) (0.20) (0.79) (0.96) (0.50) (0.47) Firm age -0.01 0 -0.01 -0.01 0.03*** 0.028*** (0.52) (0.87) (0.68) (0.76) (0.00) (0.00) Intercept 2.10*** 1.88*** 1.76*** 1.42** 3.48*** 3.29*** Observations 4906 4906 4906 4906 3892 3892 Adjusted R-squared 0.42 0.41 0.27 0.27 0.19 0.19
38
While one might expect a negative relationship since ICR is a solvency ratio which debtholders regularly employ as a restrictive covenant8, the positive sign it
exhibits has possible explanations. As mentioned before, ICR is both a profitability as well as a debt ratio. While risk-averse managers could sacrifice growth opportunities to enhance their firm debt serviceability, they can also achieve this by reducing the volatility of their operating earnings.
With regard to firm size, my results are rather interesting in that my coefficient signs and statistical significance change between my alternate models. In particular, my measure for firm size displays a positive sign in my fixed effects model and no statistical significance and is highly significant but negative under all other model specifications. The relationship between ICR and firm asset tangibility is also of potential interest. In all my model specifications and under all conventional levels I document a negative relationship between my tangibility ratio and ICR. One possible explanation is that as a firm’s intangible assets (such as patents and brand name recognition) increase in value relative to the firm’s tangible assets firm sales also increase. Therefore, the firm can service its pre-existing debt obligations by capitalising on the effects of its intangible assets and does not require the aid of additional debt funding to do so (for which tangible assets are required as collateral).
39
Lastly, in all my models CEO Vega is highly insignificant while CEO Delta is only significant in my pooled OLS models. Furthermore, Firm age as well as my Tax indicator and Near retirement indicator variables all highly insignificant.
Overall, my results are consistent with Hypothesis H1 and provide support for the theory that managers with significant inside debt incentives become more risk-averse and tend to mitigate the debt burden of their firms.
3.7 Findings discussion and future research possibilities
Overall, I document a significant and negative relationship between firm book leverage and CEO inside debt incentives and a significant and positive association between ICR and CEO inside debt incentives. Collectively, my results suggest that CEOs with large inside debt incentives manage their firms more conservatively and implement less risky financial policies.
While my findings are indicative of debt incentivised managers acting more conservatively when it comes to implementing firm financial policies, they also indicate that perhaps their aim is to increase both the long as well as the short-term financial stability and sustainability of the firm. To that extent, it can be theorised that inside debt compensation can also affect the operations of the company. In my second hypothesis, I established that highly debt incentivised managers increase the serviceability of their firm debt. Another potential route is to ensure that operating cash flow volatility is less susceptible to fluctuations and at sufficient levels to service the company's debt obligations. Therefore, an interesting premise for future
40
research the association between firm operating leverage and CEO inside debt incentives.
3.8 Limitations
While my results indicate a significant relationship between firm book leverage, ICR and CEO inside debt holdings, due to data limitations I only use level based inside debt measures and do not adjust my variables for the effect of inflation. The first issue is a restriction for my study as my proxies do not account for any alterations in the value of equity or debt (Wei and Yermack, 2011). To better capture these changes a proxy that estimates the effect of a one-dollar increase in firm value on the value of the CEO’s inside debt/equity ratio and the respective firm debt/equity ratio would be more appropriate. Also, as prior work suggests that CEO cash compensation is significantly debt-like in nature, studies of CEO inside debt frequently use the cash adjusted CEO relative leverage as a measure of inside debt incentives.
While I attempt to control for reverse causality and potential endogeneity issues, I only manage to mitigate my concerns. I fully acknowledge that endogeneity may still be present in my analysis and bias my results. A possible way to manage this issue is to employ a model using the two-stage-least-squares framework which, provided the correct instruments are chosen, would help increase the validity of my results.
In addition to testing Hypothesis 1, I note the possibility of a mechanical relationship existing between firm book leverage and CEO relative leverage. Furthermore, to the best of my knowledge, ICR has sparsely been used in prior
41
literature as a variable of interest. ICRs may vary among industries and may suggest that a company besides solvent is also "too safe" and sacrifices opportunities to magnify earnings through leverage. Furthermore, ICR is not a perfect measure of a company's financial health. The effect of taxes is not taken into account as they are not included in the earnings figure used to derive the ratio. Furthermore, a firm could be accruing an interest expense that is not due for actual payment in its current fiscal year as denoted by Compustat, so the ratio can indicate a debt obligation that does not respond in the current time period. Nevertheless, while I acknowledge its limits, I consider ICR a valid estimation measure for the purpose of my analysis as it allows me to establish a more robust connection between CEO debt incentives, firm solvency and firm financial policies.
42
Chapter 4 Small sample analysis
Inside debt holdings and CEO gender
4.1 Motivation and theoretical background
Extant literature suggests that in general, women tend to be more risk-averse relative to men. (Croson and Gneezy, 2009; Charness and Gneezy, 2012). This difference in risk-aversion levels has also been documented in the case of financial risk, where men are established to be more over-confident compared to women (Barber and Odean, 2001; Huang and Kisgen, 2013). The gender difference in financial risk preferences is also supported by Bajtelsmit et al. (1996) who document that most women hold a significantly less amount of risky assets in their investment portfolios than men. Also, with regard to pension investment choices Bajtelsmit and VanDerhei (1997) suggest that women are more inclined to choose fixed income investments, which are considered safer, and hold a smaller amount of company stock.
Furthermore, empirical evidence suggests that not only are women more risk averse than men when it comes to financial and investment risk, but they also bring these qualities on the executive board when appointed to top management positions. Faccio et al. (2015) using a sample containing both privately and listed European firms document that female-CEO firms exhibit lower leverage and earnings volatility and a higher likelihood of survival compared to male CEO ones. Furthermore, they conduct a time series analysis and report a decline in overall firm risk in the period following the replacement of a male by a female CEOs. Overall,
43
they suggest that female CEOs exhibit lower risk tolerance and a higher likelihood to implement less risky financial policies. Consistent with this argument, Huang and Kisgen (2013) examine a sample of 116 firms where females hold the position of CEO or CFO and document that women tend to act more conservatively when it comes to corporate policies relative to men. In particular, they provide evidence that women top executives initiate fewer acquisitions and are less inclined to issue debt.
4.1.1 CEO gender and executive compensation
Besides a difference in financial risk preferences, prior research also documents a gender-based disparity when it comes to compensation. This difference is known in academic and public cycles as the gender pay gap and suggests women in managerial positions receive less compensation compared to men (Blau and Kahn, 2000). However, when it comes to the compensation of the CEO, a consensus has not been achieved. More specifically, Mohan and Ruggiero (2007) develop a non-parametric model that controls for both gender and firm performance and document that apart from cash salary female CEOs display reduced compensation levels compared to male ones. These results suggest that boards under-compensate women top executives and at the same time offer them greater cash compensation since it better suits their risk profile. However, Khan and Vieito (2013) even though they note the appointment of female CEOs result in smaller firm risk levels, find no difference in the proportion of stock option compensation between male and female CEOs. Consistent with these results, Bugeja et al. (2012) using both a total and a propensity score matched sample fail to find any evidence of a gender pay gap. Furthermore, their results indicate that
44
even if women exhibit more conservative and risk averse behaviour compared to men, they are not less inclined to accept variable pay that is tied to firm performance.
Overall, women are considered to be more conservative when it comes to their personal financial risk relative to men. Furthermore, even when they hold top executive positions, they usually continue to be more conservative in their financial and investment corporate decisions. In addition to that, investors seem to acknowledge this trait of them. In particular, Martin et al. (2009) document a reduction in firm risk following the appointment of female CEOs. As a result, one would naturally expect compensation committees to design compensation contracts based on the CEOs gender characteristics. However, as was mentioned before, academic literature provides conflicting results on the matter. While some studies identify differences in the structure of compensation packages between genders, when it comes to the position of CEO most actually find no difference between the pay structure between females and males.
However, to the best of my knowledge no study has examined the association between inside debt compensation and CEO gender. As was discussed above, women are according to some studies inherently less risk tolerant than men. Furthermore, Huang and Kisgen (2013) study the effect of CEO and CFO gender on corporate policy choices in a U.S firm setting and report that female executives as less inclined to issue debt and implement more conservative investment policies. At the same time, in my large sample analysis, I document that as the inside debt holdings of the CEO increase, she becomes more risk averse and seeks to lower the debt burden of the firm. Therefore, inside debt seems to provide the CEO with
45
incentives that introduce behaviours which women appear to possess inherently. As a result, the examination of the relationship between inside debt compensation and CEO gender serves as a very interest premise.
Therefore, for my small sample analysis, I aim to explore whether any gender-related differences exist with regard to the CEOs inside debt compensation. As a result, I examine whether the proportion of inside debt compensation and the level of inside debt incentives offered at female CEOs is different compared to male CEOs.
Consistent with Bugeja et al. (2012), I acknowledge that since agency theory provides no formal guidance when it comes to gender-related differences and prior empirical evidence do not reach a common consensus on the matter, I am unable to form a formal prediction. As a result, I treat the association between CEO inside debt compensation and gender as an empirical issue.
4.2 Data and sample selection
For my small sample analysis, I construct two subsamples of CEOs based on their gender. Due to the imbalance between male and female CEO9, I employ a
matched sample for my analysis. Previous studies on gender-based pay differences also use sample matching techniques (Bugeja et al., 2012). Martin et al. (2009) and Mohan and Ruggiero (2003), argue that company size and industry are the primary determinants of CEO pay. For this reason, they rank firms in each industry
9 According to a report by Catalyst, a non-profit organisation that advocates for
women in business, for 2016 only 4% of the Standard & Poor’s firms had a female CEO.