Contents lists available atScienceDirect
Journal of Environmental Management
journal homepage:www.elsevier.com/locate/jenvmanResearch article
The value of manure - Manure as co-product in life cycle assessment
Adrian Leip
a,∗, Stewart Ledgard
b, Aimable Uwizeye
c,d,e, Julio C.P. Palhares
f, M. Fernanda Aller
g,
Barbara Amon
h, Michael Binder
i, Claudia M.d.S. Cordovil
j, Camillo De Camillis
c,
Hongming Dong
k,l, Alessandra Fusi
m, Janne Helin
n, Stefan Hörtenhuber
o, Alexander N. Hristov
p,
Richard Koelsch
q, Chunjiang Liu
r, Cargele Masso
s, Nsalambi V. Nkongolo
t,u,v, Amlan K. Patra
w,
Matthew R. Redding
x, Mariana C. Rufino
y, Ruben Sakrabani
z, Greg Thoma
aa, Françoise Vertès
ab,
Ying Wang
acaEuropean Commission, Joint Research Centre, Ispra, VA, Italy
bFarm Systems & Environment Group, AgResearch, Private Bag 3123, Hamilton, New Zealand
cFood and Agriculture Organization of the United Nations, Animal Production and Health Division, Rome, Italy
dAnimal Production Systems Group, Wageningen University & Research, PO Box 338, 6700 AH,, Wageningen, the Netherlands eTeagasc – Crops, Environment and Land Use Programme, Johnstown Castle, Wexford, Y35 Y521, Ireland
fEnvironmental Impacts and Water Management in Livestock, Embrapa Southeast Livestock, São Carlos, SP, Brazil gI.S.Environment, UK
hLeibniz Institute for Agricultural Engineering and Bioeconomy (ATB), Germany and University of Zielona Góra, Faculty of Civil Engineering, Architecture and Environmental Engineering, Poland
iEvonik Nutrition&Care GmbH, Germany
jUniversity of Lisbon, Instituto Superior de Agronomia, LEAF, Lisboa, Portugal
kInstitute of Environment and Sustainable Development in Agriculture, Chinese Academy of Agricultural Sciences, Beijing, 100081, China lKey Laboratory of Energy Conservation and Waste Treatment of Agricultural Structures, Ministry of Agriculture, Beijing, 100081, China mThe University of Manchester, School of Chemical Engineering and Analytical Science, UK
nNatural Resources Institute Finland, Unit of Bioeconomy and Environment, Helsinki, Finland oResearch Institute of Organic Agriculture FiBL, Vienna, Austria
pThe Pennsylvania State University, USA qUniversity of Nebraska - Lincoln, USA
rSchool of Agriculture and Biology, Shanghai Jiao Tong University, PR China sInternational Institute of Tropical Agriculture, Nkolbisson, Messa, Yaounde, Cameroon tARC-Institute for Soil, Climate and Water, South Africa
uDept of Agriculture and Animal Health, UNISA, South Africa vIFA-Yangambi, Dem. Rep. Congo
wWest Bengal University of Animal and Fishery Sciences, Department of Animal Nutrition, Kolkata, India xQueensland Department of Agriculture and Fisheries, Australia
yLancaster University, Lancaster Environment Centre, Lancaster, UK zSchool of Water, Energy & Environment, Cranfield University, United Kingdom aaRalph E. Martin Department of Chemical Engineering, University of Arkansas, USA abUMR SAS, INRA, Agrocampus Ouest, 35000 Rennes, France
acInnovation Center for U.S. Dairy, USA
A R T I C L E I N F O
Keywords:
Life cycle assessment Livestock supply chains Nutrients
Fertilizer Allocation Manure
A B S T R A C T
Livestock production is important for food security, nutrition, and landscape maintenance, but it is associated with several environmental impacts. To assess the risk and benefits arising from livestock production, trans-parent and robust indicators are required, such as those offered by life cycle assessment. A central question in such approaches is how environmental burden is allocated to livestock products and to manure that is re-used for agricultural production. To incentivize sustainable use of manure, it should be considered as a co-product as long as it is not disposed of, or wasted, or applied in excess of crop nutrient needs, in which case it should be treated as a waste. This paper proposes a theoretical approach to define nutrient requirements based on nutrient re-sponse curves to economic and physical optima and a pragmatic approach based on crop nutrient yield adjusted
https://doi.org/10.1016/j.jenvman.2019.03.059
Received 12 April 2018; Received in revised form 29 January 2019; Accepted 13 March 2019 ∗Corresponding author.
E-mail address:[email protected](A. Leip).
0301-4797/ © 2019 The Authors. Published by Elsevier Ltd. This is an open access article under the CC BY license (http://creativecommons.org/licenses/BY/4.0/).
for nutrient losses to atmosphere and water. Allocation of environmental burden to manure and other livestock products is then based on the nutrient value from manure for crop production using the price of fertilizer nutrients. We illustrate and discuss the proposed method with two case studies.
1. Introduction
The livestock sector contributes to the livelihood of millions of people, but their production poses several environmental challenges such as greenhouse gas emissions, eutrophication, acidification and biodiversity loss (Mottet et al., 2017). While livestock products are rich in essential macro- (e.g. proteins) and micronutrients (e.g. Zn, Fe, Vi-tamins, seeParodi et al., 2018) contributing globally 18% of food en-ergy and 25% of food protein (Steinfeld et al., 2006) the consumption of livestock products can also be associated with health risks (Springmann et al., 2018;Willett et al., 2019). Livestock can help transfer and con-vert proteins from plant biomass (e.g. grass or by-products, rangelands, or food waste) into animal-sourced foods utilizing resources that otherwise cannot be consumed by humans, but in other cases livestock production is in competition with other land uses such as food, fiber and energy production (Van Zanten et al., 2018).
Ruminants, pigs and poultry have very different nutritional re-quirement for crude protein and energy, feed conversion efficiencies, and pathways of N excretion in manure. Feed N conversion efficiencies are highest for pigs and poultry, and lowest with beef cattle and depend on the type and amount of N consumed by each particular livestock species (Flachowsky, 2002; Huhtanen and Hristov, 2009). In general terms, between 55 and 95% of the nitrogen (N) and about 70% of the phosphorus (P) ingested by livestock are excreted through urine or feces (Menzi et al., 2010). A further inefficiency can occur from im-balances between nutrient imports (e.g. purchased feeds, animals) and managed exports (e.g. sale of animal products, manure) in livestock production systems, resulting in nutrient losses to the environment and additions to soil storage (Waldrip et al., 2015).
The management of nutrient supply for agricultural production is central to agriculture and food supply chains. It has driven the devel-opment of agricultural practices through time, such as manure re-cycling and crop residues management, as well as the application of mineral fertilizer since its invention in the early 20th century (Erisman et al., 2008;Gerber et al., 2014). The considerable perturbation of the nutrient cycles since the industrialization of agriculture through in-creased fertilizer use and agricultural production has amplified the detrimental effects on ecosystems and human health (Galloway et al., 2003;Leip et al., 2015;Sutton et al., 2011). There is great uncertainty on how best to strike a balance between fertilizer (and manure) nutrient recommendations, economic yield, nutrient use efficiency (NUE) and environmental outcomes (Dalgaard et al., 2014). The nutrient value of manure has long been recognised but the ease of use of inexpensive manufactured mineral fertilizers has led to their dominance in many industrialized countries (Powell et al., 2010).
Life cycle assessment (LCA) is a widely used tool to assess the en-vironmental impacts of livestock supply chains and of resultant pro-ducts (e.g.Gerber et al., 2010;van Zanten et al., 2016;Weiss and Leip, 2012). Where multiple products are produced, the environmental emissions are allocated between the various co-products, usually re-cognizing the stepwise procedure outlined in ISO14044 (ISO, 2006). When manure is produced as an output from livestock systems it may be considered as a waste or residual, where all system emissions are as-signed to the other products, or as a co-product where it is recognised as a valuable product. For example, in the Livestock Environmental As-sessment and Performance (LEAP) partnership guidelines on poultry (FAO, 2016a) and large ruminants (Fao, 2016b) it is recommended that if manure is a valuable co-product, the production system emissions are allocated using a biophysical approach based on the energy for diges-tion that is generated by the animal for producdiges-tion of the manure.
Economic allocation based on the relative revenue received for manure compared with that for the other co-products at the farm-gate could be a viable alternative. In practice, however, the economic revenue from manure may be an artifact of regulatory policy and may not be a good representation of the true value of the manure, depending on the geo-graphical context. Manure also has value to improvements in soil quality and productivity, for example in building up organic matter or improving soil water retention, which often are difficult to quantify and are variable based upon past soil management practice. In most cases, manure is used as a valuable resource because of its nutrient value, particularly a source of the major nutrients of N and P, none of the current approaches is able to properly reflect this benefit that drives farmers to accept manure. Thus, an alternative approach for allocating emissions from a manure co-product could be based on its nutrient value.
The objective of this study is to present a new methodology for the allocation of emissions in livestock supply chains over the co-products, based on the nutrient value of manure for crop production. In Section2 we first introduce the concept and a method called ‘theoretical ap-proach’. As data for this approach will in most cases be unavailable we simplify the approach in Section2.2(‘pragmatic approach’). The con-cept is illustrated using two case studies introduced in Section2.3-2.4 with the results presented in Section3and discussed in Section4. We finally conclude in Section5.
This study was developed in the context of the technical advisory group on modelling of nutrient flows and impact assessment in the li-vestock supply chains (FAO, 2018) of the Livestock Environmental Assessment and Performance (LEAP) Partnership. The LEAP Partner-ship is a multi-stakeholder initiative composed of three stakeholder clusters: Governments, Private Sector, and Civil Society and Non-Gov-ernmental Organizations and is hosted by the Food and Agriculture Organization of United Nations (FAO).
2. Methods
In the following, we develop a method for the quantification of the allocation of upstream emissions from a livestock system A between manure and other livestock products using attributional LCA, where the manure is used outside this livestock system. We do so based on the value that the manure provides to a system B which can be another livestock system, a crop system, or a non-agricultural system. As such, the method could be described as a ‘hybrid’ allocation approach, since it looks beyond the point of allocation as done in system expansion ap-proaches. We note that this manuscript will look at the value that is carried with nutrients in manure thus ignoring other possible benefits of using manure. However, the approach described in this study can easily be extended to capture further benefits.
2.1. Theoretical approach 2.1.1. Fertilizer equivalent
To estimate the fertilizer value of manure, a framework based on plant growth curves is proposed as a basis to allocate environmental emissions from animal supply chains between the main animal products and manure. Most farmers use manure as an organic fertilizer because of its availability but the specific nutrient equivalent of the manure is often not estimated. This fertilizer equivalence defines the amount of manure that the farmer would apply if s/he had to purchase mineral fertilizers to provide the required nutrients (e.g. N and P) for plant uptake. Because manure is generally not traded with a price based on its
fertilizer properties, the fertilizer equivalence value needs to be esti-mated with other approaches. For nutrients, this can be measured using the synthetic mineral fertilizer that the farmer would buy in case the manure was not available.
For mineral fertilizers, the ‘economic optimum’ describes the ap-plication rate at which the marginal cost of additional fertilizer appli-cations is the same as the additional revenue from increased harvest. If the cost for the mineral fertilizer is Cmin nut, [US$ (kg nutrient)−1] and
revenue for the harvest is Rcrop[US$ (kg DM)−1], then the economic
optimum ecopt is the application rate of mineral fertilizer Qmin nut, [kg
nutrient ha−1yr−1] at which Equation(1)holds:
Ycrop ecoptRcrop= Qmin nut ecopt, Cmin nut, (1)
whereYcrop[kg DM ha−1yr−1] is the yield of a crop. For a full list of
symbols and indices used throughout the paper please see Section 7. For higher fertilizer application rates, the costs become higher and it is thus not rational to apply beyond the economic optimum from an agronomic perspective. However, if nutrients are free of costs, addi-tional application may lead to yield increases until the physical op-timum, beyond which application of fertilizers will not add any benefit. The nutrient equivalentfeqfor the nutrients contained in the manure defines the amount of mineral fertilizers that provides the same amount of nutrients to the crop. Here we are interested in the amount of manure that provides the same crop uptake as mineral fertilizers at the eco-nomic optimum for mineral fertilizers ecopt. We define therefore the nutrient equivalent feqas the ratio of mineral fertilizer application at the economic optimum and manure application rate providing the same uptake of nutrients (Equation(2)).
We define useful outputs (Qoutput,nut) as the nutrients taken up by the plant biomass, including crop residues (Qplant,nut), plus possible accu-mulation of the nutrient in the soil if ultimately available for crop up-take (Qssc,nut). The difference between all inputs and useful outputs of the nutrient nut (Qinput nut, Qoutput nut, ) gives the nutrient surplus
(Qsurplus nut, ) which equals the sum of all losses to atmosphere and
hy-drosphere (see the nutrient balance Equation (3)). Assuming equal distribution of nutrients across crop compartments (harvested crops, straw, crop residues, roots), the only difference in N output between different fertilizer types is the soil stock change (Qssc).
f Q
Q eq nut min nut ecopt
man nut ecopt
, , , , ,
=
(2)
Qinput nut, =Qplant nut, +Qssc nut, +Qsurplus nut, (3)
The concept is illustrated inFig. 1where a higher nutrient use ef-ficiency (NUE) is assumed for mineral fertilizer as compared to manure.
2.2. Value of manure
The value of the applied manure as a co-product is calculated from the amount of manure nutrients provided with manure up to yield that is achieved at the economic optimum for mineral fertilizers, net of nutrients that are obtained from other sources such as net soil miner-alization, biological nitrogen fixation, or atmospheric deposition. This is to emphasize sustainable use of those nutrient sources. We sum-marize them in the term ‘non-manageable nutrient input’ (Qnon-mgb) (Equation(4)). Note that because of the convention of considering soil mineralization (=depletion of soil nutrient stocks) as a negative output,
Qssc nut, is used in Equation(4)with a negative sign.
Qnon mgb nut, =Qbnf nut, +Qatmdep nut, Qssc nut, (4)
with ssc: soil stock changes, bnf: biological fixation of atmospheric ni-trogen, atmdep: atmospheric deposition. For P, this would include P release from bedrock.
Nutrients from land-applied manure and compost continue to be-come plant-available in successive growing seasons (Bar-Tal et al., 2004; Hadas et al., 1996; Hanč et al., 2008). Equation (6) allows
mineralization of residual manure-nutrient to be accounted for by in-creasing the input of Qssc,nutto Qnon-mgb,nut. This shifts the crop response curves for manure and mineral fertilizers (Fig. 1) to the right, de-creasing the requirement for nutrient inputs to meet current season demand. A range of models are available that enable this manure nu-trient mineralization and availability to be estimated (e.g.Archontoulis et al., 2014;Beraud et al., 2005).
In case the farmer applies manure at a rate beyond Qman nut ecopt, , (see
Equation(2)) when the response rate is declining but below the phy-sical maximum Qman nut MX, , s/he generates value only because the
manure is freely available (or cheaper than mineral fertilizers) and external costs caused by the losses are not internalized. This share of manure must be considered as a co-product but using a lower value.
The amount of manure valued as a co-product with the full fertilizer cost Cmin nut, is calculated as Qfull nut, in Equation(5). It is the manure
application rate at the economic optimum, or the total application rate of nutrients in manure if this is less than the application rate at the economic optimum.
Equation(6)calculates the additional manureQlow nut, , that is valued
as a co-product but with lower nutrient equivalent price. Qlow nut, is the
difference of the manure application rate and Qfull nut, , if positive – but
not more than the difference between Qman mx, and Qfull nut, . The lower
nutrient price is calculated from the integral of the additional benefit of manure application, being the nutrient equivalent value close to the economic optimum, and zero at the physical maximum, because no further yield increase results from the application. The lower nutrient price is therefore approximately half fertilizer price if Qlow nut, is at the
level or higher than at the physical maximum Qman mx nut, , . Generalizing,
we use a discount factor for calculating the total value of the applied manure Vman nut, in Equation(7).
Qfull nut, =min{Qman nut ecopt, , ,Qman nut, } (5)
Qlow nut, =max(0, min(Qman nut mx, , ,Qman nut, ) Qfull nut, ) (6)
V Q f C
Q Q f f C
( )
man nut coprd nut eq min nut
full nut low nut discount eq min nut
, , ,
, , ,
=
= + (7)
Fig. 1. Illustration of crop response curves for increasing application rates of
nutrients from mineral fertilizers and manure. This assumes a lower NUE for manure than for mineral fertilizers. In both cases, input of fertilizer is given in addition to non-manageable nutrient inputs from atmospheric deposition and biological N fixation, or mineralization of e.g. crop residues. The figure shows the location of the economic optimum (at rates for ecopt) and the physical optimum at rates mx.
In the case where multiple nutrients are assessed, the benefit of each nutrient is evaluated separately, and the values assumed to be additive in order to estimate the total value of the applied manure. Hence, in an example where both N and P are being evaluated, the total value of manure would be according to Equation(8):
Vman=Vman N, +Vman P, (8)
Any application of nutrients in manure beyond Qman mx nut, , is
con-sidered as waste (Qwaste) and all associated emissions are allocated back
to the livestock supply chain that produced the manure. The method for assigning a value (Qman nut, ) vs. waste (Qwaste) for nutrients applied in
excess should be nutrient specific.
Qwaste nut, =min(0,Qman nut, Qman mx nut, , ) (9) Fig. 2illustrates the possible cases for determining the amount of applied manure that is considered as a co-product or waste, or ‘remains’ within the same livestock supply chains.
2.2.1. Allocation of emissions
To allocate the emissions from the livestock supply chainElvst [kg CO2-eq] for manure versus other co-products (e.g. live-animals, eggs, wool, milk), the economic value is used. These emissions arise from the animals (e.g. enteric fermentation), housing, and manure treatment and management up to the point that it or a part of it is sold to a crop farmer, and all emissions from manure that is used within the supply
chain (the ‘NO’ branch at level A inFig. 2). The livestock co-products return a revenue to the farmer ofVlvst[US$]. But a part of the manure is
exported out of the supply chain for application to croplands or other uses. That manure can cause further emissionsEman[kg CO2-eq] at the point where it is stored and following application to the fields.
Generalizing Equation(8)for a situation where the manure is ap-plied on different fields i at a sharexi, the total value of applied manure
is obtained as in Equation(10): Vman x V i nut i man nut i, , = (10) The allocation of emissions to the livestock products ( lvstk) and
manure ( man)supply chains is according to economic allocation thus:
lvstk V V V man V V V lvstk man lvstk man man lvstk = = + + (11)
The total emissions to be allocated amongst the livestock products include also any emissions on the crop farm for any of the applied manure that is considered as a waste:
E E E x Q
Q
_
lvstk total lvstk man i i waste i man
,
= +
(12) For whole farm system analysis, allocation between the various li-vestock products (e.g. milk, meat, fibre) would be carried out using recommended protocols (e.g.FAO, 2016a, b IDF, 2015).
2.3. Pragmatic approach
In many situations, available information is insufficient to establish a crop response curve and NUE at the economic optimum for mineral fertilizers and/or manure are not available. In those cases, we propose to estimate the nutrient equivalent feqon the basis of actual crop nu-trient uptake rates and standard loss rates, using e.g. default loss rates as in the IPCC (IPCC, 2006) or LEAP (FAO, 2018) guidelines, taking into consideration environmental conditions and farm management prac-tices as far as possible, or using representative loss rates measured or modelled for representative/similar conditions. These conditions can be used to estimate standard mineral nutrient Q( min nut standard, , )and manure nutrient Q( man nut standard, , ) application rates. Thus, Equation (2)
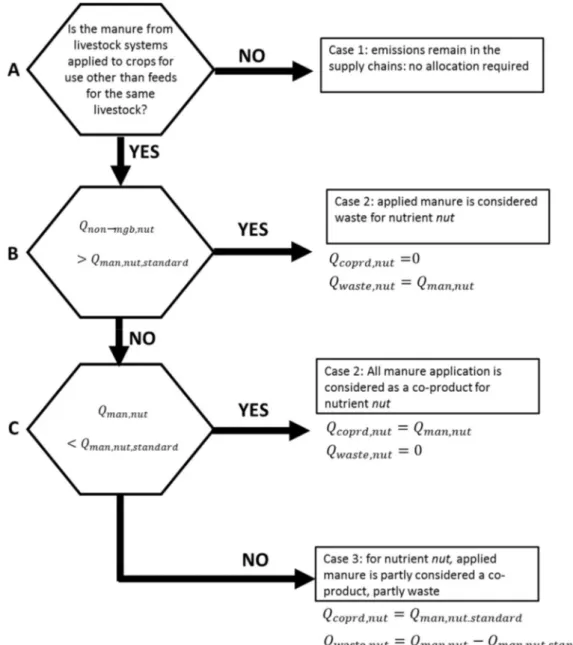
Fig. 3. A decision diagram illustrating the possible share of applied manure that is considered a co-product or a waste following the pragmatic approach. For
transforms to:
f Q
Q
eq nut min nut standard man nut standard
, , , , ,
=
(13) Assuming losses to the atmosphere and to the hydrosphere, both expressed as fractions of available nutrient that is lost through the re-spective pathways, the nutrient equivalent is obtained from Equation (14).
f
Frac Frac Frac Frac
Frac Frac Frac Frac
1 ( )
1 ( )
eq nut
atm man nut hyd man nut atm man nut hyd man nut atm min nut hyd min nut atm min nut hyd min nut
, , , , , , , , , , , , , , , , , = + + (14) whereby the term Fracatm min nut, , Frachyd min nut, , (and the corresponding
term for manure) is required to account for the fact that nutrients available for potential loss to the hydrosphere represent the net after subtracting the losses to the atmosphere. This is the case when losses occur mainly through leaching rather than run-off processes.
In the pragmatic approach, the standard application rate is esti-mated from the difference between crop uptake rate and losses. It is not possible to distinguish between the economic and physical optimum and the decision diagram simplifies to that inFig. 3. Thus, it is different from the theoretical approach in not directly recognizing the con-tribution from Qnon-mgtnor the variation in economic optimum rate with prices.
2.4. Case study A: organic poultry and dairy farms in Brazil
This case study uses data from an organic dairy farm in Sao Paulo State, Southeast region of Brazil which uses poultry manure from a neighboring farmer to fertilize maize fields for production of feeds as green maize and maize silage. This is motivated by the fact that the manure and milking parlor effluent from the dairy enterprise are in-sufficient to fertilize the maize area and that due to the organic system, application of a mineral fertilizer is not allowed.
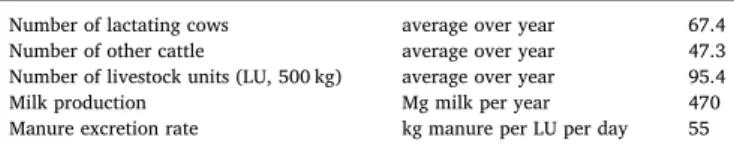
The dairy farm was monitored throughout the year 2016 with data available on a monthly basis (see supplementary information). Main annual data are provided inTable 1, while chemical characteristics of products and feeds are given inTable 2.
The dairy farm produced about 470 Mg milk, sold for a value of about US$ 224,000 from an average of 67.4 lactating cows (19 kg milk cow−1day−1). The protein content of milk was 3.74%. We assumed an N content of 6.38 g N g−1milk protein, and a P content of 0.9 g P kg−1 of milk (NEPA, 2012), giving a total of 2755 kg N in milk produced over the year. Manure excretion rate was 55 kg manure per livestock unit per day (LU, equivalent to 500 kg live weight; LW) totaling 1.9 kt manure year−1.
The feed mix for the lactating cows consisted of grass (20% protein), green maize (9% protein), soy meal (45% protein), and maize silage (9.5% protein). Feeding on rotational grass was possible during the wet season (September through April), and during the dry season (May through August) maize silage was fed. Over the year, a total of 12.6 t N was fed to the lactating cow herd (seeTable 3).
Most of the dairy manure was deposited on pasture land and the nutrients in the effluent from the milking parlor were insufficient for the cultivation of all the farm-grown feeds. Therefore, the farmer
purchased poultry litter from a neighboring poultry farm, applying 20 t ha−1on pasture and maize produced for silage. Thus, the farmer applied 464 kg N ha−1 year−1 on maize silage that compared to a harvest of only 230 kg N ha−1year−1(seeTable 4– results).
For the estimation of the allocation of emissions to the applied poultry litter we estimated a value for broilers of 0.65 US$ (kg poultry)−1and a value of mineral fertilizer of 0.7 US$ (kg N)−1.
The poultry farmer had three barns with 3300 chickens in each barn. Two-thirds of the poultry litter produced was sold to the dairy farmer.
2.5. Case study B: laying operation
FAO (2016c, appendix 3) proposes a method for physical allocation of burden to eggs, meat and manure using the partitioning of the me-tabolizable energy (ME) into ME requirements for maintenance, growth, and production. This is used to calculate the Heat Increment of Feeding (HIF) to produce eggs, meat, and manure. The method is illu-strated using an example of a laying operation with 1000 layers. Details on the calculation and background data for the example are found in FAO (2016c, appendix 3). The HIF-based allocation results in 46.5% for eggs, 27.4% for meat and 26.1% for manure, while the allocation be-tween eggs and meat only (treating manure as a residual) is 63% for eggs and 37% for meat. The average spent hen weight was 3.3 kg; the mass of eggs produced in 100 weeks was 23.3 kg. We compare these results with an economic allocation and a mixed allocation approach. The economic allocation requires farm gate prices of cereals, mineral fertilizers, eggs, and poultry meat, which were obtained from the CAPRI database (for the year 2008) for EU-28. Other data required to obtain the value of manure versus the value of eggs and poultry meat are the N and P contents in each co-product, and the edible fraction of the poultry body mass, which are given inTable 5.
This example has no ‘crop farmer’ who buys the manure but is il-lustrating that nutrient equivalents could be obtained in principle also without knowing specifically where the manure is applied.
3. Results
3.1. Case study A: organic poultry and dairy farms in Brazil
Table 6shows the data required to calculate the allocation factor to be applied to sold poultry manure for allocating emissions from poultry production (in housing and manure management before selling) to the dairy farm. The calculation assumes losses of ammonia (NH3) of 20% for both poultry litter (IPCC, 2006) and urea (EEA, 2016) and losses via leaching of 13% (estimated considering the climatic, soil and agri-cultural practices in the farm for poultry litter and assuming the same leaching rate for mineral fertilizer). With a crop uptake of 230 kg N ha−1year−1, this could have been met by application of 330 kg N ha−1 year−1of mineral nutrient equivalents (using the pragmatic approach). Applying a price of 0.7 US$ kg−1of N in mineral fertilizer, the value of the nutrient equivalent is 241 US$.
It is known that the poultry farmer sells two thirds of the poultry litter to the dairy farmer. Based on manure production of 1.1 kg N (1000 kg of broiler chickens)−1day−1 (IPCC, 2006) to calculate the amount of poultry per hectare-equivalent and a price of 0.65 US$ kg−1 of chicken sold, the revenue for chicken meat is US$ 1127.
The poultry farmer has thus two products from the poultry: poultry meat with a revenue of US$ 1127 for each ha of maize silage production the manure was applied to, and manure for an equivalent mineral fertilizer value of US$ 241 ha−1of maize silage production where the poultry litter was applied. This results in an economic allocation factor of 18%. However, the real price that was paid for the poultry litter was US$ 710 ha−1. The dairy farmer thus not only bought about 40% more poultry litter than would be required to achieve the same yield, but paid also a price that was almost three times as high as the price the farmer
Table 1
Key data of the Brazilian dairy farm.
Number of lactating cows average over year 67.4 Number of other cattle average over year 47.3 Number of livestock units (LU, 500 kg) average over year 95.4 Milk production Mg milk per year 470 Manure excretion rate kg manure per LU per day 55
would have had to pay for mineral fertilizers.
3.2. Case study B: laying operation
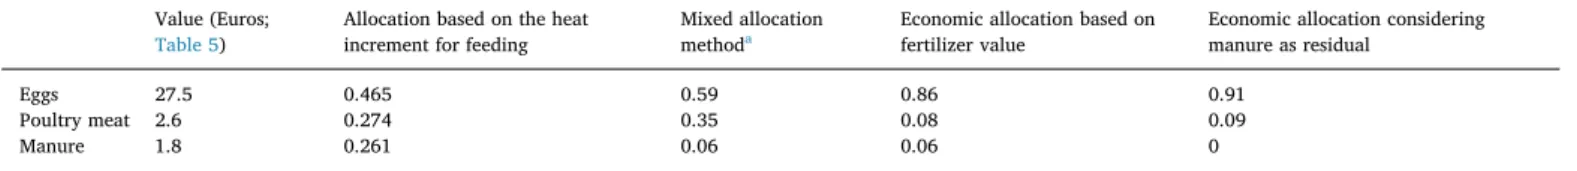
Using the data fromTable 5, the economic calculations result in allocation of 6% of emissions to manure, 94% to eggs (86%) and meat (8%) (Table 7). The allocation takes into consideration all value that manure gives to the farmer for crop production, which in this example is the sum of the economic values of N and P. However, other values could be considered as well (carbon, soil structural benefit), as long as the benefit can be monetized. The allocation amongst eggs and meat varies depending on whether the physical allocation factors developed byFAO (2016c)are used, or all allocation factors calculated based on economic allocation.Table 7compares the result of both methods with a ‘mixed’ approach (see footnote ofTable 7) and an economic approach considering manure as residual.
Thus where manure is considered as co-product, 6% of burden is allocated to the crop it is applied to (when it is applied to land). To determine if the application of manure is to be considered as waste, additional information is required, such as the sources of other inputs to the land including atmospheric deposition, biological fixation, and mineralization of soil organic matter or use of inputs from previous years (e.g. crop residues) (but not the input of mineral fertilizers), and the maximum amount of nutrients that should be applied at the eco-nomic and physical optima.
4. Discussion
Recognizing the nutrient value in manure and thus treating manure as a co-product may encourage the livestock farmers to ensure that nutrients in manure at excretion are not lost during manure manage-ment and storage as this will directly decrease the nutrient equivalent value of his/her product. Additionally, it is in the interest of livestock farmers to ensure appropriate use of the nutrients, i.e. no application rate in excess of crop needs. For farmers living in regions of high li-vestock density as is the case for many Brazilian farmers, there is generally an oversupply of manure, which leads to manure being wasted, unless it is processed and/or transported to regions with de-mand for manure.
However, economic incentives for efficient manure management practices and efficient nutrient use depend on the existence of a price for the external effects allocated, so we might hypothesize what would happen if GHG emissions from agriculture would be included in a carbon trading scheme? In practice, livestock farmers would need to be certified for the sustainable use of the manure in order to be able to get credits for the GHG emissions. This context holds also for the instances where manure is used for various other purposes including biogas generation (Amjid et al., 2011), biomass fuel (Roy et al., 2010), feeding of animals and fish (Negesse et al., 2007) and production of insects for feeds or foods (Hussein et al., 2017). In these situations, an approach similar to the one explained here could be developed, based on the value as a fuel or feed.
While cropping farmers are interested in the nutrient content of manures, there are also GHG emissions associated with their use. A farmer may only purchase manure if the GHG burden is equal or lower than the equivalent emissions from mineral fertilizer, or the price is lower so that the additional cost for GHG emissions is compensated. This view applies to regions where livestock density and feeding practices lead to oversupply of nutrient. In many low income countries such as those in Sub-Saharan Africa, manure is often the only source of nutrient for crop production and farmers often keep livestock of this reason (Rufino et al., 2007,2006).
If manure carries a higher GHG burden it will be less attractive to cropping farmers and would otherwise remain in the livestock supply chain, or need to be disposed of. The situation potentially changes if carbon sequestration associated with manure use is taken into
Table 2
Chemical properties of product and feeds from the Brazilian dairy farm.
Dry matter (DM) Protein content Nitrogen in protein N Concentration P Concentration g protein kg−1 g protein (g N)−1 g N kg−1 g P kg−1 Milk 37.4 6.38 5.86 0.9 Dairy manure 25 11.83 kg DM kg−1 g protein (kg DM)−1 g protein (g N)−1 kg N (kg DM)−1 kg P (kg DM)−1 Poultry litter 0.8 0.029 Grass 200 6.25 0.0320 Maize grain 90 6.25 0.0144 Soyabean meal 450 6.25 0.0720 Maize silage 0.379 95 6.25 0.0152 0.0016 Table 3
Feeding data for lactating cows (average n = 67.4).
Wet season Dry season Farm total* Sep–Apr May–Aug
kg DM day−1cow−1 kg DM day−1cow−1 kt N year−1
Feed Grass 10 5.0 Maize grain 8 4.5 2.4 Soyabean meal 1 4.5 3.9 Maize silage 10 1.3 Total 12.6 Table 4
On-farm feed cultivation.
Area Application poultry litter Productivity N content in harvested maize P content in harvested maize ha t ha−1 t ha−1 kg N ha−1year−1 kg P ha−1year−1
Rotational pasture 15 0
Pasture 4 20
consideration. In this case, it might be attractive for the crop farmer given the evidence that continuous applications of manure can increase soil C and N stocks (Zavattaro et al., 2017).
The value of manure, when applied at agronomic rates, may extend beyond nutrient replacement value to include soil quality improve-ments. These benefits are difficult to quantify economically but include natural resource and productivity value. Application of manure can influence the soil biological, physical and chemical environment with impacts on crop productivity, including benefits of macro-aggregate formation with reduced soil loss and runoff over several seasons
(Graham et al., 2014;Wortmann, 2013;Wortmann and Shapiro, 2008). An extensive literature review of 141 studies comparing manure sub-stitution for fertilizer revealed that manure had average reductions of 26% and 29% in nitrogen loss to surface and ground water, respectively (Xia et al., 2017).
What is the correct price for manure? In case study A, the farmer paid more per kg N in poultry manure than one would have to pay for mineral fertilizer. However, since organic farming prohibits the appli-cation of mineral fertilizer, manure is a scarce nutrient resource for such a high-productive crop and the farmer was thus prepared to pay a
Table 5
A Summary for the calculation of the value of the co-products as illustrative examples for eggs, poultry meat and manure. See text above.
Item Value N P Unit Note
a) Eggs
Weight produced 23.3 kg FAO (2016c), Appendix 3.
Nutrient content 0.018 0.002 kg (kg egg)−1 FAO, 2018, Appendix 6,Table 5, considering whole egg including shell
Nutrient in egg 0.43 0.04 kg
Price 1182 Euro/t CAPRI
Value 27.5 Euro
b) Poultry meat
Weight 3.3 kg FAO (2016c), Appendix 3. Carcass fraction 0.57 AfterRamirez et al. (2012)
Nutrient content 0.028 0.004 kg (kg body mass)−1 FAO, 2018, Appendix 6,Table 6, average of reported values
Nutrient in body mass 0.092 0.013 kg
Price 1379 Euro/t
Value 2.6 Euro
c) Manure
Weight 12.8 kg FOM + UN FAO (2016c), Appendix 3. Excretion of Faecal Organic Matter (FOM) and Urine Nitrogen (UN) at an intake of 84 kg of feed for a 100-weeks cycle of a layer with 3.3 kg cull weight and 23.3 kg of cumulative egg production.
Total nutrient intake 2.56 2.29 kg Total nutrient in manure 2.04 2.24 kg
Nutrient content 0.159 0.174 kg (kg FOM + UN)−1
Nutrient equivalent 44% 100% Assuming loss of N in manure management systems (MMS) of 50% (based on values indicated in
IPCC, 2006) and a higher volatilization rate upon application of 20% of manure versus 10% for mineral fertilizers. 100% nutrient equivalent assumed for P.
Fertilizer price 1037 409 Euro/t
Manure value 0.9 0.9 Euro
Table 6
Calculation of allocation factor for poultry emissions from maize silage via applied poultry litter.
Poultry Poultry litter Mineral fertilizer
Application of poultry-N t DM ha−1year−1 16
Losses as NH3 % 20 20 d
Losses in leaching % 13 13 e
N available for crops 323 230
N uptake by maize kg N ha−1year−1 230 230
Nutrient equivalent 100% 30% 30%
Application of poultry-N kg N ha−1year−1 464
Equivalent application of mineral fertilizer kg N ha−1year−1 330
Manure applied in excess of need kg N ha−1year−1 134
Manure production from broiler chickens kg N (1000 kg poultry)−1day−1 1.1 a
Price USe(kg poultry, kg N in poultry litter or mineral
fertilizer)−1 0.65 1.5 0.7
b
Value USeha−1 1127 710 241 c
Value of poultry litter according to nutrient
equivalents % 18%
Value of poultry litter according to price paid by the
dairy farmer % 39%
Notes.
a Source:IPCC 2006, Table 10.19.
b Price of poultry estimated. The price paid for the poultry litter was R$ 115 per ton of wet poultry litter. Average price of urea in Brazil in2016 was R$ 1,100,00 per ton or US$ 355 per ton = 1,26 US$ (kg N)−1(exchange rage 0.31 US$ per R$).
c Revenue from broiler chickens based on a price for chicken meat in Brazil of 0.65 US$ (kg poultry)−1and a share of poultry litter sold of 67%.
dVolatilization rates for manure as per defaultIPCC (2006); volatilization rate for mineral fertilizer assuming application of urea (45% N). Emission factor from EEA (2016), Chapter 3D-Table 3.2 EF for NH3emissions from fertilizers (in g NH3(kg N applied)−1) for urea in warm climate.
high price. In that case, it seems appropriate to allocate the higher share of 39% of poultry emission to maize silage production, which will in-crease the footprint of the milk as the main product at the dairy farm. On that farm, the application of manure was in excess of crop needs. We estimated that for a crop uptake of 230 kg N/ha, a quantity of more than 450 kg N/ha in poultry manure was purchased and applied. A large part of the applied manure was ‘wasted’. In Section2.1we argued that wasted manure (i.e. applied in excess of crop needs or not used at all for any benefit) is to be considered as ‘waste’ thus all emissions remain (or are ‘given back’) to the main product(s) of the farm where the manure was produced, i.e. to poultry meat. This might seem ‘counter-intuitive’ as the dairy farmer paid good money for the ‘wasted’ manure, but the associated emissions go back to the poultry farmer. This leads to the strange situation in this case study that 18% of emissions from poultry and poultry manure management before selling of the manure is allocated to milk, but 29% (i.e. 134 kg N ha−1excess of the total 464 kg N ha−1applied) of emission caused by management of the manure on the dairy farm and from application of the manure to the maize fields is allocated ‘back’ to poultry meat. Unfortunately, there is no information on the management and emissions of the poultry farm. An alternative method for estimating the allocation of poultry emission to the dairy milk is to use the price that has been paid. This would be the ‘normal’ approach for any economic allocation procedure, but prices may be distorted and this would not give reasonable results in most cases. The pressure of getting rid of the manure due to en-vironmental restriction for its application can lead to the fact that a price is paid that is more driven by the opportunity cost of having to dispose of the manure in other sustainable ways and could thus even be negative in case additional costs for the transport of the manure to the selling location occur to the farmer. In many cases though, manure is sold below the price of its fertilizer value and the price paid for manure can therefore not be used generally for the allocation of emissions.
The approach developed here is motivated to incentivize farmers producing manure to proper use of the nutrients beyond their own farm if they want to minimize the footprint of their products. If responsibility is transferred to the crop farmer, the livestock farmer has less motiva-tion to ensure proper use of the manure. In many cases, the price paid for the manure will be lower than the nutrient equivalent value, and in some cases there might not even be a crop product to which the waste could be allocated to. One way to incentivize change may be to assign the emissions of the wasted manure back to the livestock system. The crop farmer has less interest in using the manure carefully, although may be affected by other factors (e.g. effects on water quality or cost of fertilizer if manure nutrient value is ignored), but needs to ‘certify’ proper use to the livestock farmer. Thus, this approach engages both partners and makes both liable if the manure is applied excessively.
Empirical evidence from crop-livestock mixed farming in Kenya (Castellanos-Navarrete et al., 2015) shows that manure is often the only source of nutrients for crops, representing a modest amount of the total crop uptake (16 kg N per ha), and about 300 kg C per ha to the soil. Yet, this addition of nutrients is crucial to sustain the production of food crops in the absence of other sources of nutrients ( Castellanos-Navarrete et al., 2015). A recent study by Rurangwa et al. (2017) suggested that, in Rwanda, cattle manure is sold to crop farmers that
grow vegetables, but its price is variable by district. For example, in the Kamonyi district, a pit of 5 t of manure, which contained 45 kg N, 25 kg P and 65 kg K cost 27 US$, whereas in Bugesera, it cost 13.45 US $, despite containing more nutrients, i.e. 90 kg N, 10 kg P and 70 kg K. Considering N only, the difference in manure price was 4-fold between these districts. The overall price, however, was lower than the urea market price in Rwanda, estimated at 1.41 US$ kg N−1.This indicates that in some countries, manure is treated as a valuable resource, but uncertainty in the benefit means that its price is variable and conse-quently cheaper than fertilizer.
In the Brazilian case study, we accounted only for the value of ni-trogen in the poultry litter, while case study 2 accounted for N and P in manure. However, co-application of N and P in manure might lead to a situation of a high nutrient equivalent value for one nutrient and no fertilizer value for another nutrient. In several countries manure was seen as a source of N mainly but had led to excessive accumulation of P in soils resulting in eutrophication of aquatic and terrestrial ecosystems. In this case, application of manure should be based on the required rate of the most limiting nutrient (P) in order to avoid the negative con-sequences related to over-application of that nutrient. The approach proposed in this paper needs therefore to be seen as one of several measures that needs to be combined for example with application limits to avoid food safety risks related to pathogens, heavy metals or other substances, and ensure environmental stewardship. Individual nutrients might be given value only if the soil test concentration is at levels consistent with recommendations for crop response from nutrient supplementation, taking into consideration multiple cropping years for less mobile nutrient such as P. The time window for evaluating manure nutrient value vs. waste should be specific for all nutrients commonly supplemented in a fertility program (most commonly N and P, possibly K, S, and Fe).
5. Conclusion
We developed a relatively simple methodology that calculates the allocation of emissions from livestock production systems to manure and other animal products such as eggs, milk, or meat. As manure is often traded at a price that is not necessarily linked to its fertilizer value, the approach quantifies the value of an equivalent application of mineral fertilizers, which the farmer would apply in order to achieve the same crop yields. We believe that embedding a part of the emissions from livestock supply chains in the manure that is used as a fertilizer on crops outside the supply chains might contribute to increased aware-ness of the environmental effects of emissions associated with manure and consequently more sustainable management of manure. However, this can work only if the cost of the externalities caused by manure (contribution to global warming, health impacts through air pollution, coastal eutrophication, to name a few) are priced into their causes, the emissions of GHGs and losses of nutrients to atmosphere and waters. Overall, the approach developed here could potentially contribute to more awareness of the consequences of excess manure production and ultimately to improved management. Improved manure management could increase overall yield which would be important in countries/ regions where nutrients are a limiting valuable resource, as noted in
Table 7
Allocation factors of the poultry system in the example over eggs, poultry meat and manure on the basis of economic allocation between manure and food products and physical allocation based on heat increment for feeding (FAO, 2016c).
Value (Euros;
Table 5) Allocation based on the heatincrement for feeding Mixed allocationmethoda Economic allocation based onfertilizer value Economic allocation consideringmanure as residual
Eggs 27.5 0.465 0.59 0.86 0.91
Poultry meat 2.6 0.274 0.35 0.08 0.09
Manure 1.8 0.261 0.06 0.06 0
some African countries. Greater use of manure with less waste could lead to increased circularity and reduced fertilizer requirement. Contributions
AL conceived the idea of the paper; AL, SL and AU contributed equally to the writing of the manuscript; JP contributed with data and calculations for the Brazilian case study; all co-authors contributed with discussions of the approach and to the writing of the manuscript.
Acknowledgement
This work is conducted in the context of the Livestock Environmental Assessment Performance (LEAP) Partnership (GCP/ GLO/369/MUL) and is supported by the Livestock Information, Sector Analysis and Policy Branch (AGAL) of Food and Agriculture Organization of United Nations (FAO). We thank all the co-authors and their institutions that have contributed in kind for the development of the LEAP guidelines on the Nutrient flows and environmental impacts in livestock supply chains. CMdSC acknowledges support from the NitroPortugal project (H2020 692331 CSA).
Glossary
Economic optimum The economic optimum is the nutrient application rateNecoptat which the marginal cost of additional nutrient application (e.g.
the cost of the next kg of applied fertilizer) equals the marginal revenue induced by the additional nutrient application (that is the revenue obtained from increased harvest induced by the increased nutrient supply). Nutrient application rates N N> ecopt lead to a negative
marginal cost for the farmer
Non-manageable nutrient sources This includes nutrients supplied by atmospheric deposition, biological nitrogen fixation or mineralization of soil organic matter. These nutrients depend (partly) on farm management practices, but cannot be precisely steered by the farmers and come at no (additional) cost
Nutrient equivalent The nutrient equivalentfeqis the ratio of mineral fertilizer application at the economic optimum and manure application rate yielding the same N uptake
Physical optimum The physical optimum is the nutrient application rateNmxat which additional supply of nutrients do not lead to an additional
plant nutrient uptake. Practically, the physical optimum is defined as the nutrient application rate at which the plant nutrient uptake reaches a certain threshold (e.g. 95% or 99% of the maximum plant nutrient uptake)
Symbols used
IndicesExplanations see glossary and/or symbols used. i Fields over which manure is applied
p Point of application rate – optional index for supply rates of nutrientsp {ecopt mx standard, , }
t Type of nutrient flow t {input output plant non, , , mgb ssc bnf atmdep min man coprd waste, , , , , , , }
s Source of burden/emissions. s {man lvst livstock total crop, , _ , } atmdep Atmospheric deposition
bnf Biological nitrogen fixation
coprd Manure considered as a co-product
Crop Crop (system)
ecopt Economic optimum
full Manure valued with full fertilizer price
low Manure valued with lower than fertilizer price
input Input of a nutrient lvstk Livestock (system)
lvstk_totalLivestock system including a share of burden from other systems allocated to the livestock system
mx Physical optimum
min Mineral fertilizer
man Manure
non-mgb Non-manageable sources of nutrients
nut Nutrients. In this study nut { , }N P , but other nutrients or beneficial properties of manure could be included as well
plant Uptake of nutrients into the plant biomass
output All useful outputs of nutrient
ssc Soil stock changes. Accumulation of nutrients in the soil are considered as (useful) output, while depletion of nutrients in the soils are negative outputs.
standard Default of representative loss rates of nutrients, obtained from official guidelines or measurement/modelling at similar conditions surplus Soil nutrient surplus
waste Manure considered as waste
s dimensionless Allocation factor for burden to a co-product s Cmin nut, US$ (kg
Nutrient)−1 Cost of nutrient nut supplied with nutrient source type min (min = mineral fertilizer) Cman nut, US$ (kg
Nutrient)−1 Cost of nutrient nut supplied with the manure applied and considered as co-product for nutrient nut
Es X yr−1 Burden from source s. The kind of emissions considered depends on the nutrient and the context of the study. Here we assume that the
approach is used to allocate total greenhouse gas emissions, and X is therefore kg CO2eq, but the approach is applicable also to other types of
burden.
fdiscount dimensionless Discount factor for accounting for reduced benefit of manure application for rates between the economic optimum and the physical maximum for calculating the total value of the applied manure.
Fracloss t nut, , dimensionless Fraction of nutrient nut of type t lost to the atmosphere (loss = atm) or to the hydrosphere (loss = hyd). Losses are considered to be
sequentially, with losses to the atmosphere occurring before losses to the hydrosphere. Fracloss hyd, QUOTE needs therefore to be applied to the
nutrients that are remaining after accounting for losses to the atmosphere.
Qmin[,nut] kg Nutrient ha−1
yr−1 Application rate of the nutrient nut with fertilizer type min (min = mineral fertilizer) Qman nut[, ] kg Nutrient ha−1
yr−1 Application rate of the nutrient nut with nutrient source type man (min = manure)at the point p. Qt nut p[, ][, ] kg Nutrient ha−1
yr−1 Flux rate nutrient nut of type t from at the point p. Qfull nut, kg Nutrient ha−1
yr−1 The amount of manure valued as a co-product with the full fertilizer price for nutrient nut Qlow nut, kg Nutrient ha−1
yr−1 The amount of manure valued as a co-product with lower than fertilizer price for nutrient nut Qcoprd nut, kg Nutrient ha−1
yr−1 The amount of manure valued as a co-product considering Nfull nut, Nhalf nut 1
2 ,
+ QUOTE for nutrient nut
NUEmin nut p[, ][, ] dimensionless Share of nutrient nut supplied with nutrient source type min (min = mineral fertilizer) at the point p that is taken up by the plant as a whole,
including crop residues, plus possible accumulation of nutrient in the soil.
Appendix A. Supplementary data
Supplementary data to this article can be found online athttps://doi.org/10.1016/j.jenvman.2019.03.059. Disclaimer
The views expressed in this article are those of the authors and do not necessarily reflect the views or policies of FAO or the European Commission.
References
Amjid, S.S., Bilal, M.Q., Nazir, M.S., Hussain, A., 2011. Biogas, renewable energy resource for Pakistan. Renew. Sustain. Energy Rev. 15, 2833–2837.https://doi.org/10.1016/j. rser.2011.02.041.
Archontoulis, S.V., Miguez, F.E., Moore, K.J., 2014. Evaluating APSIM maize, soil water, soil nitrogen, manure, and soil temperature modules in the midwestern United States. Agron. J. 106, 1025.https://doi.org/10.2134/agronj2013.0421.
Bar-Tal, A., Yermiyahu, U., Beraud, J., Keinan, M., Rosenberg, R., Zohar, D., Rosen, V., Fine, P., 2004. Nitrogen, phosphorus, and potassium uptake by wheat and their distribution in soil following successive, annual compost applications. J. Environ. Qual. 33, 1855.https://doi.org/10.2134/jeq2004.1855.
Beraud, J., Fine, P., Yermiyahu, U., Keinan, M., Rosenberg, R., Hadas, A., Bar-Tal, A., 2005. Modeling carbon and nitrogen transformations for adjustment of compost application with nitrogen uptake by wheat. J. Environ. Qual. 34, 664–675. Castellanos-Navarrete, A., Tittonell, P., Rufino, M.C., Giller, K.E., 2015. Feeding, crop
residue and manure management for integrated soil fertility management – a case study from Kenya. Agric. Syst. 134, 24–35.https://doi.org/10.1016/j.agsy.2014.03. 001.
Dalgaard, T., Hansen, B., Hasler, B., Hertel, O., Hutchings, N.J., Jacobsen, B.H., Stoumann Jensen, L., Kronvang, B., Olesen, J.E., Schjørring, J.K., Sillebak Kristensen, I., Graversgaard, M., Termansen, M., Vejre, H., 2014. Policies for agricultural nitrogen management—trends, challenges and prospects for improved efficiency in Denmark. Environ. Res. Lett. 9, 115002.https://doi.org/10.1088/1748-9326/9/11/115002.
EEA, 2016. EMEP/EEA Air Pollutant Emission Inventory Guidebook - 2016. Technical Guidance to Prepare National Emission Inventories. Publications Office of the European Union, Luxembourg.
Erisman, J.W., Sutton, M.A., Galloway, J., Klimont, Z., Winiwarter, W., 2008. How a century of ammonia synthesis changed the world. Nat. Geosci. 1, 636–639.https:// doi.org/10.1038/ngeo325.
FAO, 2018a. Nutrient Flows and Associated Environmental Impacts in Livestock Supply Chains. Guidelines for Assessment (Version 1). Livestock Environmental Assessment and Performance (LEAP) Partnership, Rome, Italy.
FAO, 2016a. Greenhouse Gas Emissions and Fossil Energy Demand from Small Ruminant Supply Chains. Guidelines for Assessment. Livestock Environmental Assessment and Performance (LEAP) Partnership. Food and Agriculture Organization of the United Nations, Rome, Italy.
FAO, 2016b. Environmental Performance of Large Ruminant Supply Chains: Guidelines for Assessment. Livestock Environmental Assessment and Performance (LEAP) Partnership. Food and Agriculture Organization of United Nations, Rome, Italy, pp. 232.
FAO, 2016c. Greenhouse Gas Emissions and Fossil Energy Demand from Poultry Supply Chains. Guidelines for Assessment. Food and Agriculture Organization of the United Nations, Rome, Italy.
FAO, 2018b. Nutrient flows and associated environmental impacts in livestock supply chains: Guidelines for assessment (Version 1). Livestock Environmental Assessment and Performance (LEAP) Partnership, FAO, Rome, pp. 196 Licence: CC BY-NC-SA 3.0 IGO.
Flachowsky, G., 2002. Efficiency of energy and nutrient use in the production of edible
protein of animal origin. J. Appl. Anim. Res. 22, 1–24.https://doi.org/10.1080/ 09712119.2002.9706374.
Galloway, J.N., Aber, J.D., Erisman, J.W., Seitzinger, S.P., Howarth, R.W., Cowling, E.B., Cosby, B.J., 2003. The nitrogen cascade. Bioscience 53, 341.
Gerber, P., Mooney, H.A., Dijkman, J., Tarawali, S., de Haan, C., 2010. Livestock in a Changing Landscape, vol. 2 Island Press Experiences and Regional Perspectives. Gerber, P.J., Uwizeye, a., Schulte, R.P.O., Opio, C.I., de Boer, I.J.M., 2014. Nutrient use
efficiency: a valuable approach to benchmark the sustainability of nutrient use in global livestock production? Curr. Opin. Environ. Sustain. 9, 122–130.https://doi. org/10.1016/j.cosust.2014.09.007.
Graham, E., Grandy, S., Thelen, M., 2014. Manure Effects on Soil Organism and Soil Quality. Emerging Issues in Animal Agriculture. Michigan State University Extension. Hadas, A., Kautsky, L., Portnoy, R., 1996. Mineralization of composted manure and mi-crobial dynamics in soil as affected by long-term nitrogen management. Soil Biol. Biochem. 28, 733–738.https://doi.org/10.1016/0038-0717(95)00179-4.
Hanč, A., Tlustoš, P., Száková, J., Balik, J., 2008. The influence of organic fertilizers application on phosphorus and potassium bioavailability. Plant Soil Environ. 54, 247. Huhtanen, P., Hristov, A.N., 2009. A meta-analysis of the effects of dietary protein con-centration and degradability on milk protein yield and milk N efficiency in dairy cows. J. Dairy Sci. 92, 3222–3232.https://doi.org/10.3168/jds.2008-1352. Hussein, M., Pillai, V.V., Goddard, J.M., Park, H.G., Kothapalli, K.S., Ross, D.A.,
Ketterings, Q.M., Brenna, J.T., Milstein, M.B., Marquis, H., Johnson, P.A., Nyrop, J.P., Selvaraj, V., 2017. Sustainable production of housefly (Musca domestica) larvae as a protein-rich feed ingredient by utilizing cattle manure. PLoS One 12, e0171708.
https://doi.org/10.1371/journal.pone.0171708.
IDF, 2015. A Common Carbon Footprint Approach for the Dairy Sector. The IDF Guide to Standard Life Cycle Assessment Methodology. Bulletin 479/2015 of the International Dairy Federation, Brussels. Belgium.
IPCC, 2006. IPCC Guidelines for National Greenhouse Gas Inventories, vol. 2 Energy.
ISO, 2006. ISO 14044: Environmental Management — Life Cycle Assessment — Requirements and Guidelines. International Organization for Standardization, Switzerland.
Leip, A., Billen, G., Garnier, J., Grizzetti, B., Lassaletta, L., Reis, S., Simpson, D., Sutton, M. a, de Vries, W., Weiss, F., Westhoek, H., 2015. Impacts of European livestock pro-duction: nitrogen, sulphur, phosphorus and greenhouse gas emissions, land-use, water eutrophication and biodiversity. Environ. Res. Lett. 10, 115004.https://doi. org/10.1088/1748-9326/10/11/115004.
Menzi, H., Oenema, O., Burton, C., Shipin, O., Gerber, P., Robinson, T., Franceschini, G., 2010. Impacts of intensive livestock production and manure management on the environment. Livestock in a Changing Landscape 1, 139–163.
Mottet, A., de Haan, C., Falcucci, A., Tempio, G., Opio, C., Gerber, P., 2017. Livestock: on our plates or eating at our table? A new analysis of the feed/food debate. Glob. Food Sec. 14, 1–8.https://doi.org/10.1016/j.gfs.2017.01.001.
Negesse, T., Patra, A.K., Dawson, L.J., Tolera, A., Merkel, R.C., Sahlu, T., Goetsch, A.L., 2007. Performance of Spanish and Boer×Spanish doelings consuming diets with different levels of broiler litter. Small Rumin. Res. 69, 187–197.https://doi.org/10. 1016/j.smallrumres.2006.01.008.
NEPA, 2012. Brazilian Table of Food Composition. [Tabela Brasileira de Composição de Alimentos.] [WWW Document]. http://www.unicamp.br/nepa/taco/.
Tuomisto, H., Valin, H., Middelaar, C.E., Loon, J.J.A., Zanten, H.H.E., 2018. The potential of future foods for sustainable and healthy diets. Nat. Sustain. 1, 782–789.
https://doi.org/10.1038/s41893-018-0189-7.
Powell, J.M., Gourley, C.J.P., Rotz, C.A., Weaver, D.M., 2010. Nitrogen use efficiency: a potential performance indicator and policy tool for dairy farms. Environ. Sci. Policy 13, 217–228.https://doi.org/10.1016/j.envsci.2010.03.007.
Ramirez, A.D., Humphries, A.C., Woodgate, S.L., Wilkinson, R.G., 2012. Greenhouse gas life cycle assessment of products arising from the rendering of mammalian animal byproducts in the UK. Environ. Sci. Technol. 46, 447–453.https://doi.org/10.1021/ es201983t.
Roy, P.C., Datta, A., Chakraborty, N., 2010. Assessment of cow dung as a supplementary fuel in a downdraft biomass gasifier. Renew. Energy 35, 379–386.https://doi.org/10. 1016/j.renene.2009.03.022.
Rufino, M.C., Rowe, E.C., Delve, R.J., Giller, K.E., 2006. Nitrogen cycling efficiencies through resource-poor African crop–livestock systems. Agric. Ecosyst. Environ. 112, 261–282.https://doi.org/10.1016/j.agee.2005.08.028.
Rufino, M.C., Tittonell, P., van Wijk, M.T., Castellanos-Navarrete, A., Delve, R.J., de Ridder, N., Giller, K.E., 2007. Manure as a key resource within smallholder farming systems: analysing farm-scale nutrient cycling efficiencies with the NUANCES fra-mework. Livest. Sci. 112, 273–287.https://doi.org/10.1016/j.livsci.2007.09.011. Rurangwa, E., Vanlauwe, B., Giller, K.E., 2017. Benefits of inoculation, P fertilizer and
manure on yields of common bean and soybean also increase yield of subsequent maize. Agric. Ecosyst. Environ. https://doi.org/10.1016/j.agee.2017.08.015. Springmann, M., Clark, M., Mason-D’Croz, D., Wiebe, K., Bodirsky, B.L., Lassaletta, L., de
Vries, W., Vermeulen, S.J., Herrero, M., Carlson, K.M., others, 2018. Options for keeping the food system within environmental limits. Nature 562, 519–525.https:// doi.org/10.1038/s41586-018-0594-0.
Steinfeld, H., Gerber, P., Wassenaar, T., Castel, V., Rosales, M., De Haan, C., 2006. Livestock's Long Shadow - Environmental Issues and Options. Food and Agriculture Organization of the United Nations, Rome, Italy.
Sutton, M.A., Oenema, O., Erisman, J.W., Leip, A., van Grinsven, H., Winiwarter, W., 2011. Too much of a good thing. Nature 472, 159–161.https://doi.org/10.1038/ 472159a.
Van Zanten, H.H.E., Herrero, M., Hal, O.Van, Röös, E., Muller, A., Garnett, T., Gerber,
P.J., Schader, C., De Boer, I.J.M., 2018. Defining a land boundary for sustainable livestock consumption. Glob. Chang. Biol. https://doi.org/10.1111/gcb.14321. van Zanten, H.H.E., Mollenhorst, H., Klootwijk, C.W., van Middelaar, C.E., de Boer,
I.J.M., 2016. Global food supply: land use efficiency of livestock systems. Int. J. Life Cycle Assess. 21, 747–758.https://doi.org/10.1007/s11367-015-0944-1. Waldrip, H.M., Cole, N.A., Todd, R.W., 2015. Nitrogen sustainability and beef-cattle
feedyards: I. Introduction and influence of pen surface conditions and diet. Prof. Anim. Sci. 31, 89–100.https://doi.org/10.15232/pas.2014-01361.
Weiss, F., Leip, A., 2012. Greenhouse gas emissions from the EU livestock sector: a life cycle assessment carried out with the CAPRI model. Agric. Ecosyst. Environ. 149, 124–134.https://doi.org/10.1016/j.agee.2011.12.015.
Willett, W., Rockström, J., Loken, B., Springmann, M., Lang, T., Vermeulen, S., Garnett, T., Tilman, D., DeClerck, F., Wood, A., Jonell, M., Clark, M., Gordon, L.J., Fanzo, J., Hawkes, C., Zurayk, R., Rivera, J.A., De Vries, W., Majele Sibanda, L., Afshin, A., Chaudhary, A., Herrero, M., Agustina, R., Branca, F., Lartey, A., Fan, S., Crona, B., Fox, E., Bignet, V., Troell, M., Lindahl, T., Singh, S., Cornell, S.E., Srinath Reddy, K., Narain, S., Nishtar, S., Murray, C.J.L., 2019. Food in the Anthropocene: the EAT–Lancet Commission on healthy diets from sustainable food systems. Lancet 6736, 3–49.https://doi.org/10.1016/S0140-6736(18)31788-4.
Wortmann, C., 2013. Agricultural Phosphorus Management and Water Quality Protection in the Midwest. University of Nebraska IANR Media-RP Heartland Regional Water Project.
Wortmann, C.S., Shapiro, C.A., 2008. The effects of manure application on soil ag-gregation. Nutrient Cycl. Agroecosyst. 80, 173–180.https://doi.org/10.1007/ s10705-007-9130-6.
Xia, L., Lam, S.K., Yan, X., Chen, D., 2017. How does recycling of livestock manure in agroecosystems affect crop productivity, reactive nitrogen losses, and soil carbon balance? Environ. Sci. Technol. 51, 7450–7457.https://doi.org/10.1021/acs.est. 6b06470.
Zavattaro, L., Bechini, L., Grignani, C., van Evert, F.K., Mallast, J., Spiegel, H., Sandén, T., Pecio, A., Giráldez Cervera, J.V., Guzmán, G., Vanderlinden, K., D'Hose, T., Ruysschaert, G., ten Berge, H.F.M., 2017. Agronomic effects of bovine manure: a review of long-term European field experiments. Eur. J. Agron. 90, 127–138.https:// doi.org/10.1016/j.eja.2017.07.010.