www.biogeosciences.net/13/3397/2016/ doi:10.5194/bg-13-3397-2016
© Author(s) 2016. CC Attribution 3.0 License.
Estimate of changes in agricultural terrestrial nitrogen pathways
and ammonia emissions from 1850 to present in the
Community Earth System Model
Stuart Riddick1,2,b, Daniel Ward3,a, Peter Hess1, Natalie Mahowald3, Raia Massad4, and Elisabeth Holland5
1Department of Biological and Environmental Engineering, Cornell University, Ithaca, NY, USA 2Centre for Atmospheric Science, Department of Chemistry, University of Cambridge, Cambridge, UK 3Department Earth and Atmospheric Sciences, Cornell University, Ithaca, NY, USA
4INRA, AgroParisTech, UMR1402 ECOSYS, 78850 Thiverval-Grignon, France
5Pacific Centre for Environment and Sustainable Development, University of the South Pacific, Suva, Fiji anow at: Atmospheric and Oceanic Sciences, Princeton University, Princeton, USA
bnow at: Department of Civil and Environmental Engineering, Princeton University, Princeton, NY, USA Correspondence to:Peter Hess ([email protected])
Received: 12 August 2015 – Published in Biogeosciences Discuss.: 28 September 2015 Revised: 6 May 2016 – Accepted: 12 May 2016 – Published: 13 June 2016
Abstract.Nitrogen applied to the surface of the land for agri-cultural purposes represents a significant source of reactive nitrogen (Nr) that can be emitted as a gaseous Nr species,
be denitrified to atmospheric nitrogen (N2), run off during
rain events or form plant-useable nitrogen in the soil. To investigate the magnitude, temporal variability and spatial heterogeneity of nitrogen pathways on a global scale from sources of animal manure and synthetic fertilizer, we de-veloped a mechanistic parameterization of these pathways within a global terrestrial land model, the Community Land Model (CLM). In this first model version the parameteri-zation emphasizes an explicit climate-dependent approach while using highly simplified representations of agricultural practices, including manure management and fertilizer appli-cation. The climate-dependent approach explicitly simulates the relationship between meteorological variables and bio-geochemical processes to calculate the volatilization of am-monia (NH3), nitrification and runoff of Nrfollowing manure
or synthetic fertilizer application. For the year 2000, approxi-mately 125 Tg N yr−1is applied as manure and 62 Tg N yr−1
is applied as synthetic fertilizer. We estimate the result-ing global NH3 emissions are 21 Tg N yr−1 from manure
(17 % of manure production) and 12 Tg N yr−1from
fertil-izer (19 % of fertilfertil-izer application); reactive nitrogen runoff during rain events is calculated as 11 Tg N yr−1from manure
and 5 Tg N yr−1from fertilizer. The remaining nitrogen from
manure (93 Tg N yr−1) and synthetic fertilizer (45 Tg N yr−1)
is captured by the canopy or transferred to the soil nitrogen pools. The parameterization was implemented in the CLM from 1850 to 2000 using a transient simulation which pre-dicted that, even though absolute values of all nitrogen path-ways are increasing with increased manure and synthetic fer-tilizer application, partitioning of nitrogen to NH3emissions
from manure is increasing on a percentage basis, from 14 % of nitrogen applied in 1850 (3 Tg NH3yr−1) to 17 % of
ni-trogen applied in 2000 (21 Tg NH3yr−1). Under current
ma-nure and synthetic fertilizer application rates we find a global sensitivity of an additional 1 Tg NH3(approximately 3 % of
manure and fertilizer) emitted per year per◦C of warming.
1 Introduction
Nitrogen is needed by all living things for growth. However, it is relatively inert in its most abundant form, diatomic ni-trogen (N2), and needs to be converted to a form of
reac-tive nitrogen (Nr)before it can be used by most plants for
growth (Visek, 1984). Supplying sufficient Nrfor maximum
crop yield is a major concern in agriculture. In preindus-trial times Nrdemand was partly solved with the use of
an-imal manure and seabird guano as well as crop rotation and the use of nitrogen-fixing crops (Smil, 2000). However, by the early 20th century the supply of these Nrsources could
not match the demands of an increasing population and the Haber–Bosch process of creating synthetic Nrwas developed
(Galloway et al., 2004).
The use of Nr to improve crop yield has become an
en-vironmental concern as Nrin synthetic fertilizer and manure
cascades through the soil, water and the atmospheric nitrogen cycles. Plants can readily use applied Nr for plant growth;
however, Nrwashed off fields or volatilized as gas can reduce
ecosystem biodiversity through acidification and eutrophica-tion (Sutton et al., 2013). Increased Nr in the hydrosphere
can lead to the subsequent degradation of riverine and near-shore water quality as the water becomes more acidic and the growth of primary producers blooms (Turner and Ra-balais, 1991; Howarth et al., 2002), which can alter the lo-cal interspecies competition and biodiversity (Sutton et al., 2012). Reactive nitrogen emissions into the atmosphere im-pact air quality through the ozone generation associated with the emissions of nitrogen oxide (e.g., Hudman et al., 2010) and the contribution of ammonia (NH3)to aerosol formation
(e.g., Gu et al., 2014). Nitrogen cycling also impacts climate through the stimulation of plant growth and the associated increase in carbon storage; through the associated emissions of N2O, a strong greenhouse gas; through emissions of
nitro-gen oxides and the associated ozone production; and through the emissions of NH3, with its potential to cool the climate
through aerosol formation (e.g., Adams et al., 2001). As a result of their dependence on environmental con-ditions, Nr pathways following manure or synthetic
fertil-izer application are likely to change as the climate changes. This study describes a biogeochemically consistent process-driven parameterization suitable for use in Earth system models for simulating Nr flows following the addition of
Nr as manure or synthetic fertilizer. The parameterization
is evaluated against local measurements of NH3 fluxes and
against global NH3flux estimates. This parameterization
al-lows simulations of the coupling between the nitrogen cycle and climate to explicitly include NH3emissions and the Nr
runoff from manure and synthetic fertilizer application. To our knowledge, no Earth system model has yet to explicitly predict changing nitrogen pathways from manure and syn-thetic fertilizer in response to climate. We note at the out-set that the representation of agricultural processes is highly simplified in the initial model version described here.
Sources of Nr largely fall into two categories: “new”
sources, created by chemical and biological processes, and those that are “recycled”, such as manure excretion by an-imals. The largest natural new Nr creation is by
biolog-ical nitrogen fixers found in the ocean, biologbiolog-ical nitro-gen fixers on land, and as the by-product of lightning es-timated at 140 Tg N yr−1±50 %, 58 Tg N yr−1±50 % and
5 Tg N yr−1±50 %, respectively (Fowler et al., 2013). The
dominant anthropogenic sources of new Nr are Haber–
Bosch-derived fertilizer (estimated at 120 Tg N yr−1±10 %
in 2005), the burning of fossil fuels (30 Tg N yr−1±10 % in
2000), and a further 60 Tg N yr−1±30 % (ca. 2005) from
bi-ological nitrogen fixers grown for human consumption, such as legumes (Fowler et al., 2013). Since preindustrial times, anthropogenic Nrcreation has increased from 15 Tg N yr−1
to the present estimate of 210 Tg N yr−1 (Galloway et al.,
2004; Fowler et al., 2013).
Animal manure is used to stimulate plant growth in agri-culture. It contains Nrrecycled from the soil produced when
animals eat plants. A comprehensive increase in livestock population is estimated to have increased global manure pro-duction from 21 Tg N yr−1in 1850 to the present estimate of
141 Tg N yr−1(Holland et al., 2005). It is suggested that this
increase in recycled Nrproduction speeds up the decay and
processing of plant biomass, releasing different Nrproducts
to the atmosphere when compared to natural decay processes (Davidson, 2009).
Projections of agricultural activity (Bodirsky et al., 2012) suggest continued increases in the application of synthetic fertilizers until the mid-21st century (and possibly beyond) concurrent with increases in manure production (Tilman et al., 2001). In addition to the increased use of organic and syn-thetic fertilizers in the future, NH3emissions are expected to
increase because of the impact of changing climate on nitro-gen biogeochemistry (Tilman et al., 2001; Skjøth and Geels, 2013; Sutton et al., 2013). Skjøth and Geels (2013) predict increases in future NH3 emissions of up to 60 % over
Eu-rope by 2100, largely due to increased NH3emissions with
temperature. Sutton et al. (2013) predict future temperature increases may enhance global NH3 emissions by up to
ap-proximately 40 % assuming a 5◦C warming. In addition to
future changes in climate-induced NH3 volatilization from
manure and synthetic fertilizer application, future changes in agro-management practices, soil microbiological processes and nitrogen runoff may also be expected.
Current estimates of the direct forcing of nitrate aerosols present as ammonium nitrate encompass the range from
−0.03 to−0.41Wm−2in the ACCMIP (Atmospheric
(Hauglus-taine et al., 2014). These estimates do not consider the impact of climate change on NH3emissions.
Modeling studies calculating NH3 emission from
ma-nure and synthetic fertilizer have broadly fallen into two categories: models that use empirically derived agricultur-ally based emission factors and more complex process-based models. Global emissions have almost been univer-sally estimated using the former approach. Emission fac-tors were used by Bouwman et al. (1997) to estimate global NH3 emissions in 1990 of 54 Tg N yr−1, with an
emis-sion of 21.6 Tg N yr−1 from domestic animals (Bouwman
et al., 1997). Beusen et al. (2008) also used emission fac-tors to estimate global NH3emission from agricultural
live-stock (21 Tg N yr−1)and synthetic fertilizers (11 Tg N yr−1)
in 2000; Bouwman et al. (2013) estimated emissions of 34 Tg NH3yr−1 on agricultural land, with 10 Tg NH3yr−1
from animal housing. A number of more recent global mod-els have included emission factors explicitly as a function of temperature (e.g., Huang et al., 2012; Paulot et al., 2014). Paulot et al. (2014) estimate current global NH3 emissions
of 9.4 Tg yr−1for synthetic fertilizer and 24 Tg yr−1for
ma-nure.
Alternatively, process-based or mechanistic models have been developed that estimate Nrflows, equilibria and
trans-formations between different nitrogen species as well as Nr
emissions from synthetic fertilizer and manure. Process mod-els have been used on the field to regional scale, but not on the global scale. These models generally do not simulate the runoff of Nr. For example, Génermont and Cellier (1997)
simulate the emissions of NH3(g) to the atmosphere after
considering the physical and chemical equilibria and trans-fer of Nr species (NH3(g), NH3(aq), and NH+4(aq)) in the
soil. The resulting model is used to calculate the NH3
emis-sions from synthetic fertilizer over France within the air qual-ity model, Chimere (Hamaoui-Laguel et al., 2014). Other examples include Pinder et al. (2004), who describe a pro-cess model of NH3emissions from a dairy farm, while Li et
al. (2012) describe a farm-scale process model of the decom-position and emission of NH3from manure.
The overall goal of this paper is to describe and analyze a global model capable of simulating nitrogen pathways from manure and synthetic fertilizer added to the surface of the land under changing climatic conditions. The model will al-low for a better global quantification of the climate, health and environmental impacts of a changing nitrogen cycle un-der climate change. The resulting model is designed out of necessity for use within an Earth system model so as to sim-ulate the interactions between the climate and the carbon and nitrogen cycles. Section 2 presents the overall methodol-ogy used here including a detailed description of the process model used to calculate climate-dependent nitrogen path-ways. Section 3 analyzes the model and includes a compari-son of simulated vs. site level measurements of NH3fluxes,
an analysis of the globally heterogeneous nitrogen pathways from applied manure and synthetic fertilizer over a range of
climatic regimes, model predictions for changes in nitrogen pathways from 1850 to present and the sensitivity of the re-sults to model parameters. Section 4 gives our conclusions.
2 Methods
In this section we describe a process model for the flow of agricultural nitrogen (FAN) that simulates NH3 emissions
and other Nr flows from applied manure and synthetic
fer-tilizer applications, including their spatial and temporal vari-ations, within an Earth system model, the Community Earth System Model 1.1 (CESM1.1). The FAN process model de-veloped here simulates the incorporation of manure and fer-tilizer Nr into soil organic matter and soil nitrogen pools
(Chambers et al., 1999), its volatilization as NH3to the
atmo-sphere and the direct runoff of Nrfrom the surface (Fig. 1).
The model is global in nature, is designed to conserve car-bon and nitrogen, and responds to changes in climate. It is designed to provide an interface between the application of manure and synthetic fertilizer and the nitrogen cycling de-veloped within the Community Land Model 4.5 (CLM4.5), the land component of the CESM.
Nitrogen pathways subsequent to the application of ma-nure or synthetic fertilizer depend on the complex interaction between both human and natural processes. In particular they depend on the biology and physics of the applied substrate, agricultural practices and climate. Bottom-up emission in-ventories with specified emission factors that take into ac-count the animal feed, the type of animal housing, if any, and the field application of the synthetic fertilizer or manure (e.g., Bouwman et al., 1997) are generally used in global chem-istry and chemchem-istry–climate applications. For example, this type of emission inventory (e.g., Lamarque et al., 2010) was used in the Atmospheric Chemistry and Climate Model Inter-comparison Project (ACCMIP) (Lamarque et al., 2013a) for assessing historical and future chemistry–climate scenarios and in assessing nitrogen deposition (Lamarque et al., 2013b) with implications for the carbon cycle. However, these in-ventories include very simplified representations of the ef-fect of climate on emissions, for example, by grouping coun-tries into industrial or developing categories (Bouwman et al., 1997). A seasonal emission dependence is not implicit in these bottom-up inventories although sometimes an empiri-cal relationship is applied (e.g., Adams et al., 2001; also see Skjøth et al., 2011).
In the first application of the model described here we take the opposite tact. We have minimized the description of agricultural practices, and instead emphasize the physi-cally based climate-dependent biogeochemistry of manure and synthetic fertilizer decomposition and the resultant ni-trogen pathways. While traditional bottom-up NH3emission
inventories reflect regional differences in agro-management practices and the resulting regional differences in NH3
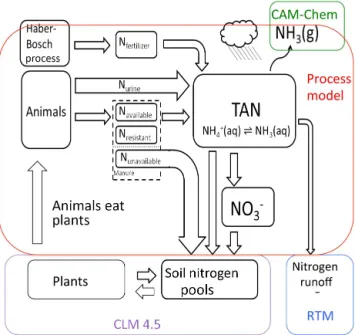
Figure 1.Schematic of the addition of the FAN (flow of agricultural nitrogen) process model to the CESM nitrogen cycle. Some minor pathways are not shown. Soil nitrogen pools and plant nitrogen
ex-ist in CLM4.5. Urine nitrogen (Nurine)is directly input to the TAN
pool, while fecal matter is split into three parts that decompose into
the TAN pool at a rate determined by their C : N ratio (Navailable,
Nresistant, Nunavailable).Manure nitrogen that does not mineralize
(Nunavailable)is added to the soil organic nitrogen pool. Nitrogen
applied as synthetic fertilizer is added to the Nfertilizerpool where
it decomposes into the TAN pool. Losses from the TAN pool
in-clude ammonia (NH3)emission (into CAM-chem), nitrogen runoff
(into the RTM), nitrate (NO−3)formation and diffusion to the soil
nitrogen pools.
and meteorological influences, including temperature, atmo-spheric mixing and rainfall. However, these influences are accounted for in the parameterization described below. As with regional differences in agro-management practices, me-teorological impacts may also induce large regional and in-terannual variations in NH3emissions. For example,
increas-ing the ground temperature from 290 to 300 K (at a pH of 7) increases the NH3emissions by a factor of 3 (see Sect. 2.2.6).
We recognize in this first application that we are simpli-fying many important agro-management processes. First, we assume that all synthetic fertilizer is urea and the pH of the soil is given. Different applied synthetic fertilizers have a strong impact on the pH of the soil–fertilizer mixture with the overall emission factor very dependent on the pH (White-head and Raistrick, 1990). Urea is the most commonly used synthetic fertilizer accounting for over 50 % of the global ni-trogenous synthetic fertilizer usage (Gilbert et al., 2006) and has one of the highest emission factors for commonly used synthetic fertilizers (Bouwman et al., 1997). Emission fac-tors for other types of fertilizers can be significantly smaller. Thus the estimates here for fertilizer NH3emissions may be
considered as an upper estimate. Second, we do not account for manure management practices. Instead we assume all ma-nure is continuously spread onto fields. In a global study Beusen et al. (2008) considered four primary pathways for manure nitrogen: (i) manure nitrogen lost from the system (14 % of the manure nitrogen, range 5–26 %), (ii) manure nitrogen excreted in animal houses followed by storage and subsequent spreading onto croplands (35 % of manure nitro-gen; range 24–51 %), (iii) manure nitrogen excreted in an-imal houses followed by storage and subsequent spreading onto pasture lands (7% of manure nitrogen; range 3–11 %), and (iv) manure nitrogen excreted by grazing animals onto pastures (44 % of manure nitrogen; range 29–59 %). Of the 42 % of manure nitrogen excreted in housing, 20 % (range: 12–28%) is emitted as NH3from housing and storage
facil-ities (Beusen et al., 2008). An additional 15–23 % of the re-maining manure nitrogen is emitted as NH3(range: 11–30 %)
after it is spread onto crop or pasture land. Of the 44 % of ma-nure nitrogen excreted by grading animals on pasture land 11–12 % (range 6–17 %) is emitted as ammonia. Consider-ing these various pathways the overall emission factor for manure nitrogen is estimated as 19 % in Beusen et al. (2008) (compare with 17 % in this study). Third, we do not account for specific fertilizer application techniques. For example, the soil incorporation of manure leads to a 50 % reduction in NH3emissions compared to soil broadcasting (Bouwman
et al., 2002). We recognize that there are large spreads in all these ranges and that regional practices may alter these num-bers, although large errors may be unavoidable due to insuf-ficient characterization of regional agro-management prac-tices.
In the present application we also simplify the representa-tion of NH3 fluxes to the atmosphere. The aerodynamic
re-sistances used to compute the flux of NH3to the atmosphere
are calculated with CLM4.5, but due to the configuration of the CLM they are not calculated at the plant function type (PFT) level. Instead, the canopy capture of the NH3flux is
calculated as a global number. The high spatial heterogene-ity of NH3emissions may preclude an accurate local
repre-sentation of exchange processes on the approximately 2×2◦
grid cell used here, although even on similar coarse resolu-tions Zhu et al. (2015) show the implementation of a bidirec-tional scheme has significant global and pronounced regional impacts. Nevertheless, the simulation of dynamic NH3
emis-sions, as described below, with NH3 emissions responding
to temperature on the model time step is a first step towards more accurately coupling terrestrial NH3fluxes with the
at-mosphere.
A number of requirements are necessary to model NH3
emissions following synthetic fertilizer or manure applica-tion within an Earth system model, specificaapplica-tions that are not necessary in more traditional formulations. (1) The model must be global in nature to characterize global interactions between applied Nr and climate. (2) The model must
ma-nure does not add new nitrogen to the system, but merely rep-resents a recycling of available nitrogen. Artificial sources or sinks of nitrogen may have serious repercussions, especially when simulating the global nitrogen cycle on the timescale of centuries. (3) The model must be able to simulate the chang-ing impact of climate on the fate of manure and synthetic fer-tilizer Nr. In particular, NH3emissions are sensitive to both
temperature and the water content of the soil. In addition, the runoff of Nr is likely to change under climate change. The
process model developed here is capable of simulating the physics of changing nitrogen pathways under a changing cli-mate.
An ideal model would incorporate a globally explicit rep-resentation of agro-management practices, including manure treatment (housing, storage and spreading) and fertilizer ap-plication (e.g., see Sutton et al., 2013). It would also in-clude an explicit representation of the bidirectional exchange of NH3between the land and atmosphere, including the
in-corporation of PFT dependent canopy deposition and aero-dynamic resistances. While the model developed here cap-tures many of the regional and global feacap-tures seen in models based on emission factors, here we emphasize the importance of regional and climatic changes in meteorology.
2.1 Relation between the FAN process model and the CESM1.1
The parameterization developed here acts as the interface be-tween specified manure and synthetic fertilizer application and the CESM1.1. The CESM1.1 simulates atmospheric, ocean, land and sea ice processes, linked together using a coupler, and includes a land and ocean carbon cycle (Hurrell et al., 2013; Lindsay et al., 2014). The CESM participates in the Climate Model Intercomparison Project (CMIP5) and has been extensively evaluated in the literature (see Hurrell et al., 2013). The land model within the CESM1.1, CLM 4.5, includes representation of surface energy and water fluxes, hydrology, phenology, and the carbon cycle (Lawrence et al., 2007; Oleson et al., 2008). CLM4.5 retains the basic properties of the previous model version (CLM4), which has been extensively tested and evaluated by many studies at the global (Lawrence et al., 2007; Oleson et al., 2008; Randerson et al., 2009) and the site (Stoeckli et al., 2008; Randerson et al., 2009) scale. CLM4.5 includes improvements to bet-ter simulate: (1) wabet-ter and momentum fluxes at the Earth’s surface; (2) carbon and nitrogen dynamics within soils and (3) precipitation runoff rates (Koven et al., 2013). CLM4.5 simulations can be forced by meteorology (as done here), or as a part of a coupled carbon–climate model (Lawrence et al., 2007; Oleson et al., 2008). The current version of the carbon model is an improved version of the coupled carbon– climate model used in Keppel-Aleks et al. (2013), Lindsay et al. (2014) and Thornton et al. (2009). The carbon model in-cludes a nitrogen limitation on land carbon uptake, described in Thornton et al. (2007, 2009). Further improvements have
been made to the below ground carbon cycle, as well as other elements of the land model in order to improve its perfor-mance (e.g., Koven et al., 2013; Lawrence et al., 2012). The impact of increases in nitrogen deposition (from fossil fuels, fires and agriculture; Lamarque et al., 2010) have been evalu-ated (Thornton et al., 2007, 2009) and extensively compared to observations (e.g., Thomas et al., 2013).
As described in Koven et al. (2013), CLM4.5 simulates the basic flows of Nrwithin soils following the Century N model
(Parton et al., 1996, 2001; Del Grosso et al., 2000), including the processes of nitrification, denitrification, and emissions of Nr and N2 and the loss of Nr from leaching and runoff.
CLM4.5 also simulates the transfer of Nrbetween soils and
vegetation, and the loss of Nrfrom fire. Sources of Nrwithin
CLM4.5 are from biological nitrogen fixation and from sur-face deposition. The process model developed here adds an additional source of Nrto CLM4.5, the addition of synthetic
fertilizer. It also adds an additional pathway whereby Nris
recycled: the creation and application of manure (Fig. 1). The relation between nitrogen cycling within the FAN pro-cess model developed here and that within the atmospheric, land and river components of the Community Earth System Model (CESM1.1) is given in Fig. 1. In this first study the subsequent fate of Nrfrom synthetic fertilizer or manure
ap-plication after it is incorporated into the soil organic matter or the soil nitrogen pools of CLM4.5 is not considered (see Fig. 1). As described in more detail below, synthetic fertilizer and manure are not applied to particular PFTs (e.g., pasture or grassland) within CLM4.5. This is because soil related properties including soil nitrogen are not specified at the PFT level within CLM4.5, but instead are specified at the column level that includes many PFTs. In practice we expect that the impact of this contamination across PFTs will be small since the major N-application regions (central US, northern India, eastern China) are not PFT-diverse but contain almost exclu-sively crop and grass PFTs.
Note that as a first approximation the model described here does not simulate the direct emission loss of species other than NH3. Atmospheric emission losses of N2O or N2(and
potentially NOx) are simulated in CLM4.5 (Koven et al.,
2013), the land component model of the CESM1.1, “down-stream” from the pathways explicitly considered here. In ad-dition, the fate of Nremitted into the atmosphere as NH3
di-rectly from synthetic fertilizer or manure is handled by the at-mospheric chemistry component of the CESM (CAM-chem) and is not considered here (Fig. 1). The runoff of Nrfrom
ma-nure or synthetic fertilizer nitrogen pools has been coupled to the river transport model (RTM) in Nevison et al. (2016) (Fig. 1) but is also not considered here.
2.2 FAN process model
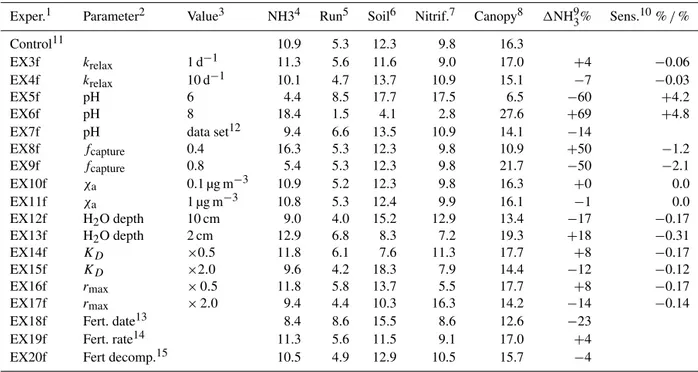
are detailed below where appropriate. Sensitivity to model parameters is given in Sect. 3.4. The Nr pathways are
cal-culated separately for manure and synthetic fertilizer. While this model assumes that synthetic fertilizer application and manure application can take place in the same approximately 2×2◦ grid cell, we assume that manure and synthetic
fer-tilizer are not applied in the exactly the same place. There-fore the NH3emissions, the nitrogen incorporation into soil
pools, and the nitrogen runoff are separately calculated for manure and synthetic fertilizer in each column. This means that the total ammoniacal nitrogen (TAN) pools (consisting of NH3(g), NH3(aq), and NH+4)for manure and synthetic
fer-tilizer are discrete and hence the nitrogen pathways are not combined.
The application rate and geographical distribution used for manure and synthetic fertilizer application is taken from the synthetic fertilizer application and manure production data sets developed in Potter et al. (2010). These data sets are valid for ca. 2000 for synthetic fertilizer and 2007 for ma-nure (Potter et al., 2010). As discussed above we assume that manure is continuously spread onto fields, by-passing the use of animal houses and storage. Manure and synthetic fertilizer is assumed to be spread across all PFTs in CLM4.5, as these share a common nitrogen pool. Future model versions will refine these initial assumptions.
To adequately model the conversion from manure to TAN it is necessary to separate the manure into four different pools depending on the decomposition timescales (Sects. 2.2.1 and 2.2.2 and Fig. 1). A similar strategy was adopted by Li et al. (2012) for manure and is commonly used in simulating litter decomposition. Synthetic fertilizer Nris added to one
pool, whereafter it decomposes into the TAN pool (Fig. 1). Once in the TAN pool Nr(1) washes off during rain events
(Brouder et al., 2005); (2) volatilizes as NH3(Sutton et al.,
1994; Nemitz et al., 2000), whereafter it is redeposited onto the canopy (not shown) or enters the atmospheric flow; (3) ni-trifies to form nitrate (NO−3)(Stange and Neue, 2009); or (4) is incorporated into the soil nitrogen pools. Nitrate, in turn, becomes incorporated into the soil (Fig. 1). A number of other smaller loss processes are not explicitly simulated.
Manure must be added to the model in such a manner as to conserve nitrogen (Fig. 1). Here, we assume animals con-sume carbon and nitrogen from plants and then subsequently excrete this as manure. Within the CLM, carbon and nitrogen in the plant-leaf pool is thus converted to carbon and nitro-gen in manure, conserving overall carbon and nitronitro-gen. The conversion rate from carbon and nitrogen in plants to that in manure is set to equal the rate of manure production. The external data set of Potter (2010) gives the rate of Nr
produc-tion from animals, and thus allows us to specify the nitro-gen flows. The specified C to N ratio in the plant-leaf pool determines the associated carbon flows due to ruminant con-sumption of plant material. The input manure production rate from animals implicitly includes that produced from trans-ported feed. Thus the subsequent NH3emission rate includes
the nitrogen contained in transported feed grown elsewhere. Here we make the simplification that the consumption rate of plant matter to balance the manure production is local. That is, we do not explicitly consider the import of animal feed to match the carbon and nitrogen flows associated with manure production. While this is not entirely consistent, the develop-ment of the requisite data set for feedstock flows from 1850– 2000 is outside the scope of this study. We do not know of an Earth system model that does consider the anthropogenic import of nitrogen or carbon. This inconsistency could pro-duce cases where there is insufficient local plant material to balance the overall manure and urine production, but this is generally not the case. The parameterization also ignores ex-port of Nr in ruminant products such as milk and protein,
and other Nrlosses, which could create an additional source
of uncertainty.
2.2.1 Manure and urine
Prescribed manure (including urine) is input at a constant an-nual rate(αapplied(m))(g m−2s−1)into the manure nitrogen
pools depending on latitude and longitude. It is assumed that a fraction (fu=0.5) of nitrogen excreted is urine, with the
re-maining 50 % excreted as fecal matter (Gusman and Mariño, 1999). In practice the fraction of nitrogen excreted as urine is highly variable and depends on the type of animal feed and other parameters (Jarvis et al., 1989). The excreted urine is directly added to the TAN pool (g N m−2). This is
con-sistent with urea forming the dominant component of urine N and the subsequent rapid conversion of urea to ammo-niacal form (Bristow et al., 1992). Feces are composed of matter with varying carbon to nitrogen ratios that take dif-ferent times to decompose depending on how easily they can be digested by microbes.Excreted feces are assumed to form three different pools (g m−2)depending on their rate of
mineralization (e.g., Gusman and Mariño, 1999): (1) we as-sume a fractionfun=5 % is excreted as unavailable nitrogen
(Nunavailable), the lignin component of manure where the
ni-trogen remains immobilized by bacteria (C : N ratio > 25 : 1); (2) a fractionfr=45 % goes to the resistant pool (Nresistant),
which forms the cellulose component of manure (C : N ra-tio ca. 15 : 1), which forms TAN relatively slowly; (3) and a fractionfa=50 % goes to the available pool (Navailable)that
is readily available to form TAN (Navailable). In reality the
The equations governing the three manure pools (see Fig. 1) are
dNavailable/dt=fa×αapplied(m)−Ka×Navailable
−km×Navailable, (1)
dNresistant/dt=fr×αapplied(m)−Kr×Nresistant
−km×Nresistant, (2)
dNunavailable/dt=fun×αapplied(m)−km×Nunavailable, (3)
where αapplied(m) is the amount of manure applied
(g m−2s−1);f
a,fr andfun are the fractions of manure
ap-plied to each pool; and Ka and Kr (s−1)are
temperature-dependent mineralization rates of these manure pools and into soil nitrogen pools. The decay constants, Ka and Kr,
are measured as the fast and slow decomposition rates for biosolids added to various soils and incubated at 25◦C
(Gilmour et al., 2003), where a two-component decay model accurately fits approximately 73 % of the samples incubated. The decay timescales for manure in the available and resis-tant pools at 25◦C are 48 and 667 days, respectively. The
temperature dependence of the decay constants is derived from a fit of temperature-dependent mineralization rates (see Appendix A) (Vigil and Kissel, 1995) corresponding to aQ10
value of 3.66. To prevent the manure pools from building up over long timescales we assume that manure is incorporated into soils with a time constant of 365 days with a mechan-ical rate constant km. This timescale is consistent with the
base bioturbation rate of 1 cm2yr−1 assumed in Koven et
al. (2013) and a typical length scale of 1 cm. The sensitiv-ity of the subsequent nitrogen pathways to this timescale is small (Sect. 3.4). Note that nitrogen in the Nunavailablepool
does not mineralize and is thus only incorporated into soil or-ganic matter on the timescale determined bykm. We assume
that nitrogen prior to conversion to TAN comprises a range of insoluble organic compounds that do not wash away or otherwise volatilize.
2.2.2 Synthetic fertilizer
Synthetic fertilizer nitrogen is added to the Nfertilizer pool
(g N m−2)(Fig. 1) at a rate (α
applied(t )(f )) (g N m−2s−1)
that depends on geography and time. The amount of nitrogen within the synthetic fertilizer pool is subsequently released into the TAN pool at the ratekf(s−1):
dNfertilizer/dt=αapplied(f )−kf×Nfertilizer. (4)
Here we assume all synthetic fertilizer is urea. We set the de-cay timescale of urea fertilizer to be 2.4 days, consistent with the decay rate measured in Agehara and Warncke (2005) for temperatures from 15 to 20◦C. In a series of experiments
Agehara and Warncke (2005) show that 75 % of the urea hy-drolyzes in a week at temperatures from 10 to 25◦C without
a significant dependence on temperature especially for tem-peratures above 15 to 20◦C.
The timing for synthetic fertilizer application is deter-mined internally within the CLM4.5 crop model (Levis et al., 2012) as the spring planting date for corn. Note, how-ever, that except for the determining the timing of fertilizer application, the crop model is not used. We use the planting date for corn since the CLM4.5 crop model only specifically includes corn, soybean and temperate cereals and the plant-ing date for corn lies between the earlier plantplant-ing date for temperate cereal crops and the later planting of soy. The date for fertilizer application is determined for each grid point lo-cation using the surface temperature-based criteria developed by Levis et al. (2012) for simulating the planting date of corn: the 10-day running mean temperature, 10-day running mean daily minimum temperature and growing degree days must all surpass fixed threshold values (283.15 and 279.15 K and 50 days, respectively) before planting can take place. Fer-tilizer application dates can have a large influence on the seasonality of the emissions (e.g., see Paulot et al., 2014) and the subsequent flows of Nr (Sect. 3.4). Future
applica-tions will assume more complete algorithms for fertilizing the spectrum of crops, as well as multiple fertilizer appli-cations and double cropping. A global accounting of fertil-ization practices and application techniques (e.g., fertilizer injection) nevertheless remains a considerable source of un-certainty in a global simulation of the NH3emissions from
agriculture.
2.2.3 Total ammoniacal nitrogen (TAN)
We consider two TAN pools (g N m−2), one for the nitrogen
produced from synthetic fertilizer NTAN(f )the other for
ni-trogen from manure NTAN(m). The budget for the manure
and synthetic fertilizer TAN pools respectively is given by NTAN(m)/dt=fu×αapplied(m)+Kr×Nresistant+Ka
×Navailable−Frun(m)−KDNH4
×NTAN(m)−FNH3(m)−FNO3(m), (5)
NTAN(f )/dt=kf×Nfertilizer−Frun(f )−KDNH4
×NTAN(f )−FNH3(f )−FNO3(f ). (6)
Here Frun(m/f ) (g N m−2s−1) is the loss of nitrogen by
runoff from the manure or synthetic fertilizer TAN pool; KNH4
D (s
−1)is the loss rate of nitrogen to the soil nitrogen
pools; FNH3(m) and FNH3(f ) (g N m−2s−1) are the NH 3
emissions from the manure and fertilizer TAN pools, re-spectively, to the atmosphere; and FNO3(m) and FNO3(f )
(g N m−2s−1) are the loss of nitrogen through nitrification
from the manure and synthetic fertilizer TAN pools. The for-mulation of each of these terms is given below. Inputs into NTAN(m)pool are from the fraction (fu)of applied manure
as urine(αapplied(m)), and from the decomposition of the
2.2.4 Runoff of nitrogen to rivers
The immediate runoff of fertilizer and manure nitrogen to rivers from the manure and fertilizer TAN pools is derived from the runoff rate of water (R) (m s−1)in the CLM
multi-plied by concentration of nitrogen in the TAN water pool:
Frun(m/f )=R×
NTAN(m/f )
Nwater(m/f )
. (7)
The value of R is calculated within the CLM and is a function of precipitation, evaporation, drainage and soil saturation. The amount of water within the TAN pool (Nwater(m/f ))(m)is needed to convert NTAN (g N m−2)to
a concentration (g N m−3). An expression for N
water(m/f )
is given in Sect. 2.2.9. It should be emphasized that this is the immediate runoff of manure and synthetic fertilizer ni-trogen from the TAN pools. Subsequent loss of nini-trogen de-rived from manure and synthetic fertilizer application occurs following the nitrogen transfer to the soil pools, but is not tracked in these simulations. Additional hydrological losses will also occur following the deposition of NH3volatilized
to the atmosphere. These losses are also not tracked in the current simulation.
Initially, we attempted to use the runoff parameteriza-tion based on the global Nutrient Export from Watersheds 2 (NEWS 2) model (Mayorga et al., 2010), where runoff is also parameterized in terms ofR. However, the amount of ni-trogen that runs off in NEWS 2 is represented in terms of the annual nitrogen initially applied to the land and thus is not directly related to the amount of nitrogen in the TAN pool. 2.2.5 Diffusion through soil
Nitrogen is assumed to diffuse from the TAN pool to the soil pools. Génermont and Cellier (1997) represent the dif-fusion coefficient of ammonium through soils as dependent on soil water content, soil porosity, temperature and an em-pirical diffusion coefficient of ammonium in free water (see Appendix A). For example, assuming a temperature of 21◦C,
a soil porosity of 0.5 and a soil water content of 0.2 the result-ing diffusion coefficient is approximately 0.03 cm2day−1, in reasonable agreement with measurements in Canter et al. (1996). Here we assume a typical length scale of 1.0 cm to convert the diffusion rate to a timescale. The resulting diffu-sion of ammoniacal nitrogen is added to preexisting nitrogen pools in CLM4.5 and is not further tracked.
2.2.6 Flux of ammonia to the atmosphere The flux of NH3(FNH3, g m
−2s−1)to the atmosphere is
cal-culated from the difference between the NH3 concentration
at the surface (NH3(g), g m−3)of the TAN pool and the
free-atmosphere NH3 concentration (χa, g m−3)divided by the
aerodynamic (Ra)and boundary layer (Rb)resistances
(Ne-mitz et al., 2000; Loubet et al., 2009, Sutton et al., 2013). FNH3=
NH3(g)−χa
Ra(z)+Rb
(8) The calculation of NH3(g) is given below. For compatibility
with the NH3 emission parameterization we compute
aver-age values ofRaandRbover each CLM soil column, which
may contain several PFTs. We specifyχa to be 0.3 µg m−3,
representative of concentrations over low-activity agricul-tural sites (Zbieranowski and Aherne, 2012). Continental NH3 concentrations between 0.1 and 10 µg m−3 have been
reported by Zbieranowski and Aherne (2012) and Heald et al. (2012). A concentration of 0.3 µg m−3is intermediate
be-tween concentrations at low to moderate pollution sites as diagnosed in GEOS-chem (Warner et al., 2016). The sensi-tivity to this parameter is small as NH3(g) is usually very
large (Sect. 3.4). While Eq. (8) allows for negative emissions (NH3(g) < χa)or deposition of atmospheric NH3 onto the
soil we disallow negative emissions in the current simula-tions. In future studies the atmospheric concentration of NH3
will be calculated interactively by coupling the FAN model to the atmospheric chemistry component of the CESM (CAM-chem), thus allowing the dynamics of the NH3exchange
be-tween the soil, the atmosphere and vegetation to be captured (e.g., Sutton et al., 2013).
A large fraction of the NH3 emitted to the atmosphere is
assumed captured by vegetation. The amount emitted to the atmosphere is given by
FNH3atm(m/f )=(1−fcapture)×FNH3(m/f ), (9)
wherefcaptureis set to 0.6. Plant recapture of emitted NH3is
often reported to be as high as 75 % (Harper et al., 2000; Nemitz et al., 2000; Walker et al., 2006; Denmead et al., 2008; Bash et al., 2010). Using seabird nitrogen on different substrates (rock, sand, soil and vegetation) inside a chamber, Riddick (2012) found NH3recapture to be 0 % on rock, 32 %
on sand, 59 % on soil and 73 % on vegetation. We setfcapture
to 0.6 as a mid-point between the value for soil (when the crops are planted) and when crops are fully grown (Wilson et al., 2004). Bouwman et al. (1997) also used canopy capture to estimate emissions with the captured fraction ranging from 0.8 in tropical rainforests to 0.5 in other forests to 0.2 for all other vegetation types, including grasslands and shrubs. Bouwman et al. (1997) omitted canopy capture over arable lands and intensively used grasslands. Overall, the deposition of NH3onto the canopy (or even the soil surface) is poorly
constrained (e.g., see Erisman and Draaijers, 1995) and often ignored in model simulations. In reality canopy capture is not constant but depends on surface characteristics and boundary layer meteorology. Variations in canopy capture will induce temporal and regional variations in NH3emissions.
desirable for calculating the net NH3emissions, but this is
outside the scope of the present study.
It is assumed that the nitrogen in the TAN pool is in equi-librium between NH3(g) (g m−3), NH3(aq) (g N m−3)and
NH+4(aq) (g N m−3). The equilibrium that governs the
spe-ciation of these species is determined by the Henry’s law co-efficient (KH), whereKH is a measure of the solubility of
NH3in water, and the disassociation constant of NH+4 in
wa-ter (KNH4)(mol L
−1)(e.g., Sutton et al., 1994):
NH3(g)+H2O
KH
←→NH3(aq), (10)
NH+4(aq)←→KNH4 NH3(aq)+H+. (11)
Combining these two expressions NH3(g)can be expressed
as a function of the total TAN (e.g., Pinder et al., 2004, al-though note their different units forKHandKNH4):
NH3(g)(m/f )=
NTAN(m/f )/Nwater(m/f )
1+KH+KHH+/KNH4
, (12)
where [H+] is the hydrogen ion concentration in mol L−1.
Both KH and KNH4 are temperature-dependent. As
tem-perature and pH increase the concentration of NH3(g)
in-creases. The pH of the solution depends on the type of soil, the exposure of the manure to air, and the type of fertil-izer used and may change with the aging of the manure or synthetic fertilizer. In Eghball et al. (2000) the majority of the reported measurements of pH for beef cattle feed-lot manure are between 7 and 8, although in one case a pH of 8.8 was measured. The recommended pH for vari-ous crops ranges from approximately 5.8 to 7.0 depending on the crop (e.g., http://onondaga.cce.cornell.edu/resources/ soil-ph-for-field-crops). For now we simply set the pH of the solution to 7 for both the synthetic fertilizer and manure TAN pools. Sensitivity to pH is explored in Sect. 3.4.
2.2.7 Conversion of TAN to NO− 3
The flux of Nr from the TAN pool to NO−3 by
nitrifi-cation (FNO−
3, g m
−2s−1) was adapted from Stange and
Neue (2009) for the gross nitrification rates in response to fertilization of a surface with manure or synthetic fertilizer. In particular, Stange and Neue (2009) fit measured gross ni-trification rates to an expression using a maximal nini-trification rate,rmax(µg N kg−1h−1), modified by a soil temperature
re-sponse function (f (T )) and a soil moisture rere-sponse function (f (M)) (Stange and Neue, 2009). However, sincermaxis fit
from their experimental data, the dependence of the nitrifi-cation rate on the ammonium concentration is not explicitly included in the formulation of Stange and Neue (2009). We have remedied this by setting the maximum nitrification rate (rmax)in the formulation of (Stange and Neue, 2009) to be
consistent with the formulation in Parton et al. (2001):
FNO3(m/f )=2.rmaxNwater(m/f )NH3(g)(m/f )KH
H+
/KNH4
1
6(Tg)+5(M)1
, (13)
where6(Tg) and5(M) are functions of soil temperature and moisture and the ammonium concentration is assumed to be in equilibrium with the other forms of ammoniacal ni-trogen and is thus expressed in terms of pH,KH andKNH4
and NH3(g) (m/f) andrmaxis equal to 1.16×10⁻⁶ s−1.
2.2.8 Nitrate
The rate of change of the nitrate pool is given by dNNO3(m/f )/dt=FNO3(m/f )−K
NO3
D NNO3(m/f ). (14)
The source of nitrate ions is nitrification from the TAN pool. Nitrate is lost to the soil nitrate pool through diffusion. Ni-trate leaching is not explicitly taken into account in the cur-rent model as the diffusion of nitrate into the soil pools occurs very rapidly. The loss of nitrate through runoff and leaching can, however, occur within the CLM, but is not tracked in the current simulations. Nitrate ions diffuse significantly faster than the NH+4 ions because they are not subject to immobi-lization by negatively charged soil particles (Mitsch and Gos-selink, 2007). Diffusion rates used in this study are derived from the same formulation as assumed for the diffusion of ammonium (e.g., see Jury et al., 1983) with a different base diffusion rate. The summary of measurements given in Can-ter et al. (1996), where both the diffusion of ammonium and nitrate were measured in the same soil types and wetness, suggest the base diffusion rate of NO−3 is approximately 13 times faster than that of ammonium.
2.2.9 TAN and manure water pools
The evolution of the TAN manure and synthetic fertilizer wa-ter pools depends on the wawa-ter added during manure or syn-thetic fertilizer application and the subsequent evolution of the water in the pools. The equations for the manure and syn-thetic fertilizer water are
dNwater(m)/dt=sw(m)×αapplied(m)−krelax
×(Nwater(m)−Mwater), (15)
dNwater(f )/dt=Sw(f )×αapplied(f )−krelax
×(Nwater(f )−Mwater). (16)
These equations include a source of water (sw(m)orSw(f ))
added as a fraction of the synthetic fertilizer or manure ap-plied and a relaxation term (krelax, s−1) to the soil water
(Mwater(m)) calculated in the CLM for the top 5 cm of soil.
Mwater explicitly takes into account the modification of the water pool due to rainfall, evaporation and the diffusion of water in the soil layers. We assume the TAN pool equili-brates with water within the top 5 cm of the soil with a rate of 3 days−1. The solution is insensitive to this parameter within
the ranges examined of 1 to 10 days−1(Sect. 3.4). The
74.2 g kg−1and a nitrogen content of 1.6 g kg−1, resulting in
5.7×10⁻⁴m water applied per gram of manure nitrogen
ap-plied (Sommer and Hutchings, 2001). In the case of synthetic fertilizer we assume urea is added as a liquid spread, where water added is calculated from the temperature-dependent solubility of urea in water (UNIDO and IFDC, 1998). 2.3 Model spin-up and forcing
Two different types of model simulations were conducted us-ing CLM4.5: a present-day control simulation (1990–2004) and a historical simulation (1850–2000). The resolution used in these simulations is 1.9◦latitude by 2.5◦longitude.
2.3.1 Present-day control simulation
This simulation uses the manure and synthetic fertilizer input as given in Potter et al. (2010). Forcing at the atmospheric boundary is set to the Qian et al. (2006) reanalysis for solar input, precipitation, temperature, wind and specific humid-ity. The simulation is run for 15 model years (1990–2004), with the last 10 years of the simulation used for analysis. The spin-up period allows for the more decomposition resistant N pools to approach a steady state with respect to the loss from mechanical incorporation into the soil.
2.3.2 Historical simulation
The historical simulation uses transient forcing conditions (accounting for changes in atmospheric CO2, nitrogen
depo-sition, aerosol deposition and land use change forcings) and the Qian et al. (2006) atmospheric forcing data set. Quality 6-hourly meteorological data sets for the period prior to 1948 do not exist. Therefore from 1850 to 1973 CLM4.5 is driven by recycled meteorological data, using meteorological data from the 1948–1973 time period. During this time long-term temperature changes were small: the statistically significant long-term changes in temperature (outside of natural vari-ability) occur after 1973. After 1973 the meteorological data are not recycled but are valid for the year applied.
The temporal distribution of manure and synthetic fertil-izer application from 1850–2000 is specified by applying the temporal distribution of Holland et al. (2005) to the base val-ues as calculated in Potter et al. (2010). Due to the lack of detailed information on the geography of historical manure and synthetic fertilizer we use the scaled spatial distribution from Potter et al. (2010). We assume manure production has changed from 26.3 Tg N yr−1 in 1860 to 125 Tg N yr−1 in
2000 (Holland et al., 2005; Potter et al., 2010), but we ac-knowledge that these temporal changes are uncertain. Syn-thetic fertilizer was first used in the 1920s, with use increas-ing to 62 Tg N yr−1in 2000.
3 Results
3.1 Model evaluation
To evaluate model output, measurements of the percentage of applied nitrogen that was emitted as NH3(Pv)from the
lit-erature were compared against corresponding model predic-tions. The model predictions are obtained from the present-day control simulation. The percent-volatilized NH3 was
used as a metric because it can be compared across time, irrespective of the absolute amount of nitrogen applied to the surface. To be able to compare emissions to published measurements, we require field studies with published data on nitrogen excretion rates, NH3emissions, ground
temper-ature, location, and date of measurement. Given all of these requirements we found that only a small selection of publi-cations had sufficient data.
For the manure emissions, 44 measurements in a range of climates (temperatures from 1.4 to 28◦C) and a range of
livestock management methods (commercial beef cattle feed yard, dairy cows grazing on ryegrass, beef cattle grazing on ryegrass and dairy cattle grazing on pasture land) were used (Supplement Table S1). EachPv reported by the
measure-ment campaign was compared against the Pv at the
corre-sponding grid cell in the model. For the synthetic fertilizer scenario, 10 measurements in a range of latitudes (43◦S to
50◦N) over a range of land use surfaces (pasture, sown crops,
turf and forest) were used (Table S2). Each total annualPv
re-ported by the measurement campaign was compared against the annualPvof the corresponding grid cell.
3.1.1 Nitrogen volatilized as NH3from manure
There is a general increase inPvwith temperature, in both
the model and measurements (Fig. 2). However, temperature is not the only factor in determining NH3emissions, where
wind speed, water availability and below ground soil proper-ties can also effect NH3emission. This is particularly
demon-strated by the measurements of Todd et al. (2007) at tempera-tures less than 5◦C where the measured emissions are higher
than those predicted at higher temperatures (e.g., Bussink, 1992). It is also worth noting that the model predicts the emissions of Todd et al. (2007) at lower temperatures with relative success.
Figure 2.Comparison of model to measurements for percentage of
nitrogen lost as NH3emissions from manure for a range of studies
(see Table S1). Symbol color indicates temperature at which the emissions occurred; shape gives the study.
emissions from manure spreading as opposed to the more managed conditions in feedlots.
3.1.2 Nitrogen volatilized as NH3from synthetic
fertilizer
The comparison between measured and modeled annual av-eragePvfrom synthetic fertilizer applied to a range of land
use types is weak, with an R2 of 0.2 that is significant at the 90 % confidence level (Fig. 3). The lowest emissions in the model and measurements tend to be associated with the higher latitudes of both hemispheres. There does not appear to be any noticeable bias with land use type where the model estimates are both higher and lower than measured values of Pvfor surfaces covered in turf, pasture land and crops. The fact that theR2 for the synthetic fertilizer measurements is lower than theR2of the manure measurements is potentially caused by differences between actual farming practices and model assumptions.
3.1.3 Nitrogen runoff
In this study we simulate the direct nitrogen runoff from the manure and synthetic fertilizer TAN pools, but do not track the resulting nitrogen flows. These flows are tracked, however, in Nevison et al. (2016), where the nitrogen runoff from manure and synthetic fertilizer pools is routed into the river transport model (RTM) (Dai and Trenberth, 2002; Branstetter and Erickson III, 2003) within the CESM. Nevi-son et al. (2016) assume denitrification occurs within the simulated rivers at a rate inversely proportional to the river depth (amounting to approximately 30 % of the nitrogen
in-Figure 3.Comparison of model to measurements for percentage
of nitrogen lost as NH3emissions from synthetic fertilizer (see
Ta-ble S2) for a range of studies. Symbol color gives the latitude at which the emissions occurred; symbol shape gives the study and type of synthetic fertilizer application.
puts on average) and compare the simulated dissolved inor-ganic nitrogen (DIN) export at the river mouths against mea-surements (Van Drecht et al., 2003) following Global NEWS (Mayorga et al., 2010). The simulated DIN export is nearly unbiased for six identified rivers with high human impact: the Columbia, Danube, Mississippi, Rhine, Saint Lawrence and Uruguay. Explicit comparisons against the Mississippi River show that the amplitude and seasonality of the sim-ulated Nr runoff is in reasonable agreement with the
mea-surements. While the comparison in Nevison et al. (2016) gives confidence that the runoff is reasonably simulated, the complications in simulating river runoff preclude tight model constraints.
3.2 Global nitrogen pathways: present day 3.2.1 Geography of nitrogen inputs
Global maps of nitrogen input from synthetic fertilizer and manure application during the present-day simulation are given in Potter et al. (2010) and are not repeated here. Heavy synthetic fertilizer use generally occurs in the upper Midwest of the US (mostly east of 100◦W and north of 40◦N),
west-ern Europe (mostly west of 20◦E and north of 40◦N), the
northern part of India and much of northeastern and north central China. High manure usage coincides with the areas of heavy synthetic fertilizer use but is more widespread extend-ing across much of eastern South America from 20–40◦S
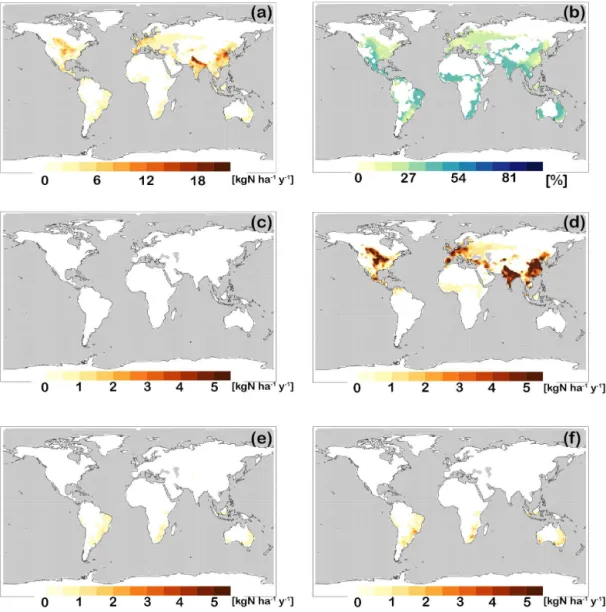
Figure 4.Simulated NH3emissions from synthetic fertilizer application from 1995 to 2004 for the present-day control simulation. Simulated
emissions (kg N ha−1yr−1)as(a)an annual average,(c)January–February–March average,(d)April–May–June average,(e)July–August–
September average, and(f)October–November–December average. Panel(b)shows simulated emissions as a percent of annual synthetic
fertilizer application.
3.2.2 Geography of nitrogen losses
There are strong geographical differences in the loss path-ways of nitrogen following manure or synthetic fertilizer application. The importance of the various loss pathways from the TAN pool (the amount nitrogen volatilized as NH3,
runoff, nitrified or diffused directly into the soil, Figs. 4–8) is dependent on temperature, precipitation and soil moisture. In hot, arid climates, the percentage volatilized is high (Figs. 4 and 5). For example, regions of high NH3 volatilization of
applied manure Nrapproach 50 % across the southwest US
and Mexico, eastern South America, central and southern Africa, parts of Australia, and across southern Asia from India to Turkey (Fig. 5). The absolute highest emissions of NH3from applied synthetic fertilizer and from applied
ma-nure approach 20 kg N ha−1yr−1over hot regions with high
applications, e.g., the Indian subcontinent and parts of China (Figs. 4 and 5). Ammonia emissions from manure are more broadly distributed globally than those of synthetic fertilizer with high NH3emissions not only over the synthetic
fertil-izer hotspots, characterized by heavy application of both syn-thetic fertilizer and manure but also over southeastern South America and central Africa. For the most part, the largest synthetic fertilizer NH3emissions occur during April–June,
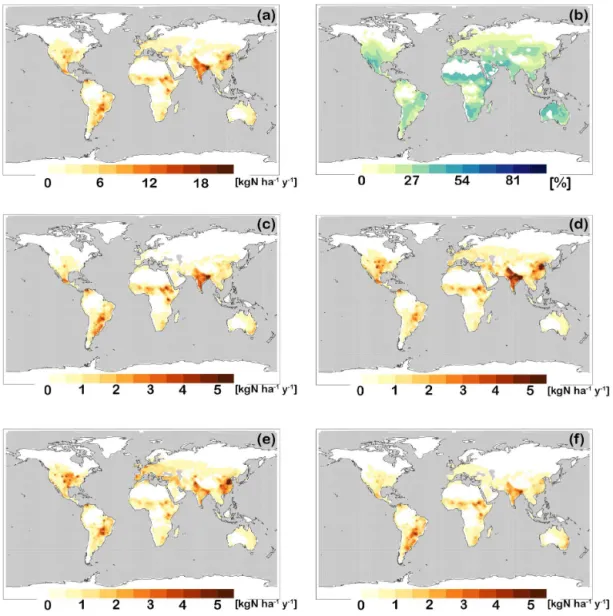
Figure 5.As in Fig. 4 but for manure application.
synthetic fertilizer: Paulot et al. (2014) consider three differ-ent synthetic fertilizer applications for each crop as well as a wide variety of crops. The seasonal emission distribution of NH3emissions from manure is broader than that of synthetic
fertilizer but with maximum emissions usually occurring in April–June or July–September. The simulated geographical and seasonal NH3 emission distribution from manure is in
broad agreement with Paulot et al. (2014).
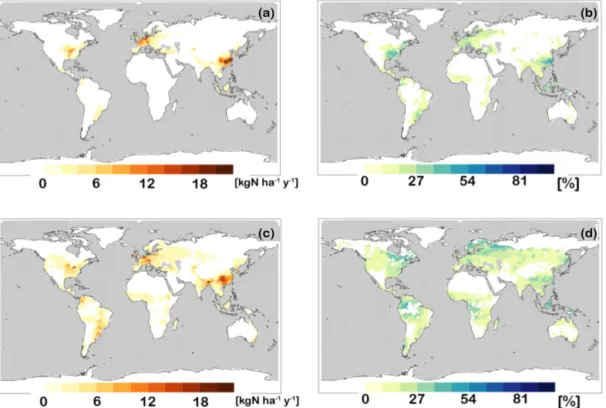
Runoff of Nrfrom applied synthetic fertilizer and manure
TAN pools, as well as nitrification and diffusion into the soil, depends on precipitation and soil moisture. High manure and synthetic fertilizer Nrrunoff from the TAN pools (see Fig. 6)
occurs particularly across parts of China, Europe (particu-larly the northern parts) and the east central US. The global hotspot for simulated Nrrunoff from the TAN pools is China,
where runoff approaches 20 kg N ha−1yr−1for nitrogen
ap-plied as either manure or synthetic fertilizer. In general the importance of runoff as a nitrogen loss pathway becomes
more important in the wetter and cooler regions. In contrast, over India and Spain the agricultural nitrogen input is high, but the runoff is relatively low. In these regions with high temperatures (and dry conditions) NH3volatilization is the
preferred pathway for nitrogen losses from the TAN pool. The percent of the TAN pool nitrified or diffused directly into the soil (see Figs. 7 and 8) also tends to be largest in wetter and cooler regions. The amount of nitrogen nitrified has an optimal temperature of 28◦C and tends to occur more
rapidly under moist conditions; the diffusion of nitrogen into the soil is also promoted under wet conditions.
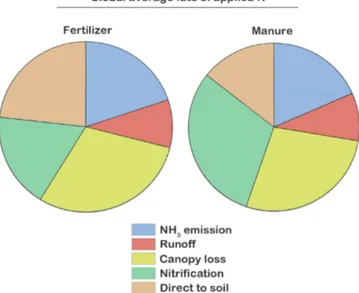
3.2.3 Regional and global accounting of nitrogen losses As nitrogen cascades through the environment it can be emit-ted as NH3 or runoff or leached at many different stages.
ni-Figure 6. Simulated runoff of Nr from synthetic fertilizer and manure TAN pools for the present-day (1995–2004) control simulation.
Simulated runoff (kg N ha−1yr−1)as an annual average for(a)synthetic fertilizer,(c)manure. Simulated as(b)percent of annual synthetic
fertilizer application,(d)percent of annual manure application.
trogen to the atmosphere as NH3is similar for manure and
synthetic fertilizer (17 % for manure, 19 % for synthetic fer-tilizer; see Fig. 9). Our global estimates of the percent of ma-nure and synthetic fertilizer volatilized as NH3are similar to
Bouwman et al. (2002) and Beusen et al. (2008), although our estimate for synthetic fertilizer volatilization as NH3is
somewhat high. Bouwman et al. (2002) estimate 19–29 % of applied manure and 10–19 % of applied synthetic fertilizer volatilizes as NH3; Beusen et al. (2008) conclude 15–23 % of
applied manure is lost as NH3(including losses from housing
and storage, grazing and spreading) and 10–18 % of applied synthetic fertilizer is lost.
We calculate the global direct runoff from manure or fer-tilizer TAN pools as 8 % for manure Nrand 9 % for synthetic
fertilizer (Fig. 9). Bouwman et al. (2013) find that 23 % of deposited Nr (comprised of synthetic fertilizer, manure and
atmospheric nitrogen deposition) runs off, higher than our es-timate. However, our estimate only includes the direct runoff from the TAN pool. Additional nitrogen is lost downstream from the TAN pool due to runoff and leaching from the soil nitrogen pools or following NH3emission and re-deposition.
Our simulations assume a large fraction of emitted nitro-gen is captured by the canopy, where canopy capture ac-counts for 25.5 % of manure losses and 30 % of synthetic fertilizer losses (Fig. 9). The nitrogen captured by the canopy may have a number of fates. First, Sparks (2009) posits that
foliar nitrogen uptake could more readily influence plant growth than uptake from soils since it is a direct addition of N to plant metabolism. As such it would decrease plant demand on soil uptake and thus conserve the soil nitrogen reservoirs. Secondly, nitrogen uptake by the plants, even if not directly used in plant metabolism, may redeposit onto the surface with litterfall. Finally, it may be emitted back to the atmosphere from plants. The latter process can be repre-sented through a compensation point model between the at-mosphere, the ground and stomata (e.g., Massad et al., 2010). A full accounting of this requires the simulation to be fully coupled with the atmosphere and soil chemistry and biogeo-chemistry, which is beyond the scope of the present study.
In the case of synthetic fertilizer the direct diffusion of TAN Nrinto the soil pool (22 %) is larger than nitrification
(17 %); for manure it is just the opposite: the nitrification (29 %) is larger than the direct diffusion (14 %) (Fig. 9). In practice, as simulated here, this makes little difference as the diffusion of nitrate into the soil pool occurs very rapidly, an order of magnitude faster than the diffusion of nitrogen from the TAN pool. Thus, NO−3 is directly incorporated into the soil nitrate pool without any subsequent loss. It should also be noted that a small percentage of manure is mechanically stirred into the soil organic nitrogen pools. Accounting for the Nrdiffused from the TAN pool into the soil pools, and
as the ammonium nitrified to NO−3 that also ends up in the soil pools, we find that globally 75 % of manure nitrogen and 71 % of synthetic fertilizer nitrogen ends up in the soil nitro-gen or soil organic nitronitro-gen pools. Emitted NH3may also end
up in the soil nitrogen pools downstream of the emissions. Of course, once in these soil pools, there may be subsequent losses of nitrogen due to runoff and leaching or emissions, but these are not calculated in this initial study.
The global percentages given above change appreciably when examined over subsets of countries (Fig. 10). For ex-ample, over all developed countries the percentage of emis-sions of manure and synthetic fertilizer TAN as NH3(13 %)
is substantially smaller than for developing countries (21 %). These differences can be largely explained by the fact that developing countries tend to be located in warmer climates than developed countries (e.g., see Bouwman et al., 2002). Bouwman (2002) calculated NH3emission factors for
ma-nure of 21 and 26 % for developed and industrialized coun-tries, respectively and for synthetic fertilizer of 7 and 18 %, respectively.
In our simulations 16 and 9 % of applied agricultural ni-trogen is emitted as NH3in the US and the European Union,
respectively. The direct runoff of nitrogen accounts for 9 and 14 % of the losses of agricultural nitrogen in the US and the European Union, respectively. Nitrogen runoff is fa-vored in the cooler moister climate of Europe. However, note the large contrast between India and China, where for India NH3 emissions are 27 % of the applied Nr with very little
runoff, whereas for China the runoff and emissions are ap-proximately equal (13 and 10 %, respectively).
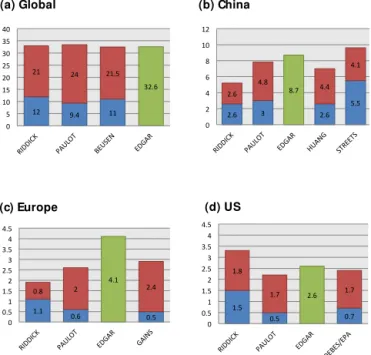
3.2.4 Comparison to other emissions inventories Figure 11 gives a comparison of manure and synthetic fer-tilizer NH3emissions from the FAN process model for the
year 2000 to various emission inventories. These invento-ries rely on emission factors depending on animal husbandry, types of synthetic fertilizer usage and other details of agricul-tural practices. Only the NH3emission inventory of Huang et
al. (2012) for China and that of Paulot et al. (2014) explic-itly account for temperature to modify their emission factors; the inventory of Paulot et al. (2014) also uses wind speed to modify the emission factors. The inventories of Paulot et al. (2014) for 2005–2008, Beusen et al. (2008) for 2000, and EDGAR v4.2 (European Commission JRC and PBL, 2011) for 2005–2008 are global inventories. The EDGAR inventory does not strictly separate the NH3emissions into those from
manure and synthetic fertilizer, so we simply show the over-all NH3emissions from both manure and synthetic fertilizer.
Over the US we also give an estimate for synthetic fertil-izer NH3from 1995 (Goebes et al., 2003) and for NH3
emis-sions from animal agricultural operations (US EPA, 2004). Over the China region, emission estimates are from Huang et al. (2012) for 2006 and Streets et al. (2003) for 2000. Over Europe, results using the Greenhouse Gas and Air
Pol-lution Interactions and Synergies (GAINS) model are given (Klimont and Brink, 2004) as reported in Paulot et al. (2014). Globally all inventories give approximately the same over-all NH3emissions of 30–35 Tg N yr−1. The global
apportion-ment of emissions between manure and synthetic fertilizer in this study is in approximately the ratio of 2 : 1, roughly consistent with that of Paulot et al. (2014) and Beusen et al. (2008). In this study the overall NH3emissions are high
over the US compared to the other inventories: the manure NH3emissions are close to the estimate of other inventories,
while the synthetic fertilizer emissions are higher. The Euro-pean and Chinese NH3emissions estimated in this study are
on the low side of the other inventories. Over Europe the cur-rent parameterization underestimates the manure emissions compared to the other studies while the synthetic fertilizer emissions are somewhat high. The EDGAR emission esti-mate is somewhat higher than the other estiesti-mates over Eu-rope, although this may depend on exactly what is assumed for the boundary of the European region. Over China our synthetic fertilizer emissions are similar to those of Huang et al. (2012), but we underestimate the manure NH3
emis-sions compared to the other inventories. Of the three regions examined all inventories suggest the Chinese emissions are highest.
3.2.5 Site-specific simulated pathways
The hourly time series of the fate of applied nitrogen from manure and synthetic fertilizer at a single site better illus-trates the relationship between the different nitrogen flow pathways and the local meteorology (Fig. 12). The large fluc-tuations in the NH3emissions and the resultant implications
for atmospheric chemistry also demonstrate the desirability of emissions that respond on hourly timescales to meteoro-logical conditions. The site shown in Fig. 12 is near the Texas panhandle. It experiences several large rain events and sur-face temperatures ranging from 0 to 18◦C over a period of
about 2 months during the spring season examined. The re-sponse of the NH3emissions to the diurnal temperature range
is clearly evident. Near the beginning of the examined period the nitrogen losses of manure TAN due to NH3
volatiliza-tion are initially small, comparable with the diffusive loss to the soil pools and somewhat less than the loss due to ni-trification. The loss by nitrification and the diffusion from the TAN manure pool remain roughly constant throughout the period examined, although both processes show some re-sponse to precipitation. Note in particular that the diffusive loss reaches a maximum near 21 May, presumably caused by the increased water content in the soil due to the prior rain event. With the rise in temperatures towards the end of the period, the NH3 emission loss of manure Nr becomes
the dominant loss pathway and the TAN manure pool de-creases. Closer inspection suggests, however, that the large increase in the NH3 emissions towards the end of the
Figure 7.As in Fig. 6 but for simulated nitrification.