Continuous dynamic monitoring of bridges:
Different perspectives of application
Álvaro Cunha
1,a, Elsa Caetano
1,b, Carlos Moutinho
1,cand Filipe Magalhães
1,d1
ViBest, Faculty of Engineering, University of Porto (FEUP), R.Dr. Roberto Frias, Porto, Portugal
a
acunha@fe.up, becaetano@fe.up.pt, cmoutinho@fe.up.pt, dfilipema@fe.up.pt
Keywords: Dynamic testing, modal identification, damage detection, vibration control, dynamic monitoring.
Abstract. This paper makes a brief characterisation of some aspects related with the extensive research activity of the Laboratory of Vibrations and Structural Monitoring (ViBest) of the Faculty of Engineering of the University of Porto (FEUP) in the field of Continuous Dynamic Monitoring of Bridges and Special Structures, selecting four examples where large high quality databases have been created since 2007, namely Infante D. Henrique bridge, Pedro e Inês footbride, FEUP Campus stress-ribbon footbridge and Trezói railway bridge.
Introduction
(a) (b)
(c) (d)
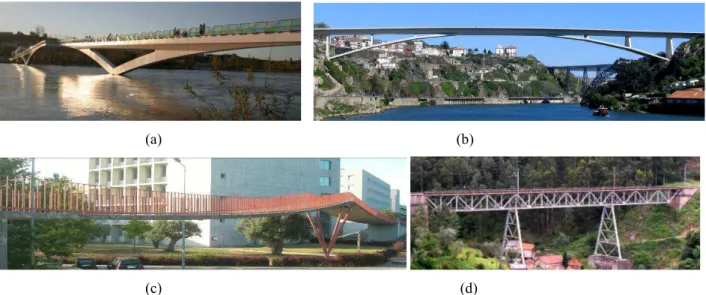
Figure 1: Images of (a) Pedro e Inês footbride, (b) Infante D. Henrique bridge, (c) FEUP Campus stress-ribbon footbridge and (d) Trezói railway bridge.
During the last years, the Laboratory of Vibrations and Structural Monitoring (ViBest, www.fe.up.pt/vibest) of the Faculty of Engineering of the University of Porto (FEUP) has developed a remarkable effort in the field of Continuous Dynamic Monitoring of Bridges and Special Structures, having presently ten long-term monitoring applications installed in several kinds of large structures, with different typologies and materials, and aiming four levels of objectives:
• The implementation of alert systems used for the safety checking of vibration serviceability limits and the verification of the efficiency of vibration control devices;
• The implementation of Structural Health Monitoring (SHM) systems enabling the vibration based damage detection;
• The investigation of Wind Engineering problems based on continuous measurements on the prototypes;
• The experimental assessment of local vibration fatigue in old metallic railway bridges.
All rights reserved. No part of contents of this paper may be reproduced or transmitted in any form or by any means without the written permission of TTP, www.ttp.net. (ID: 188.82.122.188-18/05/13,01:48:37)
This paper attempts to make a brief characterisation of this extensive research activity, selecting in particular four examples where large high quality databases have been created since 2007, namely Pedro e Inês footbridge, Infante D. Henrique bridge, FEUP Campus stress-ribbon footbridge and Trezói railway bridge (Figure 1).
Safety checking of vibration serviceability limits
This situation can be well illustrated by the continuous dynamic monitoring of Pedro e Inês footbridge, in Coimbra, Portugal (Figure 1a). This bridge is a slender structure 275m in length and 4m wide, except in the central square with dimensions of 8m×8m. The metallic arch spans 110m and rises 9m and has a rectangular box cross-section with 1.35m×1.80m. The deck has a L-shaped box cross-section, the top flange being formed by a composite steel-concrete slab 0.11m thick. In the central part of the bridge, each L shaped box cross-section and corresponding arch “meet” to form a rectangular box cross-section 8m×0.90m. In the lateral spans, arch and deck generate a rectangular box cross-section 4m×0.90m. The significant slenderness of the bridge and the geometric characteristics lead to a complex structural behaviour.
According to preliminary studies developed at design stage by the ViBest/FEUP, this bridge would be prone to excessive lateral and vertical human induced vibrations, and so the structure was built with the necessary precautions in order to enable the subsequent installation of several tuned mass dampers (TMDs).
The ambient vibration test performed close to the end of the bridge construction [1] permitted to identify a significant number of natural frequencies in the range 0-4.5 Hz, several of them easily excited by pedestrians, namely 0.91, 2.05 and 2.88 Hz, with dominant lateral component, and 1.54, 1.88, 1.95, 2.54, 3.36, 3.57, 3.83, 4.28 and 4.44 Hz, with dominant vertical component. These results were the basis for the subsequent construction of a new and more sophisticated shell finite element model, whose stiffening constants of the springs at the foundations of the arches were iteratively adjusted in order to achieve a very good matching between calculated and measured values. The excellent tuning of the finite element modelling was essential for the numerical evaluation of modal masses and subsequent final design of required TMDs.
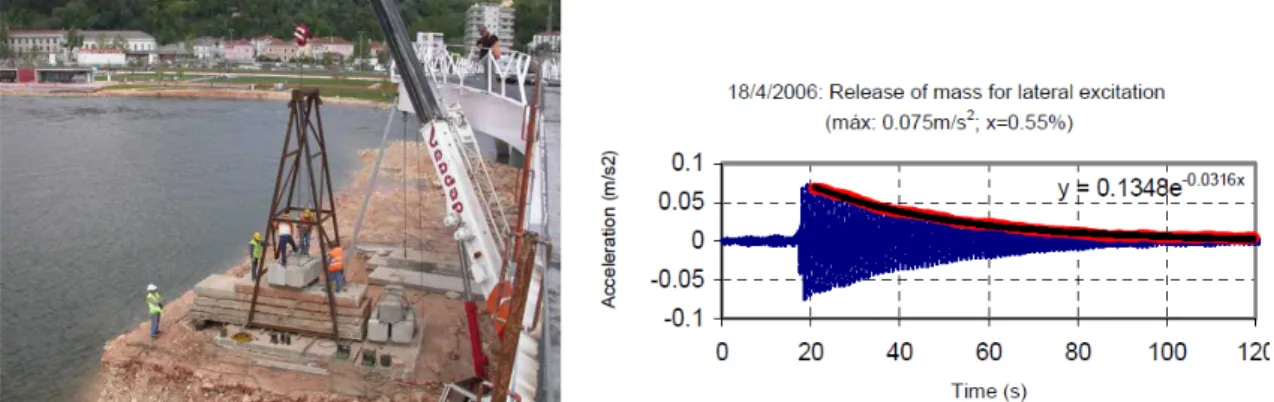
On the other hand, in order to indentify the modal damping ratios of the main vibration modes of the structure, free vibration tests consisting of the sudden release of masses suspended from different points of deck were conducted. The location of the sections used to suspend masses was chosen so as to stimulate the most relevant vibration modes of the system. The sudden release of the masses causes impulsive forces that induce free decays from which estimates of modal damping ratios can be obtained. Figure 2 shows the apparatus used to release a mass of 3t inducing a lateral impulsive load at mid-span, as well as an acceleration time series recorded in that direction which allowed to obtain an estimate of 0.55% for the critical fundamental lateral mode (lower than the value of 1% assumed at design stage) characterized by a frequency of 0.9Hz.
Figure 2: Lateral mass release at mid-span and correspondent acceleration time signal recorded in the lateral direction
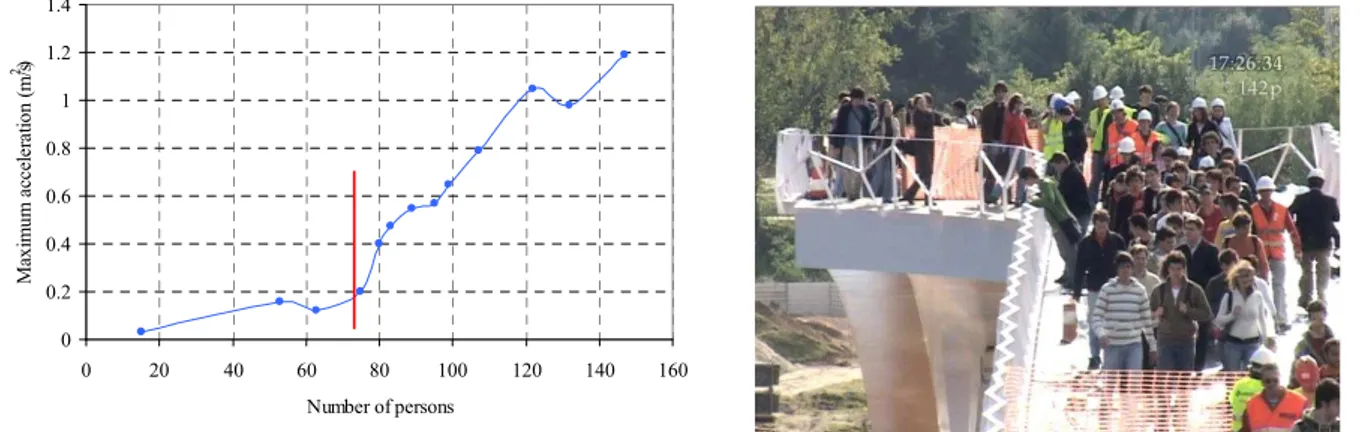
At last, with the purpose of analysing experimentally the lateral behaviour of the bridge, a test was conducted using the action of a continuous stream of pedestrians walking freely along the structure, with a gradually increased number of persons. As showed in Figure 3, the increase of acceleration with the number of pedestrians on the bridge is not linear, but instead exhibits a “jump” precisely for values of the number of pedestrians close to 70. This value is in perfect agreement with the formula developed in the context of the studies of the Millennium Bridge, in London, to estimate the critical number of pedestrians NL above which significant lateral oscillations may occur, which led to an estimate of NL=73 pedestrians. Extreme values of acceleration of ±1.2 m/s2 (about 12 times higher the limit value suggested in the recent SETRA [3] and HIVOSS [4] guidelines) were measured at the mid-span section, corresponding to a dynamic displacement of ±4 cm, occurring when 145 pedestrians were walking on the bridge.
The lively behaviour of this footbridge was particularly critical for lateral vibrations associated to the fundamental lateral mode, which motivated a special concern with the design of the corresponding TMD [2]. In this case, assuming the validity of the formula developed by Dallard et
al, it was possible to fix the number of pedestrians for which lock-in should not occur, which led to
an estimate of damping that the control solution should introduce. Following that procedure and the studies of Bachmann et al [5], the value of 6% was adopted as the value of damping ratio to achieve after installation of a TMD tuned for this lateral mode of vibration. This implied the specification of a mass of 15000 Kg that was accommodated inside the bridge deck by means of 6 TMD units, each with a mass of 2500 Kg (see Figure 4).
0 0.2 0.4 0.6 0.8 1 1.2 1.4 0 20 40 60 80 100 120 140 160 Number of persons M ax im u m a cc el er at io n ( m /s 2)
Figure 3: Variation of the amplitude of lateral accelerations at mid-span with the number of pedestrians
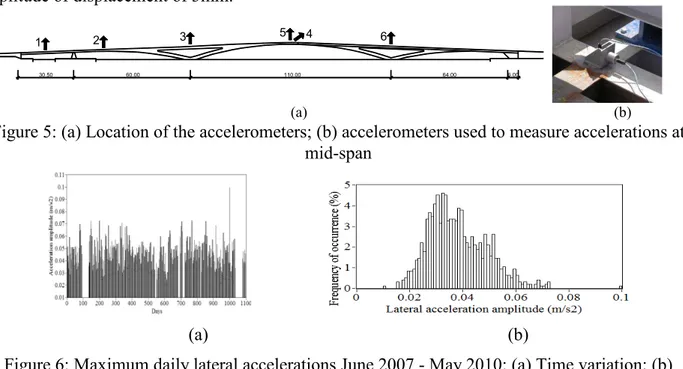
The efficiency of this lateral vibration control device was checked, in a first instance, performing a forced vibration test applying a servo-hydraulic shaker at mid-span and measuring the lateral response of the bridge and of each of the TMD units. This test revealed that the activation of all TMD units was achieved for accelerations below the comfort limit of about 0.1m/s2, which is essential to avoid lock-in phenomena. However, due to different friction characteristics in the corresponding rods, inducing different damping properties, it was noticed that the equivalent damping introduced by the TMD is lower than the required at the corresponding design. Therefore, and taking into account the complex character of the bridge and the scarce experience with mechanical control devices, the Owner of the footbridge required the permanent observation of its structural behaviour during a period of 5 years after construction. In this context, the dynamic behaviour is being permanently monitored with remote control from the ViBest / FEUP, by recording vertical and lateral accelerations in 5 points along the deck. Four sections are instrumented with accelerometers positioned in the vertical direction and the mid-span section is equipped with two accelerometers positioned in both vertical and lateral directions, as shown in Figure 5.
In addition to the accelerometers, the monitoring system also includes a signal conditioner, a UPS and a digital computer, stored inside one of the bridge abutments and transmitting measured records of vibration every 20 minutes through the Internet to a central computer at FEUP. The signals are then organized in a main database which can be accessed at any time by post-processing tools in LabView. In order to satisfy the main objective of this monitoring system, a web site was developed which allows the visualization of the time signals of the six accelerometers and subsequently the monitoring of the vibration levels of the structure.
Figure 6a) shows a plot with the maximum daily lateral accelerations measured during 3 years (from June 2007 to May 2010), whereas the corresponding histogram is shown in Figure 6b). It could be observed that the maximum lateral acceleration was 0.099m/s2, whereas the maximum vertical acceleration was 0.849m/s2. Considering the comfort limits recommended by SÉTRA [3] and HIVOSS [4] guidelines, it can be concluded that all maximum lateral accelerations and nearly all vertical counterparts fall in the range of maximum comfort levels, so no serviceability problem has occurred in this footbridge under normal operational conditions during 3 years. This is consequence of the implementation and tuning of the passive control devices. Furthermore, it is worth noting that maximum lateral acceleration of about 0.1m/s2 amplitude was just recorded before on the opening day, when a large number of pedestrians crossed the bridge, corresponding to an amplitude of displacement of 3mm.
1 2 3 5 4 6
30.50 60.00 110.00 64.00 6.00
(a) (b)
Figure 5: (a) Location of the accelerometers; (b) accelerometers used to measure accelerations at mid-span
(a) (b)
Figure 6: Maximum daily lateral accelerations June 2007 - May 2010: (a) Time variation; (b) Histogram.
Vibration based structural damage detection
The Infante D. Henrique Bridge (Figure 1b), over Douro river at Porto, is formed by two mutually interacting fundamental elements: a very rigid prestressed reinforced concrete box beam, 4.50 m in height, supported by a very flexible reinforced concrete arch, 1.50 m thick. The arch spans 280 m between abutments and rises 25 m until the crown, thus exhibiting a shallowness ratio greater than 11/1. In the 70 m central segment, arch and deck join and define a box-beam 6 m in height. The arch has constant thickness and a linearly varying width from 10 m in the central span up to 20 m at the abutments.
ViBest/FEUP implemented a permanent dynamic monitoring system in this bridge, which has been in continuous operation since September 2007. This system is formed by 12 force-balance accelerometers (in 4 sections of one half of the deck, 2 vertical upstream-downstream and 1 lateral in each section), two 6-channel digitisers and one computer installed inside the box-girder. The acceleration time series collected every 30 minutes at 50 Hz are immediately transferred to FEUP via Internet and processed using appropriate software (DynaMo) specifically developed for this purpose [6]. This software enables the automatic identification of modal parameters based on EFDD, SSI and p LSCF methods, and the application of statistical tools (multivariate linear regression or principal components analysis (PCA)) to remove the effects of environmental/ operational factors on the natural frequencies estimates [7].
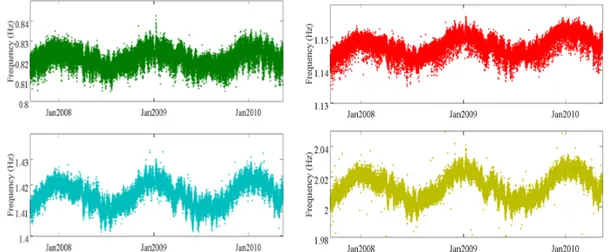
A first inspection of the time evolution of the 12 first natural frequencies identified in the frequency range 0.5-4.5 Hz on the basis of the p LSCF method in the period 13/09/2007 to 12/09/2008 may suggest that these frequency estimates are very stable. However, a zoom of individual frequency plots evidences the occurrence of seasonal effects, as shown in Figure 7 for the first four natural frequencies during a period of observation of three years.
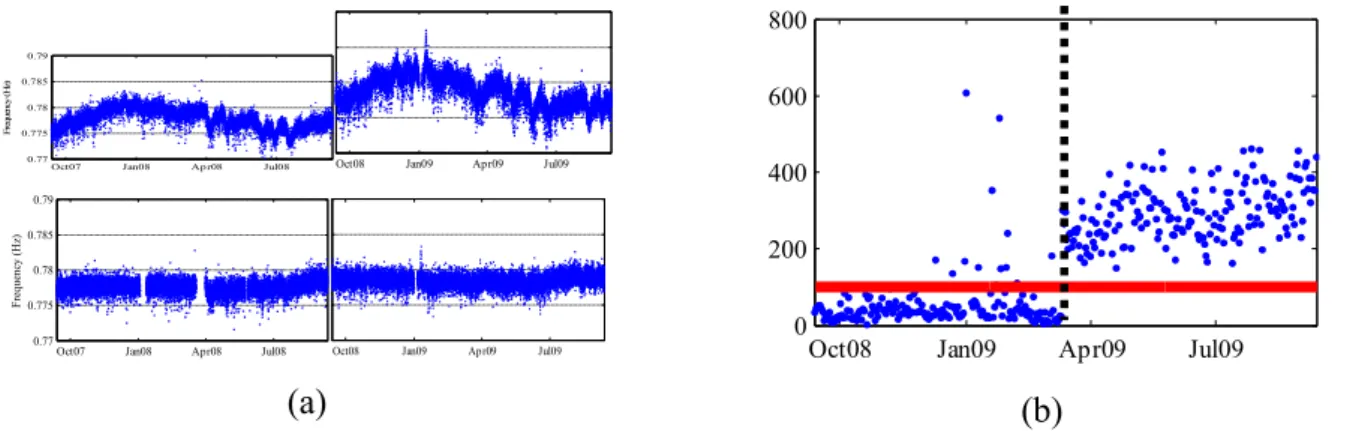
Frequency variations with time stem from environmental (e.g. temperature) and operational (e.g. traffic intensity) factors, and though they are relatively small, they can seriously disturb any attempt of damage detection based on natural frequency shifts. Therefore, it is important to mitigate the effect of these influences using appropriate statistical models and building suitable control charts using a novelty index that might flag the occurrence of slight structural damage [6, 8]. Figure 8(a) presents, for instance, the time evolution of the first natural frequency estimates before and after the removal of the environmental and operational effects. Inspection of this figure shows the efficiency of that correction, most of the estimates becoming then located inside a very narrow frequency range with an amplitude of about 0.005 Hz. This means that relatively small damage can be detected in the future, provided that the consequent frequency shifts are higher than that order of magnitude. This conclusion was confirmed analysing different slight damage scenarios idealized numerically and applying appropriate control charts, as indicated in Figure 8(b) [6].
Figure 7: Evolution of the estimates of the first four vertical bending natural frequencies along three years, using the
Oct07 Jan08 Ap r08 Jul08 0.77 0.775 0.78 0.785 0.79 F re q u en cy ( H z)
Oct08 Jan09 Apr09 Jul09
Oct07 Jan08 Apr08 Jul08 0.77 0.775 0.78 0.785 0.79 F re q u en cy ( H z)
Oct08 Jan09 Ap r09 Jul09
(a)
Oct08 Jan09 Apr09 Jul09
0 200 400 600 800 (b)
Figure 8: (a) Time evolution of the first natural frequency estimates before and after the removal of environmental / operational effects; (b) Control chart used for damage detection.
Further research on vibration based damage detection has also been developed on the FEUP stress-ribbon footbridge (Figure 1c). This bridge establishes a link between the main buildings of FEUP and the students’ canteen. The two spans 28m and 30m long and the 2m rise from the abutments to the intermediate pier are the starting points for the definition of the bridge structural geometry. A continuous concrete cast-in-situ slab embedding four pre-stressing cables takes a catenary shape over the two spans, with a circular transition over the intermediate support, which is made of four steel pipes forming an inverted pyramid hinged at the base. The constant cross-section is approximately rectangular with external design dimensions of 3.80m×0.15m.
The continuous dynamic monitoring system implemented in FEUP stress-ribbon footbridge includes four sensor units. They are mounted separately on the lower surface of the bridge deck at both 1/2 and 1/3 of each span. Each unit comprises a vertical accelerometer, a signal conditioner and a thermal sensor. Acceleration signal conditioners and thermal sensors are connected via cable with National Instruments Ethernet data acquisition (DAQ) devices, which are incorporated in a steel box installed beneath the deck at the intermediate support. The NI Ethernet DAQ device is driven by a signal acquisition toolkit, generating a nearly real-time zipped acceleration and temperature files every 10 or 30 minutes, respectively, continuously. Signal files acquired under operational conditions are conveniently accessed via Internet. The continuous dynamic monitoring system has been operating from the 1st of June 2009 up to now, except for occasional stops due to small technical problems.
The identified frequencies of 12 modes in the range of 0-20Hz estimated by the SSI-COV method are shown in Figure 9a) (this corresponds to all the first vibration modes, except the ones associated to frequencies of about 2.1 and 2.4 Hz, due to the perturbation resulting from the strong interaction with pedestrians). The variations of frequency estimates of higher order modes are quite clear. The tendency of increasing in winter time and decreasing in summer time reflects the seasonal environmental effects. Maximum relative variations of frequency estimates are in the range 15.3%-21.4%, which is significantly higher than in the two previous applications.
A detailed correlation analysis between natural frequency estimates, temperature and vibration levels can be found in [8], showing that temperature is again the main factor inducing frequency changes. However, in this case, the influence of traffic intensity is slightly higher than in Pedro e Inês footbridge, as stressed by Figure 9b). Moreover, the trend of decrease of frequency estimates with the increase of temperature tends to vanish above 30ºC. Still, the existence of approximately linear correlation between the variations of frequency estimates of the several modes of vibration allowed the application of Principal Component Analysis (PCA) to remove the influence of environmental factors on the frequency estimates, enabling the reliable detection of small simulated structural damages motivated by the slight release of the clamped connection of the deck at the abutments achieved by the addition of springs with controlled constants [8].
(a) (b)
Figure 9: (a) Identified frequencies from 1/6/09 to 31/5/10; (b) Frequency of first mode vs temperature (black, red and blue dots: low, medium and high vibration levels, respectively). Fatigue analysis in old metallic railway bridges
Historically, the economic development has been always associated with the construction of railway lines, or with subsequent increase of traffic, vehicle axle loads and speed. Therefore, old railway steel bridges, in many cases with more than 100 years, have been required over the years to carry heavier vehicles and endure higher velocities than allowed by the original designs. In addition, the natural degradation of these bridges contributes to an increased concern for their safety.
Due to economical, cultural and environmental reasons, replacing every bridge at the end of the original design life has not proved to be sustainable. Additionally, society increasingly requires an optimised use of resources balanced with a deep sense of cultural and patrimonial preservation. This means that many structures, and particularly railway bridges, have gained a cultural status that is mandatory to preserve.
However, fatigue phenomena has emerged as one of the major concerns associated with these type of structures because it is responsible for the propagation of cracks in main structural elements and subsequent accumulation of damage, leading to a reduction in the structure’s life. In this context, ViBest has developed an extensive research concerning the evaluation of dynamic effects and corresponding global and local fatigue analysis of a Portuguese metallic railway bridge located at Trezói (Figure 1d), which belongs to one of the major freight traffic routes that connect Portugal to Spain and Europe.
This structure is formed by three spans of 39 m, 48 m and 39 m, conducting to a total length of 126 m. The two inverted Warren truss girders that constitute the metallic deck of the bridge are 5.68 m in height. The girders panels are 6.50 m wide in the central span and 6.00 m in the end spans. Two trapezoidal shape trusses acting as columns and two granite masonry abutments transmit the loads carried by the structure to the foundation. The bridge has a constant width of 4.40m throughout its length.
In order to capture the global dynamics of the structure, a first numerical model using 3D beam and truss elements was developed [9]. Due to the relatively low computational effort required by this model, it was possible to make a first calculation of natural frequencies and modal shapes, and to run simulations of train crossing, introducing also the train-bridge interaction effect, and using the resulting nominal stresses to obtain a preliminary fatigue assessment. This numerical model was previously calibrated by using the information from ambient vibration tests initially developed to extract the experimental modal parameters of the structure [10].
Numerical simulations performed with this model were also compared with experimental measurements collected by an acquisition system composed by 18 electrical strain gauges applied to cross-sections of bars which experience the higher tensile stress ranges and 8 electrical strain gauges installed in rails sections in the vicinity of both abutments outside the bridge, totalling 24 sensors. Experimental data was essential not only to validate overall structural behaviour, but is also useful
Months Jun/09
in checking stress paths and patterns in critical elements and connections, to obtain experimental stress histograms suitable for fatigue analysis and to gather data concerning the crossing vehicles in terms of speed, moving direction, number of axles and distances.
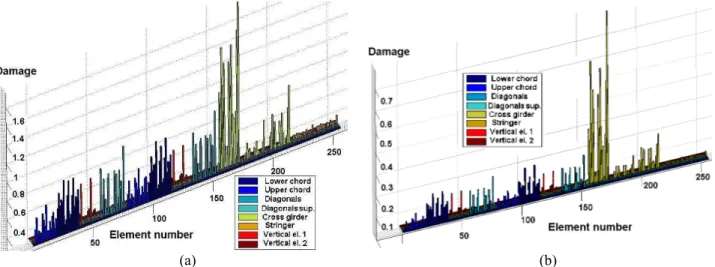
The global fatigue assessment of the Trezói Bridge was carried out by using either code specifications or real traffic data [9]. In a first stage, based on the knowledge of the details Whöler class and using Miner’s rule, it was possible to calculate the damage associated with the critical structural elements. A program developed with MATLAB allowed making the cycle counting in stress histories through the “Rainflow” method. In this case, the loading spectra for fatigue assessment defined in EN1991 [11] were used. A total of 256 structural elements were analysed in order to identify the most sensitive elements to fatigue loading. Figure 10a) summarises the damage indices obtained for all the elements considering the present age of the bridge and assuming the EN1991 Heavy Traffic scenario. It can be observed that there is a high number of elements with a damage index higher than 1.0, meaning that they would collapse under the conditions specified in this code. On the other hand, despite the upper and lower chords being the elements with the highest stresses, the highest damage values clearly occur at the cross girders. These elements have typically the highest damage values, since they suffer direct influence of each train axle, which leads to at least one stress cycle for each axle. For this reason, they are submitted to greater number of cycles than other principal structural elements.
The same calculations were made using real traffic data obtained from records of the Portuguese railway agencies CP and Refer for this specific bridge in the period of 2001 to 2006, assuming the traffic conditions in this period as conservative in terms of the bridge lifetime. The corresponding present damage indices are shown in Figure 10b) and clearly a difference in the magnitude of the damage is observed with regard to the one obtained based on the EN1991 Heavy traffic scenario. Damages are lower than the ones obtained from the calculations based on the Eurocodes, certainly due to the fact that the real traffic is significantly lower than the assumed in EN1991.
Inspection of the results of the global fatigue assessment clearly shows that there are some structural elements with much higher damage, which are the cross-girders at the extreme supports and above the structure columns. Beyond this global analysis, there is also concern about the local effects of vibrations in these elements, in the sense that it was verified that the first natural frequencies of these cross-girders fall in the range of the loading frequencies. Therefore, an additional study involving local effects of the vibrations was carried out [12].
(a) (b)
Figure 10: Fatigue damage indices for all structural elements: (a) using EN1991 Heavy Traffic scenario;
For this purpose, a FEM was developed using shell elements to simulate the cross girders above the columns and the cross-girders at the extremity supports. A special attention was given to the joints of the cross girders in order to capture local vibration modes, the effect of secondary bending moments and eventual distortion. This model was later compared with the results of a field test campaign for preliminary identification of frequencies of local modes. In this case, accelerations were measured in the vertical direction in three locations at the top flange of the extremity cross girder, and the horizontal acceleration was also measured at mid-span of this element perpendicularly to the element axis, in order to capture vibration modes with lateral movement.
In order to validate numerical simulations, a new set of electrical strain gauges were installed in the cross girders located at the top of the columns and at one support in the abutment in accordance with the critical locations previously identified. Four strain gauges were placed in the flanges of each instrumented cross-girder in order to capture the highest stress ranges at the detail with the lowest fatigue strength. They were placed near the connection between the cross girder and the gusset at the vicinity of the rivets in order to capture the stress enhancement due to the presence of rivets. In addition, rails sections in the vicinity of both abutments, but outside the bridge, were instrumented with strain gauges in order to estimate the axle loads of the real trains and the corresponding velocity. The data from these sensors is acquired by a dynamic monitoring system designed to record time signals during the passage of each train, including a pre/post-trigger of 1 minute. To estimate the dominant frequencies present in the structural response, ANPSD of the strains measurements at the extremity cross girder were calculated. The identification of the peaks in these spectra makes possible to estimate the dominant frequencies and associate them with the local mode shapes that are excited during the train crossings.
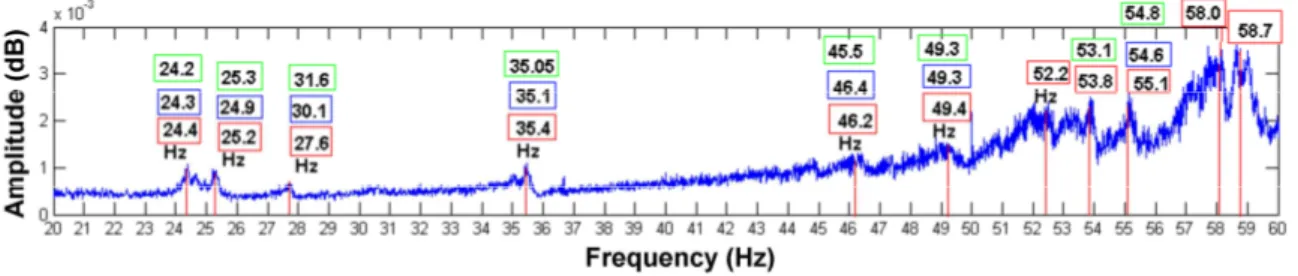
Figure 11 shows a comparison between calculated and identified frequencies using an ANPSD for the vertical direction obtained from the field test using accelerometers. The frequency values in red are associated to this field test, the ones in blue are obtained via numerical model, and the green ones were obtained with the ANPSD calculated from strains measured with the strain gauges. Generally a significant number of local modes with relevant dynamic contribution to the response can be observed, and a good agreement between numerical and experimental frequencies is found.
The study of the local fatigue phenomena begins by noting that the majority of global vibration modes have frequencies within 2Hz to 12Hz. In opposition to these global modes, a high number of local vibration modes of the deck are present in the range of frequencies between 12 Hz to 60 Hz, which can have an important participation in the dynamic response due to the train passage. Numerical simulations involving freight trains clearly shows that the stress histories at the critical cross girders have some influence of the local modes with frequencies within the range of 15 Hz to 40 Hz and have a most important contribution of the local modes within the frequency range of 45Hz to 55Hz.
Figure 11: Comparison between calculated and measured frequencies (ANPSD for the vertical direction): red - frequencies from the accelerometers, blue – frequencies from the FEM and green –
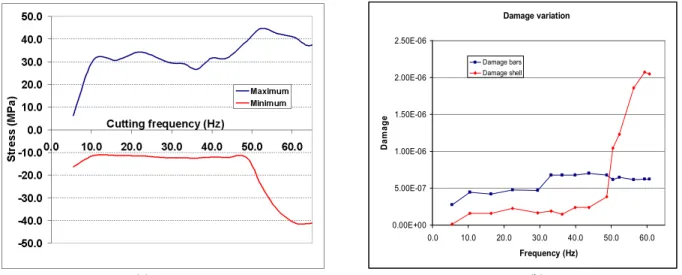
Damage variation 0.00E+00 5.00E-07 1.00E-06 1.50E-06 2.00E-06 2.50E-06 0.0 10.0 20.0 30.0 40.0 50.0 60.0 Frequency (Hz) D a m a g e Damage bars Damage shell (a) (b)
Figure 12: Influence of the local modes on the dynamic behaviour and on fatigue: (a) Peak stresses vs. Cutting frequency; (b) Damage vs. Cutting frequency
To better understand the influence of these vibration modes in the dynamic response of the bridge, an increasing number of modes were considered in the modal analysis. The lowest cutting frequency is 5 Hz, whereas the maximum value of the highest cutting frequency is 65 Hz, allowing the consideration of all the main global modes, as well as of the most relevant local modes of the cross-girders. Figure 12a) shows the effect of variation of the upper cutting frequency in the extreme values of stresses at the cross girder at the extreme support where a very high increase in the minimum and maximum values of the stresses is registered around 50 Hz. This is easy to understand because one of the local bending modes of this element has a frequency of 49.26 Hz. In Figure 12b) the influence of the local modes on fatigue is evidenced by showing the calculated damage of the cross girders using the simpler initial model with beam finite elements and comparing these results with the damage evaluated using the stress spectra obtained from the shell elements FEM for different cutting frequencies. It can be concluded that the fatigue damage has a small variation for almost all values of the upper cutting frequencies for the case of the bar model. However, for the case of the shell model, there is a very high increase of the fatigue damage at frequencies within the range of 49Hz to 55Hz, which are precisely frequencies corresponding to the main local modes of the cross girders. This means that the fatigue assessment based on a beam finite element model can clearly underestimate the fatigue damage in the cross-girder due to the importance of local vibration effects.
Final remarks
The four case studies from ViBest/FEUP briefly described in this paper clearly show the interest and potential of Continuous Dynamic Monitoring either as alert systems used for the safety checking of vibration serviceability limits and the verification of the efficiency of vibration control devices, or as SHM systems enabling the vibration based damage detection, or even for the investigation of fatigue problems based on continuous measurements on the prototypes.
Ackowledgements
The authors acknowledge all the financial support provided by the Portuguese Foundation for Science and Technology (FCT) for the development of research in the area of Long-Term Dynamic Monitoring, particularly within the Research Project “DYNAMO_DEMO - Advanced Tools for Dynamic Structural Health Monitoring of Bridges and Special Structures” (PTDC/ECM/109862/2009), as well as all the collaboration of the PhD student Fernando Marques in the context of the fatigue studies developed on the Trezói bridge.
References
[1] Caetano, E, Cunha, A, Magalhães, F, and Moutinho, C., Studies for controlling human-induced vibration of the Pedro e Inês footbridge, Portugal. Part 1: Assessment of dynamic behaviour, Engineering Structures, 32, pp. 1069-1081, 2010.
[2] Caetano, E, Cunha, A, Moutinho, C, and Magalhães, F., Studies for controlling human-induced vibration of the Pedro e Inês footbridge, Portugal. Part 2: Implementation of tuned mass dampers, Engineering Structures, 32, pp. 1082-1091, 2010.
[3] SETRA/AFGC, Footbridges – Assessment of dynamic behaviour under the action of pedestrians, Guidelines, Sétra, 2006.
[4] HIVOSS, Design of footbridges: Guideline. 2008.
[5] Bachmann H. et al., Vibration Problems in Structures: Practical Guidelines, Birkhäuser Verlag, Basel, 1995.
[6] Magalhães F., Operational Modal Analysis for Testing and Monitoring of Bridges and Special Structures, Ph.D. Thesis, University of Porto, Faculty of Engineering, 2010.
[7] Magalhães, F, Cunha, A, and Caetano E., Vibration based structural health monitoring of an arch bridge: from automated OMA to damage detection, Mechanical Systems and Signal Processing, Vol. 28, 2012, pp. 212-228, 2012.
[8] Hu, W.-H., Operational Modal Analysis and Continuous Dynamic Monitoring of Footbridges, Ph.D. Thesis, University of Porto, Faculty of Engineering, 2011.
[9] Marques, F., Hu, W., Moutinho, C., Magalhães, F., Cunha, A., Evaluation of dynamic effects and fatigue assessment of a railway bridge supported by temporary monitoring. Eurodyn 2011 conference, Leuven, 2011.
[10] Cunha, A., Caetano, E., Magalhães, F., Output-only Dynamic Testing of Bridges and Special Structures. Structural Concrete, Journal of FIB, 8, No.2, PP.67-85, 2007.
[11] CEN European Committee for Standarsization, Eurocode 1:Actions on structures - Part 2:Traffic loads on bridges; EN 1991-2, 2003.
[12] Marques, F., Moutinho, C., Cunha, A., Local fatigue analysis using a long-term monitoring system at Trezói railway bridge, Eighth International Conference on Engineering Computational Technology Dubrovnik, Croatia, 2012.