© FECAP
DOI: 10.7819/rbgn.v16i52.1601
Subject Area: Organizational Strategy And Behavior
RBGN
Determinants of Export Performance of Small and Medium-sized
Manufacturing Brazilian Enterprises from the Perspective of
Resource-based View and Uppsala Model
Determinantes do Desempenho Exportador de Pequenas e Médias Empresas
Manufatureiras Brasileiras sob a Perspectiva da Visão Baseada em Recursos e do
Modelo de Uppsala
Determinantes del desempeño exportador de las pequeñas y medianas empresas de
manufactura brasileñas desde la perspectiva de la visión basada en recursos y del
modelo de Uppsala
Edson Wilson Torrens1
Mohamed Amal2
Gérson Tontini3
Received on April 7, 2013 / Approved on November 18, 2014 Responsible editor: João Maurício Gama Boaventura, Dr. Evaluation process: Double Blind Review
1. Doctor in Accounting Sciences and Management from Regional University of Blumenau (FURB). [[email protected]] 2. Doctor in Production Engineering from Federal University of Santa Catarina (UFSC). [[email protected]] 3. Doctor in Management from California State University (CSU) – USA. [[email protected]]
Authors’ address: University of Joinville Region. Unit: Joinville Campus – Department of Management Rua Paulo Malschitzki, 10 – Campus Universit./Zona Indl., CEP: 89219-710 Joinville – SC – Brazil
ABSTRACT
Studies of the determinants of export performance include companies located in developed countries and emerging economies. A predominance of studies focusing on large companies in developed countries was observed. he studies tested the RBV and the Uppsala model in isolated ways. he combined use of variables in the models of RBV and Uppsala studies of Brazilian SMEs appear as a gap to be illed in organizational research. his research contributes to theoretical and empirical knowledge involving the phenomena related to the internationalization of Brazilian SMEs by
between export performance and resources. Size and technological intensity not mediated export performance. Resources and stage of internationalization afect the export performance of SMEs. he following question was developed: What are the determinants of export performance of Brazilian manufacturing SMEs? SMEs in emerging countries arouse the attention of governments worldwide since its economic, employment and income opportunities that provide and challenges facing to innovate, promote sustainability, establish and consolidate its internationalization.
Keywords: Export performance. Uppsala model.
Small and medium enterprises. Resource-based view.
RESUMO
Estudos envolvendo os determinantes do desempenho exportador abrangem empresas localizadas em países desenvolvidos e inseridas em economias emergentes. Verificou-se a predominância de estudos centrados em empresas de grande porte de países desenvolvidos. Os estudos testaram a RBV e o Modelo de Uppsala de forma isolada. O emprego combinado das variáveis dos modelos da RBV e de Uppsala nos estudos das PMEs brasileiras apresentam-se como uma lacuna a ser preenchida em pesquisas organizacionais. Esta pesquisa contribui com conhecimentos teóricos e empíricos que envolvem os fenômenos relacionados à internacionalização de PMEs brasileiras pela proposta de um modelo integrador destas abordagens. Objetiva-se, nesta pesquisa, identificar os determinantes do desempenho exportador de PMEs na perspectiva da RBV e do Modelo de Uppsala Sobre um leventamento com 84 PMEs, foram empregadas técnicas estatísticas múltiplas (análise fatorial, regressão linear e logística e, modelagem de equações estruturais). Recursos inluenciados pelas idiossincrasias da empresa e seu estágio de internacionalização inluenciaram o desempenho exportador. Recursos gerenciais foram preponderantes sobre os recursos organizacionais. Estágio de internacionalização e tempo exportando inluenciaram a relação entre
e intensidade tecnológica não mediaram o desempenho exportador. Recursos e estágio de internacionalização afetam o desempenho exportador das PMEs. Foi elaborada a seguinte pergunta: Quais os determinantes do desempenho exportador das PMEs manufatureiras brasileiras? As PMEs de países emergentes despertam a atenção dos governos mundiais visto sua importância econômica, oportunidades de emprego e renda que propiciam, bem como desaios que defrontam ao inovar, promover a sustentabilidade, estabelecer e consolidar sua internacionalização.
Palavras-chave: Desempenho exportador.
Modelo de Uppsala. Pequenas e médias empresas. Visão baseada em recursos.
RESUMEM
and Uppsala Model
recursos. El tamaño y la intensidad tecnológica no medió de las exportaciones. Recursos y etapa de internacionalización afectan el desempeño de las exportaciones de las PMEs. Se desarrolló la siguiente pregunta: ¿Cuáles son los factores determinantes del desempeño exportador de las PMEs industriales brasileñas? PMEs de los países emergentes despertan la atención de los gobiernos en todo el mundo por su importancia económicas, empleo y oportunidades de ingresos que proporcionan y desafíos de innovación, promover la sostenibilidad, establecer y consolidar su internacionalización.
Palabras-clave: Desempeño exportador. Pequeñas
y medianas empresas. Visión basada en recursos. Modelo de Uppsala.
1 INTRODUCTION
As emerging economies countries have been receiving more attention, small and medium enterprises (SMEs) in these countries have drawn the attention of its governments, due to its economic importance for jobs generation (BRASIL, 2012) and due to the challenges that these enterprises have to face (ALÉM, GIAMBIAGI, 2010; UNCTAD, 2010). In relation to challenges, these companies face the need to innovate, promote sustainability and achieve and consolidate its internationalization. Speciically in relation to internationalization, expanding the international market share beyond exports is challenging for small and medium-sized Brazilian companies (ALMEIDA, 2007).
Internationalization requires from SMEs a better knowledge of foreign markets, transferable competitive advantages, skills development for the dominance of political and economic characteristics of destination countries, involvement of sometimes scarce resources and constant technological development. According to Kaleka (2012), for companies that are
present in a global era, the export performance contributes to the general performance of the organization and to the continuity of its activities. his research aimed to identify Brazilian SMEs export performance determinants based on the Resource-based view (RBV) and on the Uppsala model. he question was raised: What are Small and Medium Enterprises export performance determinants from RBV and Uppsala Model perspectives? his research difers by gathering Uppsala model (JOHANSON; VAHLNE, 1977) and RBV (BARNEY, 1991) variables in a single study, in order to identify the impact of resources and of the internationalization stage on the export performance of Brazilian SMEs. he use of the two approaches is here justiied by the presence of variables related to organizational resources in the Uppsala model and to managerial resources in the RBV.
National studies involving export performance in which the unit of analysis were companies focused on large-sized companies (CARNEIRO; ROCHA; SILVA, 2011). Among national studies focused on large companies, there is the work of Forte and Moreira (2007). here is also an identiiable lack of studies (ARMARIO; RUIZ; ARMARIO, 2008; PANGARKAR, 2008; CAMISÓN; VILLAR-LOPEZ, 2010) bringing RBV (BARNEY, 1991) and Uppsala models (JOHANSON; VAHLNE, 1977, 2009) together in the study of SMEs export performance. his research has as its theoretical contribution meeting the two models variables and evaluating the combined inluence of these variables on export performance, since previous studies surveyed in this research presented analyzes of these variables in isolation. Multiple statistics techniques were employed due to the relations between data and the type of dependent variables to be evaluated.
for jobs and income generation and due to the challenges faced by both governments and companies incorporated into this (UNCTAD, 2010), which increases its relevance as an empirical contribution. After this introduction, literature review, research hypotheses, the methodology employed in the study, results discussion and the conclusion of the research are presented.
2 LITERATURE REVIEW
heoretical support to the central theme of this work was attempted through the literature review. he literature review was divided into two parts, with the irst part dealing with the export performance and the second involving the literature around the adopted theoretical model and the support to the hypotheses developed for the study.
2.1 Determinants of export performance
With the objective of identifying the determinants of export performance and the indicators used to measure performance in research on the topic, a survey was developed between 2006 and 2011 in 19 international journals with outstanding scientiic relevance, among which 11 had presented empirical works related to export performance, in which the unit of analysis was the company.
Among the identified determinants, networks were more frequent, followed by commitment to exports and company size. The manager’s experience, innovation, entrepreneurship orientation, market orientation, research and development also showed to be signiicant. he moderating efect was identiied in seven variables, which were trust, explicit contracts, global strategy, integration with target markets, imitable resources, non-replaceable resources and company size, all with
In Babakus, Yavas and Haahti (2006), Racela, Chaikittisilpa and houmrungroje (2007) and Singh (2009), based on the RBV, networks have proven to be determinants of export performance. Musteen, Francis and Datta (2010) showed that the geographical diversification of the networks the company has conducted relations guided to a superior performance of these companies. However, the manager’s personal networks have adversely afected the export performance. Networking involving business partners positively inluenced the export performance (MAUREL, 2009).
Camison and Villar-Lopez (2010), based on the RBV and in the Uppsala model, presented a study in which intangible assets determined the export performance. It was identiied by Morgan, Vorhies and Schlegelmilch (2006) that non-imitable resources exert a moderating inluence in the relation between speciic resources level and the company’s performance on its market, and non-replaceable resources moderate the relation between speciic resources and the company’s performance on its market. hey proved also to be determinants of the export performance of structural resources available for export (export department, managers in charge of exports and the existence of a speciic budget) and of scale resources (total employees number and the number of employees related to export functions) in a resource-based view approach (RUZO; LOSADA; NAVARRO; DÍEZ, 2011).
and Uppsala Model
internationalization degree of the companies studied, composed by samples formed by SMEs in both studies.
he company’s commitment to exports proved determinants of SMEs export performance in the studies of Armario, Ruiz and Armario (2008), Maurel (2009) and Navarro et al. (2010), with the irst study using both RBV and Uppsala model as theoretical bases, and the last two studies RBV alone. Manager experience was present as a determinant of export performance in the studies of Sousa and Bradley (2008, 2009) and Ruzo et al. (2011). Managers training or education has been veriied as a determinant in Roper, Love and Hígonn (2006).
2.2 heoretical model and hypothesis
In the episemolgical trajectory of the models evaluated in this study, it was observed the inluence of Simon in the origin of Uppsala model development line (SIMON, 1979) and the inluence of Marshall (1982) in the origin of RBV development line. he tangential point between the two models is the theory of the growth of the irm (PENROSE, 2006), which emphasizes resources as the main feature of a irm to advance into new foreign markets, in accordance with the Uppsala model, as well as being the foundation of the competitive advantage advocated by RBV. he heory of the Growth of the irm assumes that growth analysis applies to the expansion of foreign investments, in which growth processes, the role of learning, the theory of expansion based on internal resources (human and others), the management role, production diversiication and the role of mergers and acquisitions are all relevant (PENROSE, 2006).
Small and medium-sized enterprises, in the early stages of internationalization, have resource dependence unique characteristics (in relation to larger companies) that impact with more intensity on its export performance (STOIAN; RIALP; RIALP, 2011). Camison,
Villar-Lopez (2010), based on the RBV and in the Uppsala model, presented a study in which intangible assets determined the export performance. It was identiied in Morgan, Vorhies and Schlegelmilch (2006) that non-imitable resources exert moderating influence on the relation between specific resources level and the company’s performance on its market, and non-replaceable resources moderate the relation between speciic resources and the company’s performance on its market.
According to the RBV, strategic resources are distributed heterogeneously between companies and these differences are stable over time (BARNEY, 1991). The way they exploit their differences (forces) may put a company in advantage in the competition for the opportunities generated by the environment, neutralizing threats.
A major focus of the RBV is the scope of sustained competitive advantage, deined as the moment in which a company implements a value-creating strategy not simultaneously to the implementation by a current or potential competitor, and these competitors are not able to duplicate the beneits this strategy (BARNEY, 1991). The managerial implications of RBV bases is that companies should focus their analysis primarily on unique resources and skills, rather than on the competitive environment (DIERICKX; COOL, 1989).
subsidiaries; and 4) production or manufacturing. hese stages are relevant because they difer in the degree of involvement of the company with the market, and the market uses it as a reference. his stages sequence was called establishment chain. hese aspects represent the starting point for the development of what was later known as the Uppsala Model, presented by Johanson and Vahlne in 1977.
The internationalization stages differ among each other regarding the degree of involvement of the company with the market, and are often related to people in the negotiations. here are two aspects to consider about the degree of involvement (JOHANSON; WIEDERSHEIM-PAUL, 1975): a) he four stages represent the company resources commitment with a particular successively larger market; b) stages also lead to increased information and experiences of an unknown market for the company. hus, as the
company commits its resources to the market, it increases its knowledge and information about this market, changing its mode of action and thus changing its internationalization stage.
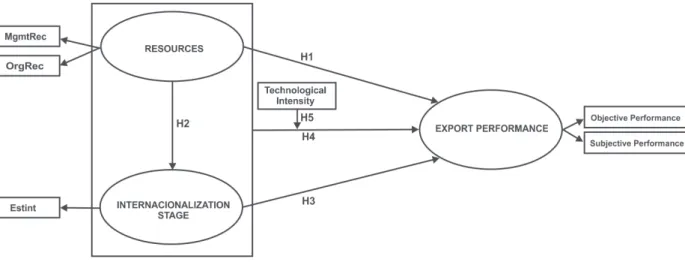
According to Johanson and Vahlne (2009), the 1977 internationalization process model was revised due to changes in business practices, as well as due to the theoretical advances since its release. Basically, the 1977 model change mechanism was retained, but building conidence and knowledge creation that is incremented in relations were added. For the authors, the business environment is currently seen as a relations network instead of customers and suppliers isolated. Johanson and Vahlne (2009) also state that, more relevant than the psychic distance, now networks are the main factor inluencing the organization’s relation with the outside. he dimensions measurement variables related to the constructs used in this study are shown in Figure 1.
FIGURE 1 – General research model and measurement variables Source: Created by the authors with research data
he study conceptual model illustrates the three dimensions of constructs employed in the study development, i.e., export performance, resources and internationalization stage. Based on the conceptual model and in the literature review,
and Uppsala Model
performance (JOHANSON; VAHLNE, 1977). The company will use its internal resources (experience, involvement, internal structure) or its relations network to expand its international operations, increasing its export performance (JOHANSONS; VAHLNE, 2009).
H1: he higher SMEs organizational and managerial resources level, the greater its export performance.
R e s o u r c e s p o s i t i v e l y a f f e c t internationalization stage (JOHANSON; WIEDERSHEIM-PAUL, 1975; JOHANSON and VAHLNE, 1977, 2009). As the organization increases the level of resources involved on international expansion, larger is its markets knowledge, so higher is its internationalization stage. Studies indicate to opposite results, where resources adversely afect internationalization stage (BONACCORSI, 1992; BROUTHERS; NAKOS, 2005; KATSIKEAS; PIERCY; IOANNIDIS, 1996).
H2: The higher organizational and managerial resources level, the higher SMEs internationalization stage.
Internationalization stages positively afect SMEs export performance (BROUTHERS; BROUTHERS; WERNER, 1999). As the organization increases its commitment to foreign markets, its export performance increases. On the other hand, studies showed that the internationalization stage adversely afects SMEs export performance (O’GRADY; LANE, 1996). As the organization increases its commitment to foreign markets, its export performance decreases.
H3: he higher SMEs internationalization
stage, the greater its export performance.
As the organization increases its commitment to foreign markets and modiies its
internationalization stage, its export performance increases (JOHANSON; WIEDERSHEIM-PAUL, 1975; JOHANSON; VAHLNE, 1977, 2009; BROUTHERS, BROUTHERS; WERNER, 1999).
H4: The higher organizational and managerial resources level and the higher the internationalization stage, the greater Brazilian SMEs export performance.
Export intensity determines export performance (ZOU; STAN, 1998; DHANARAJ; BEAMISH, 2003; MONTOBBIO; RAMPA, 2005). Aaby and Slater (1989) found that technological intensity may or may not inluence the export performance, depending on the managers and the target market. Reid (1986), in turn, found no signiicant relation between export performance and technological intensity.
H5: Technological intensity afects the relation between resources, stages and export performance.
Next, the methodology used in this research will be aproacched, as well as the steps involved in the study.
3 METHOD
For each research hypothesis an adequate specific statistical technique to the proposed analysis was applied. The SPSS application (Statistical Package for the Social Sciences) in its 17.0 version was used. Dependence and interdependence between variables statistic techniques were used. Among techniques classiied as interdependent (COOPER; SCHINDLER, 2003; FÁVERO et al, 2009; HAIR et al, 2009), factor analysis (FA) was used. Dependence techniques used were multiple linear regression,
logistic regression and structural equation modeling (COOPER; SCHINDLER, 2003; FÁVERO et al, 2009; HAIR et al, 2009).
Interdependence techniques are considered those in which there is no variables separation in dependents (they have a presumed effect in response to an independent variable) and independents (which cause or explain changes in the dependent variable), being them analyzed together. Chart 1 below presents a summary of the statistical techniques used in this study.
CHART 1 – Summary of technical statistics used in the research
Stage Technique
Stage-1: Data preliminary analysis Exploratory factor analysis
Stage-2: Objetive-a) Check the impact of organizational and managerial resources on SMEs export
performance; Multiple linear regression
Stage-3: Objetive-b) Investigate the impact of organizational and managerial resources on the
internationalization stage of Small and Medium Enterprises (SMEs) Logistic regression
Stage-4: Objetive-c) Examine internationalization stage impact on SMEs export performance; Multiple linear regression
Stage-5: Variables adherence analysis to dimensions; Conirmatory factor analysis
Stage-6: Objetive-d) Analyze resources and internationalization stage relation between Small and Medium Enterprises export performance.
Structural equation modeling
Source: Created by the authors with research data
he statistical techniques used were of dependence (COOPER; SCHINDLER, 2003; FÁVERO et al. 2009; HAIR et al., 2009), i.e., multiple linear regression, linear regression, logistic regression and structural equation modeling and of interdependence (COOPER; SCHINDLER, 2003; FÁVERO et al., 2009;
and Uppsala Model
CHART 2 – Codiication of variables used in research
Variables List Codiication
Organizational Resources (RO)
Exports initial time (foundation year - beginning exports year) RO_INIEXP
Organizational resources commitment (COMORG)
Exports speciic sector RO_COMORG_SET
Technical assistance abroad RO_COMORG_TEC
Product commitment (COMPRO)
New products release RO_COMPRO_LAN
Market commitment (COMMER)
Potential markets research RO_COMMER_PES
Visits to foreign markets RO_COMMER_VIS
Social networks intensities (RED)
Government Institutions RO_RED_GOV
Technologic Poles RO_RED_POL
Management resources (RG) Stimuli Perception (PEREST)
Increase in sales exports contribution RG_PEREST_VEN
Proitability exports contribution RG_PEREST_LUC
Barriers Perception (PERBAR)
Politics RG_PERBAR_POL
Legislation RG_PERBAR_LEG
Bureaucratic procedures RG_PERBAR_TRA
Brazilian products reputation RG_PERBAR_REP
Manager Knowledge (CON)
Years working in international business activities RG_CON_ATV Years working in international business management RG_CON_GES
Years working with international inances RG_CON_FIN
Years working with international law RG_CON_LEG
Years using Inform. Systems for international business RG_CON_SIS Internationalization stage (EI)
Stage ranging between 1 and 3 EST_1_3
Source: Created by the authors with research data
he variables used in the research were distributed among organizational resources (RO), managerial resources (GR) and internationalization stage (EI). he results of the analysis from the hypotheses in this study are presented as follows.
4 RESULTS DISCUSSION
he presentation of this study results is divided based on hypotheses raised on the literature related to the topic.
4.1 Resources and performance
the presence of a dependent variable (export performance) or at least one independent variable
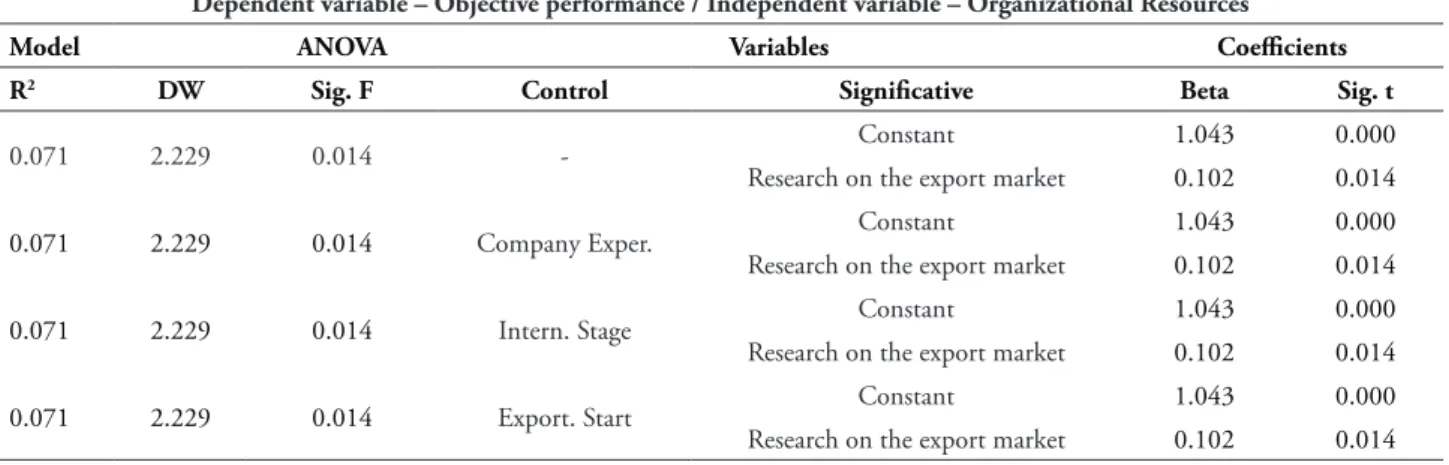
related to organizational resources or management resources (Table 1).
TABLE 1 – Summary of linear regression analysis for objective performance and organizational resources Dependent variable – Objective performance / Independent variable – Organizational Resources
Model ANOVA Variables Coeicients
R2 DW Sig. F Control Signiicative Beta Sig. t
0.071 2.229 0.014 - Constant 1.043 0.000
Research on the export market 0.102 0.014
0.071 2.229 0.014 Company Exper. Constant 1.043 0.000
Research on the export market 0.102 0.014
0.071 2.229 0.014 Intern. Stage Constant 1.043 0.000
Research on the export market 0.102 0.014
0.071 2.229 0.014 Export. Start Constant 1.043 0.000
Research on the export market 0.102 0.014
Source: Created by the authors with research data
he coeicients presented by the variables were signiicant for the four experiments (the irst without control variables and the last three with control variables), inclusive the presence of the constant among variables maintained in the model. Independent of moderators insertion, the variable related to the company’s commitment to exports through research in foreign markets (RO_ COMMER_PES) was present and positively related to export performance in the four tests.
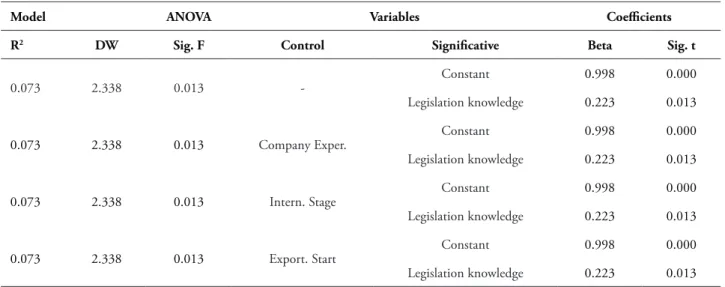
Management resources, in the same way as organizational resources, have been inserted in the four tests (results in Table 2), and both Durbin-Watson statistic (DW) and ANOVA signiicance demonstrated the validity of the model. It was noticed that, except for the fourth experiment, all of the above proved unchanged even with the inclusion of control variables for analysis of moderation, i.e., the management resource related to legislation knowledge (RG_CON_LEG) was present in all analyzes, together with the constant.
TABLE 2 – Summary of linear regression analysis for objective performance and management resources
Dependent variable – Objective performance / Independent variables – Management resources
Model ANOVA Variables Coeicients
R2 DW Sig. F Control Signiicative Beta Sig. t
0.073 2.338 0.013 - Constant 0.998 0.000
Legislation knowledge 0.223 0.013
0.073 2.338 0.013 Company Exper. Constant 0.998 0.000
Legislation knowledge 0.223 0.013
0.073 2.338 0.013 Intern. Stage Constant 0.998 0.000
Legislation knowledge 0.223 0.013
0.428 (2) 2.335 0.000 Export. Start
Constant 1.562 0.006
and Uppsala Model
The fourth test (on the step 2 of the Stepwise method), with the insertion of the variable related to the diference between exports start and the company foundation (RO_INIEXP) increased the weight RG_CON_LEG constant and variable coeicients to its double, besides including in the regression the variable related to the manager’s perception on the exports collaboration to the increase in sales as a stimulus to exports (RG_PEREST_VEN). It was also verified a significant increase in R2 , which
increased from 0.073 to 0.428. he inluence of managerial and organizational resources union in a single regression was also evaluated, with the
results shown in Table 3. he model validity can be observed through DW statistical model in the value of 2.338 and the analysis of signiicant variance of 0. 05% with a 0.013 value.
Just as the regression between objective performance and managerial resources, the constant and the manager legislation knowledge were present among signiicant variables, with identical coeicients and signiicance weights veriied, which demonstrates the predominance of managerial characteristics over organizational in relation to export performance. In this case, the insertion of the moderation test variables did not afect the model.
TABLE 3 – Summary analysis of linear regression for performance objective, organizational resources and management resources
Dependent variable – Objective performance / Independent variables – Resources (organiz.+ mgmt.)
Model ANOVA Variables Coeicients
R2 DW Sig. F Control Signiicative Beta Sig. t
0.073 2.338 0.013 - Constant 0.998 0.000
Legislation knowledge 0.223 0.013
0.073 2.338 0.013 Company Exper. Constant 0.998 0.000
Legislation knowledge 0.223 0.013
0.073 2.338 0.013 Intern. Stage Constant 0.998 0.000
Legislation knowledge 0.223 0.013
0.073 2.338 0.013 Export. Start Constant 0.998 0.000
Legislation knowledge 0.223 0.013
Source: Created by the authors with research data
As for the export objective performance, organizational and managerial resources inluence on the subjective export performance, as well as the model behavior through variables insertion
TABLE 4 – Summary of linear regression analysis for subjective performance and organizational resources
Dependent variable – Subjective performance / Independent variables – Organizational resources
Model ANOVA Variables Coeicients
R2 DW Sig. F Control Signiicative Beta Sig. t
0.196 (3) 1.999 0.001
-Constant 2.927 0.000
Networks – government 0.184 0.011
Networks – poles -0.254 0.004
Research on the export market 0.091 0.028
0.196 (3) 1.999 0.001 Company Exper.
Constant 2.927 0.000
Networks – government 0.184 0.011
Networks – poles -0.254 0.004
Research on the export market 0.091 0.028
0.223 (3) 2.078 0.000 Intern. Stage
Constant 2.562 0.000
internationalization stage 0.288 0.006
Networks – poles -0.276 0.002
Networks – government 0.180 0.011
0.196 (3) 1.999 0.001 Export. Start
Constant 2.927 0.000
Networks – government 0.184 0.011
Networks – poles -0.254 0.004
Research on the export market 0.091 0.028
Source: Created by the authors with research data
In addition to the constant, the variables associated with the relation with government networks, technology poles and research in foreign markets (RO_RED_GOV, RO_RED_POL and RO_COMMER_PES variables, respectively) prevailed in three analyzes. A negative association between the relation with technology poles and the subjective export performance (coeicient -0.254) was indicated. When the stage control variable was inserted, the model was altered (on step 3 of Stepwise method) with the exit of market research variable, the entrance of the stages variable and the weak change on variables coeicients weights, although with signiicant R2
modiication, which went from 0.196 to 0.223. Government networks and technology poles variables remained in the model.
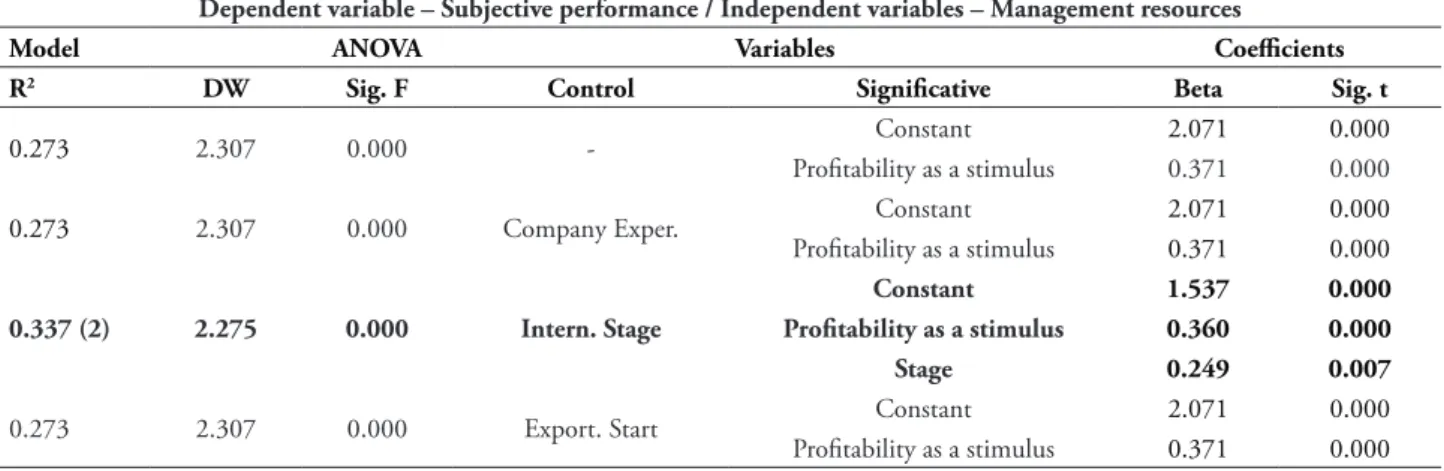
he results of four inluence analyzes of managerial resources on the subjective export performance are shown in Table 5. It was found that the model was signiicant (ANOVA Sig. F
with a 0.000 value, and 2.307 DW). he constant and the perception of proitability as stimulating exports were present in the four tests, and the internationalization stage insertion in the model reduced the constant coeicient value (from 2.071 to 1.537) on the step 2 of the Stepwise method, and was among the signiicative variables with a weight coeicient of 0.249 signiicative to 0.05% with Sig. t of 0.007, in addition to the R2, that
and Uppsala Model
TABLE 5 – Summary of linear regression analysis for subjective performance and management resources
Dependent variable – Subjective performance / Independent variables – Management resources
Model ANOVA Variables Coeicients
R2 DW Sig. F Control Signiicative Beta Sig. t
0.273 2.307 0.000 - Constant 2.071 0.000
Proitability as a stimulus 0.371 0.000
0.273 2.307 0.000 Company Exper. Constant 2.071 0.000
Proitability as a stimulus 0.371 0.000
0.337 (2) 2.275 0.000 Intern. Stage
Constant 1.537 0.000
Proitability as a stimulus 0.360 0.000
Stage 0.249 0.007
0.273 2.307 0.000 Export. Start Constant 2.071 0.000
Proitability as a stimulus 0.371 0.000
Source: Created by the authors with research data
The reunion of organizational and managerial resources variables as independent variables for the regression with the dependent variable of subjective export performance showed three variables predominance, besides constant (Table 6). Profitability stimulus perception
(RG_PEREST_LUC), research in foreign markets commitment (RO_COMMER_PES), technology poles relation (RO_RED_POL) and government networks relation (RO_RED_GOV) were present in the models.
TABLE 6 – Summary of linear regression analysis for subjective performance, organizational resources and management resources
Dependent variable – Subjective performance / Independent variables – Resources (organiz. + mgmt.)
Model ANOVA Variables Coeicients
R2 DW Sig. F Control Signiicative Beta Sig. t
0.420
(4) 2.043 0.000
-Constant 1.988 0.000
Proitability as a stimulus 0.340 0.000
Research on the export market 0.085 0.017
Networks – poles -0.237 0.002
Networks – government 0.139 0.026
0.420
(4) 2.043 0.000 Company Exper.
Constant 1.988 0.000
Proitability as a stimulus 0.340 0.000
Research on the export market 0.085 0.017
Networks – poles -0.237 0.002
Networks – government 0.139 0.026
0.452
(4) 2.032 0.000 Intern. Stage
Constant 1.714 0.000
Proitability as a stimulus 0.348 0.000 Internationalization Stage 0.271 0.002
Networks – poles -0.248 0.001
Research on the export market 0.084 0.013
0.420
(4) 2.043 0.000 Export. Start
Constant 1.988 0.000
Proitability as a stimulus 0.340 0.000
Research on the export market 0.085 0.017
Networks – poles -0.237 0.002
Networks – government 0.139 0.026
The relation with technological poles showed negative coeicients in all regressions, and the relation with government networks left the list of variables in the regression when the stage control variable (EST_1_3) was inserted between the variables in the analysis, with it starting to igure in the model (coeicient with 0.271 weight and 0.002 Sig. t). All model variables had its coeicients reduced.
Regarding the regression analysis involving the general export performance and organizational
resources (Table 7), models showed to be signiicant (2.278 DW and ANOVA Sig. F of 0.000) with a predominance of constant, market research and government networks variables. he insertion of the stage variable led to the constant coeicient weight reduction (from 2.112 to 1.747), to an increase in the market research variable coeicient (from 0.237 to 0.246), and to the inclusion of the stage variable (0.529 Beta with 0.0018 Sig. t).
TABLE 7 – Summary of linear regression analysis for general performance (obj + sub.) And organizational resources
Dependent variable – Performance (obj. + sub.) / Independent variables – Organizational resources
Model ANOVA Variables Coeicients
R2 DW Sig. F Control Signiicative Beta Sig. t
0.174 (2) 2.278 0.000
-Constant 2.112 0.000
Research on the export market 0.237 0.008
Networks – government 0.346 0.024
0.174 (2) 2.278 0.000 Company Exper.
Constant 2.112 0.000
Research on the export market 0.237 0.008
Networks – government 0.346 0.024
0.179 (2) 2.369 0.000 Intern. Stage
Constant 1.747 0.002
Research on the export market 0.246 0.005
Internationalization stage 0.529 0.018
0.174 (2) 2.278 0.000 Export. Start
Constant 2.112 0.000
Research on the export market 0.237 0.008
Networks – government 0.346 0.024
Source: Created by the authors with research data
The regression involving the general performance as the dependent variable, and managerial resources as independent variables is presented in Table 8. he inclusion of variables in order to verify the model moderation was not efective, once in the four tests both the constant
as the variables that were signiicant for the model (legislation knowledge and sales perception as a stimulus) remained unchanged, as well as other model validity indicators. However, R2 values
and Uppsala Model
TABLE 8 – Summary of linear regression analysis for general performance (obj. +Sub.) And resources management
Dependent variable – Performance (obj. + sub.) / Independent variables – Management resources
Model ANOVA Variables Coeicients
R2 DW Sig. F Control Signiicative Beta Sig. t
0.184 (2) 2.335 0.000
-Constant 1.562 0.006
Legislation knowledge 0.565 0.003
Sales as a stimulus 0.393 0.015
0.184 (2) 2.335 0.000 Company Exper.
Constant 1.562 0.006
Legislation knowledge 0.565 0.003
Sales as a stimulus 0.393 0.015
0.184 (2) 2.335 0.000 Intern. Stage
Constant 1.562 0.006
Legislation knowledge 0.565 0.003
Sales as a stimulus 0.393 0.015
0.184 (2) 2.335 0.000 Export. Start
Constant 1.562 0.006
Legislation knowledge 0.565 0.003
Sales as a stimulus 0.393 0.015
Source: Created by the authors with research data
It was found in the regression between general performance and organizational and managerial resources combined (Table 9) that the model was signiicant (DW value of 2.348
and ANOVA Sig. F of 0.000) predominating, in addition to the constant, legislation knowledge and research in the export market.
TABLE 9 – Summary of linear regression analysis for general performance (obj + sub.) And organizational management resources
Dependent variable – Performance (obj. + sub.) / Independent variables – Resources (organiz.+mgmt.)
Model ANOVA Variables Coeicients
R2 DW Sig. F Control Signiicative Beta Sig. t
0.252 (3) 2.384 0.000
-Constant 1.155 0.041
Legislation knowledge 0.443 0.017
Research on the export market 0.226 0.008
Sales as a stimulus 0.384 0.013
0.252 (3) 2.384 0.000 Company Exper.
Constant 1.155 0.041
Legislation knowledge 0.443 0.017
Research on the export market 0.226 0.008
Sales as a stimulus 0.384 0.013
0.252 (3) 2.384 0.000 Intern. Stage
Constant 1.155 0.041
Legislation knowledge 0.443 0.017
Research on the export market 0.226 0.008
Sales as a stimulus 0.384 0.013
0.252 (3) 2.384 0.000 Export. Start
Constant 1.155 0.041
Legislation knowledge 0.443 0.017
Research on the export market 0.226 0.008
Sales as a stimulus 0.384 0.013
The variables entered for moderation verification (company experience, stage and export time) did not afect the model or in its general signiicance, as Beta and Sig. t coeicients of the variables in the model and the R2 indexes
showed low values.
In the analyzes it was found a relation between export objective performance and managerial resources, and between subjective performance with organizational resources and the internationalization stage. Katsikeas, Leonidou and Morgan (2000) conclude that managers perspective and their engagement with exports inluence the export performance and its indicators can relate positively or negatively. his negative relation was identiied by the value presented by the variable corresponding to the company’s relation with technology poles.
Variables related to international legislation and international business activities were signiicant. he domain of these variables by the managers makes them scarce and not easily transferable resources, according to the RBV (WERNERFELT, 1984; BARNEY, 1991). Both Uppsala (JOHANSON; WIEDERSHEIM-PAUL, 1975; JOHANSON; VAHLNE, 1977, 2009) and RBV (BARNEY, 1991), assume that human resources are elements that lead the company to diferentiated market positions. he presence of organizational resources committed to exports represented by research in the export market, visits to foreign markets and the release of speciic export products was shown, in accordance with Katsikeas, Piercy and Ioannidis (1996); Lado, Martínez - Ros and Valenzuela (2004);
Stoian, Rialp and Rialp (2011). he relation with public networks related to government institutions were also positively related to export performance, as also observed in Coviello and Munro (1997) and Johanson and Vahlne (2009).
4.2 Resources and stage
Hypothesis 2 was supported, once the regressions showed significant models involving, besides the dependent variable (internationalization stage), organizational (products release and visits to foreign markets) and management resources variables (Brazilian products reputation barriers and international activities knowledge).
he summary of the analysis gathering stage internationalization and organizational resources is shown in Table 10, in which it can be observed through Omnibus statistics that the coeicients inserted together in the model are signiicant at the 0.05 level, as presenting Sig.
and Uppsala Model
TABLE 10 – Summary of logistic regression analysis for internationalization stage and organizational resources
Dependent variable – Stage / Independent variables – Organizational resources
Omnibus Model Hos-Lem
Signif. var. Coef. (B) Sig
R2 Sig. -2LL Nagel R2 Sig.
24.114 (2) 0.000 60.505 0.393 0.230 0.891
Constant 4.779 0.000
Products release -3.127 0.004
Visits to foreign markets -2.008 0.002
Source: Created by the authors with research data
As the selection method used for analysis eliminates the variables with possible zero coeicients in the equation, the product release (RO_COMPRO_LAN) and visits to the market (RO_COMMER_VIS) variables influenced on high and low company internationalization situation to the signiicance level of 0.05.
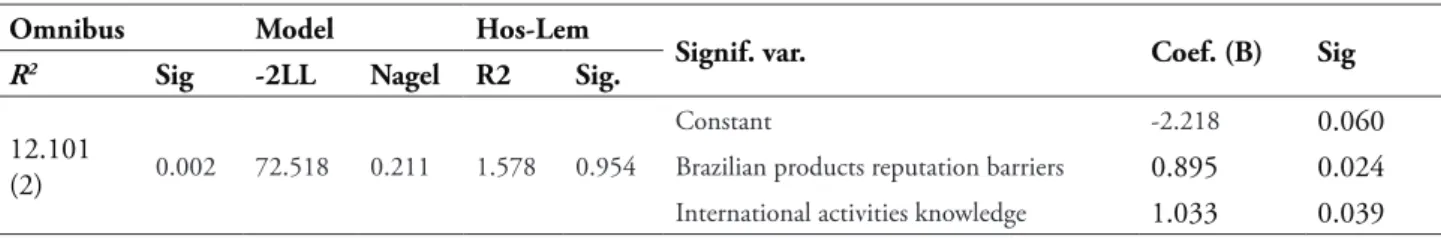
Table 11 presents a summary of the analysis between stage and management resources, which Omnibus statistics showed that the coeicients inserted together in the model are signiicant to the 0.05 level, as they presented 0.002 Sig. value.
he model measures from -2LL and Nagelkerke
tests showed 72.518 and 0.211 values, and the irst had a reasonably high value for signiicance and the second indicated that the variables in present in the equation (barriers represented by Brazilian products reputation abroad and the manager knowledge on international activities) explained 21.1% of high status or low company internationalization situation variations, what can be considered a low explanatory value. he Hosmer-Lemeshow statistic (Hos-Lem) indicated that the adjust between the observed and the expected data was adequate, showing a probability value of 95.4%.
TABLE 11 – Summary of logistic regression analysis for internationalization stage and management
resources
Dependent variable – Stage / Independent variables – Management resources
Omnibus Model Hos-Lem
Signif. var. Coef. (B) Sig
R2
Sig -2LL Nagel R2 Sig.
12.101
(2) 0.002 72.518 0.211 1.578 0.954
Constant -2.218 0.060
Brazilian products reputation barriers 0.895 0.024 International activities knowledge 1.033 0.039 Source: Created by the authors with research data
Once the variables with possible zero coeicients in equation were deleted (a result of the variable selection method used), the variables related to the barriers perceived by the manager (RG_PERBAR_REP) and international activities knowledge (RG_CON_ATV) inluenced on the state of the company’s internationalization stage
at a signiicance level of 0.05, and the second variable showed to be less signiicant, presenting a 0.039 value.
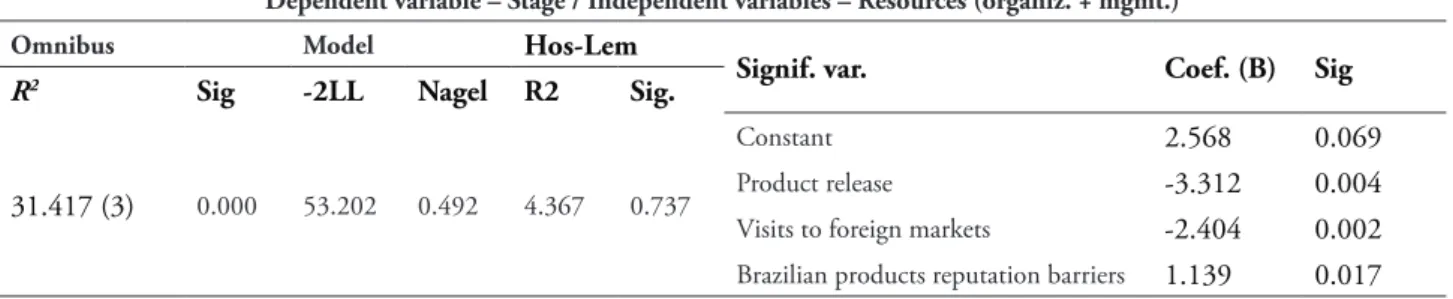
the coeicients included together in the model are signiicant to 0.05 level, as presenting 0.000
Sig. value. he model measures from -2LL and
Nagelkerke tests showed values of 53.202 and 0.492, with the irst measuring indicating a good value for signiicance and the second indicating that the variables present in the equation (products release for export, visits to the foreign
market and barriers perception) explained 49.2% of a company internationalization stage variations, what can be considered a low explanatory value. he Hosmer-Lemeshow statistic indicated that the adjust between the observed and the expected data was adequate, showing a probability value of 73.7%.
TABLE 12 – Summary of logistic regression analysis for internationalization stage and organizational and management resources
Dependent variable – Stage / Independent variables – Resources (organiz. + mgmt.)
Omnibus Model Hos-Lem
Signif. var. Coef. (B) Sig
R2
Sig -2LL Nagel R2 Sig.
31.417 (3) 0.000 53.202 0.492 4.367 0.737
Constant 2.568 0.069
Product release -3.312 0.004 Visits to foreign markets -2.404 0.002 Brazilian products reputation barriers 1.139 0.017 Source: Created by the authors with research data
he variables that remained in the model were products release (RO_COMPRO_LAN), visits to the market (RO_COMMER_VIS) and Brazilian products reputation barriers perception (RG_PERBAR_REP), which inluenced the high and low company internationalization status at a signiicance level of 0 05.
For Johanson and Wiedersheim-Paul (1975) and Johanson and Vahlne (1977; 2009), as the company progresses in the internationalization stages, it increases its resources commitment to the external markets. he managerial resources, in relation to the stages, were presented by variables related to barriers perception and knowledge about international activities. Regarding the barriers, White, Griith and Ryans (1998), took into account the presence of non-tarif barriers as inluential on export performance.
heodosiou and Leonidou (2003) and Stoian, Rialp and Rialp (2011) identified a negative relation between the perception of diferences in language, culture and legislation and export performance. In this research, this relation was found negative when competing with managerial resources variables. he manager
internationalization stage. Previous studies have shown that in companies where the manager has greater knowledge of international business activities, its performance in foreign markets was higher (CZINKOTA; URSIC, 1991). It was found in Stoian, Rialp and Rialp (2011) a positive relation between export performance and a higher domain of international business knowledge. In Wickramasekera and Oczkowski (2004) it was identiied that the management domain of international business knowledge is a determinant of a company’s internationalization stages.
4.3 Internationalization stage and export performance
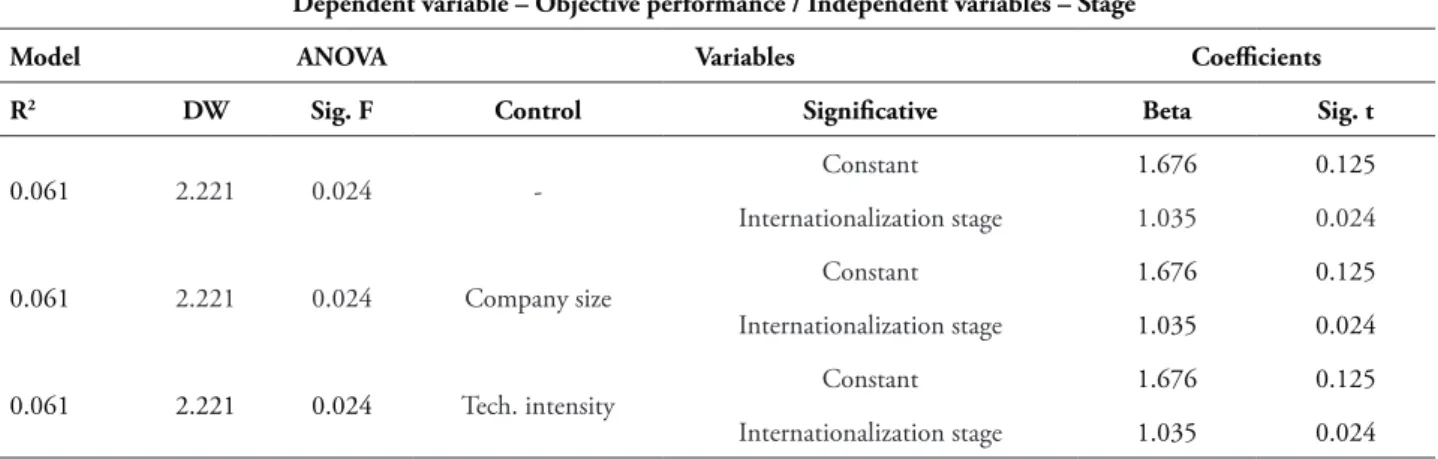
Positive and significant relation was found between the export performance and the internationalization stage, thus supporting thus Hypothesis 3. It was noticed, too, that the inclusion of control variables related to company size and its technological intensity did not have a moderator efect on the relation between the variables tested.
and Uppsala Model
TABLE 13 – Summary of linear regression analysis for objective performance and stage
Dependent variable – Objective performance / Independent variables – Stage
Model ANOVA Variables Coeicients
R2 DW Sig. F Control Signiicative Beta Sig. t
0.061 2.221 0.024 - Constant 1.676 0.125
Internationalization stage 1.035 0.024
0.061 2.221 0.024 Company size Constant 1.676 0.125
Internationalization stage 1.035 0.024
0.061 2.221 0.024 Tech. intensity Constant 1.676 0.125
Internationalization stage 1.035 0.024
Source: Created by the authors with research data
It was found that the insertion of the control variables did not affect the general performance of the regression model, in which a low constant signiicance value is observed (Sig. t equal to 0.125), and the independent variable with signiicance presented a Sig . t equal to 0.024. he analysis of variance (ANOVA) was signiicant for the model.
he regression involving the subjective performance (Table 14) presented the second
best result with signiicant values for both the constant and for the explanatory variable. he model involving the subjective performance showed good adequation, based on the Durbin-Watson statistic result (values close to 2). Despite the R2 model being low in the analysis of variance
(ANOVA), it was signiicant, so that the model cannot be neglected (FÁVERO et al., 2009; HAIR et al., 2009).
TABLE 14 – Summary of linear regression analysis for the subjective and stage performance
Dependent variable – Subjective performance / Independent variables – Stage
Model ANOVA Variables Coeicients
R2 DW Sig. F Control Signiicative Beta Sig. t
0.081 2.150 0.009 - Constant 2.564 0.000
Internationalization stage 0.281 0.009
0.081 2.150 0.009 Company Size Constant 2.564 0.000
Internationalization stage 0.281 0.009
0.081 2.150 0.009 Tech. intensity Constant 2.564 0.000
Internationalization stage 0.281 0.009
Source: Created by the authors with research data
he alternating insertion of the control variables did not change the model values (Table 15). Regression with best results occurred between
stage and general performance, with a signiicant
TABLE 15 – Summary of linear regression analysis for general performance (obj. Sub.) And stage
Dependent variable – Performance (obj. + sub.) / Independent variables – Stage
Model ANOVA Variables Coeicients
R2 DW Sig. F Control Signiicative Beta Sig. t
0.096 2.284 0.004 - Constant 2.120 0.000
Internationalization stage 0.658 0.004
0.096 2.284 0.004 Company size Constant 2.120 0.000
Internationalization stage 0.658 0.004
0.096 2.284 0.004 Tech. intensity Constant 2.120 0.000
Internationalization stage 0.658 0.004
Source: Created by the authors with research data
In the same way of models involving objective and subjective performance, the regression between general performance and stage did not receive inluence of the control variables, once tests values did not change.
The regression model were more significative when the dependent variable encompassed objective and subjective performance values. he size of the company as determinant of export performance has been controversial in several studies (MAJOCCHI; BACCHIOCCHI; MAYRHOFER, 2005). Just as in Lu and Beamish (2006), the technological intensity was not signiicant in this study when inserted as a control variable. Its presence resulted in no change in the indexes presented by the model or in the dependent variable, as well as in the independent variables.
4.4 Resources, internationalization stage and export performance
Figure 2 shows ways estimation of the initial general model, from which variables withdrawals were made. After the withdrawal of variables according to the analysis of the indexes presented by the model, it was chosen to segment the model in order to verify, in isolation, stage and organizational and managerial resources inluence on export performance.
he best model performance was shown
SEM application, there was a predominance of managerial resources over organizational resources as determinants of export performance. Table 16 shows the adjust indexes values for the model identiied as the most suitable.
TABLE 16 – Adjust indexes for the final measurement model
Indicator Expected Value Extracted Value
Qui2 - 108.690
Qui2/GL < 3 1.430
P > 0.05 0.008
RMR < 0.50 0.182
CFI > 0.90 0.932
TLI > 0.90 0.918
NFI > 0.90 0.809
RMSEA ~ 0.05/< 0.08 0.072
SRMR ~ 0.05 0.0971
Source: Created by the authors with research data
and Uppsala Model
FIGURE 2 – General model ways estimation
Source: Created by the authors with research data
FIGURE 3 – Final model ways estimation
Source: Research data
CHART 3 – Summary of resource and stage variables related to export performance
HYPOTHESIS 4
Test Dimension Variable Inluence
DS <-- REC + EST
RG_CON
RG_CON_ATV +
RG_CON_GES +
RG_CON_FIN +
RG_CON_LEG +
RG_CON_SIS +
RG_PERBAR
RG_PERBAR_POL +
RG_PERBAR_LEG +
RG_PERBAR_TRA +
ES_INT
EST_1_3 +
RO_COMORG_SET +
RO_COMORG_TEC +
Source: Research data
It was found in the analysis of performance relations with resources and internationalization s t a g e t h e s i g n i f i c a n t p re s e n c e o f t h e internationalization stage (in the subdivision of the general model). Performance and stage showed the relation with greater weight in its estimate, showing that the internationalization stage together with the resources are determinants of export performance, so that Hypothesis 4 was supported.
4 . 5 Technological intensity and export performance
After analysis that sought to verify resources and stage efect on export performance, thirteen variables that showed signiicant in the regression models were identiied (Table 4).
In order to test the efect of enterprises technology intensity on export performance (Hypothesis 5), regressions were performed between export performance (objective, subjective and general) as a dependent variable and the thirteen identified variables as independent variables. Table 17 shows the summary of the values generated in the analysis involving export
resources and the internationalization stage, with technological intensity moderation.
CHART 4 – List of variables present in the
regression models
Variables resulting from regressions
Organizational Resources
Experience
Exports Start
Research on the export market Products release
Visits to foreign markets
Networks – Government Networks – poles
Management Resources
Sales as a stimulus
Proitability as a stimulus
Brazilian products reputation barriers Legislation Knowledge
International Activies Knowledge
Stage
and Uppsala Model
TABLE 17 – Summary of regression between performance, resources and internationalization stages with technological intensity moderation
HYPOTHESIS 5
Independent Var. Organizational Resources (RO) + Management Resources (RG) + Stage
Dependent Var. Objective Performance (DO) Subjective Performance (DS) RO + RG
Model variable RO_COMMER_PES (+)RG_CON_LEG (+)
RO_COMMER_PES (+) RO_RED_POL (-) RG_PEREST_LUC (+)
EST_1_3 (v/c +)
RG_CON_LEG (+) RO_COMMER_PES (+)
RG_PEREST_VEN (+)
R2 0.152 0.452 0.252
Durbin Watson 2.401 2.032 2.384
Sig. F 0.001 0.000 0.000
Source: Research data
It was found that there was no inluence of technological intensity on the regression, and Hypothesis 5 was not supported, as identiied in Reid (1986), which found no signiicant relation between export performance and technological intensity. The control variable did not reach
signiicance, so it was not included in the inal model. he summary of this analysis is presented in Chart 5. he control variable did not reach signiicance, thus not being included in the inal model.
CHART 5 – Summary of the test with technological intensity control variable on the relation of resources
and stage related with export performance
HYPOTHESIS 5
Test Dimension Variable Inluence
DO <-- RO + RG +EST REC_ORG RO_COMMER_PES + (IT-S/I)
REC_GER RG_CON_LEG + (IT-S/I)
DS <-- RO + RG +EST
REC_ORG RO_RED_POL - (IT-S/I)
RO_COMMER_PES + (IT-S/I)
REC_GER RG_PEREST_LUC + (IT-S/I)
ESTÁGIO EST_1_3 + (IT-S/I)
DO + DS <-- RO + RG +EST
REC_ORG RO_COMMER_PES + (IT-S/I)
REC_GER RG_CON_LEG + (IT-S/I)
RG_PEREST_VEN + (IT-S/I)
Source: Research data
RO_COMMER_PES organizational resources (commitment with research in foreign markets) established relation with the objective, subjective and general performance. he RO_ RED_POL variable (social networks with technology poles) established relations only with the subjective performance. he management resource related to the manager international law knowledge (RG_CON_LEG) showed a signiicant relation with objective and general
5 CONCLUSION
This research aimed to identify the determinants of export performance of small and medium Brazilian manufacturing companies through the use of multiple statistic techniques. Linear regression, logistic regression and structural equation modeling were employed. he inluence of organizational and managerial resources on export performance was identiied. In organizational resources, the company’s commitment to invest in market research and engage more closely with public networks (government entities) were emphasized. In managerial resources, the control of skills related to the legislation of exports destination countries, as well as the manager perception regarding exports inluence in the increase of the company’s sales were highlighted. Managerial characteristics showed to be inluenced by exports start in relation to the company’s foundation, since companies with less diference between its foundation and the beginning of its exports were more inluential on its export performance.
The internationalization stage showed influence on the networks, showing that as the stage has an impact on performance, the inluence of networks decreases, demonstrating that the company achieves greater autonomy while progresses in the internationalization stages. he organizational resources (products release for export and visits to foreign markets) and managerial resources (perceived barriers imposed by the reputation of Brazilian products and knowledge of international activities) variables were signiicant when included in the model. here was internationalization stage inluence on the subjective performance, and the model involving objective performance did not achieve acceptable signiicance, especially in relation to the dependent variable, and weak signiicance of the independent variable. Technological intensity was not inluential on the export performance of
Variables related to the manager knowledge, perception of barriers to export and internationalization stages proved signiicant in the inal model. It was noticed the preponderance of managerial resources over organizational resources, demonstrating that the commitments present in the company showed to be determinants of a higher export performance. The internationalization stage was positively related to export performance, indicating that as the company advances in its internationalization stage, more management skills are required, relecting positively on the export performance.
This research sought to contribute to theoretical and empirical knowledge that allow to expand the domain over the phenomena involving the internationalization of small and medium-sized Brazilian companies. Regarding theoretical contributions, surveys were conducted on empirical studies and variables most commonly used in studies involving export performance were gathered in this study, thus collaborating with the conceptualization and measurement of the performance variable, once there is a high diversity of independent and dependent variables employed in studies involving export performance. Another theoretical contribution was the establishment of the relation between the constructs of RBV (BARNEY, 1991) and Uppsala model (JOHANSON; VAHLNE, 1977, 2009).
and Uppsala Model
Theoretical and operational character limitations affect this search. Regarding the theoretical character, the variables used in the constructs not completely cover all the variables related to the RBV model, as well as the explanatory power of the Uppsala model, criticized about its conceptual rigidity in relation to internationalization stages. The export performance has a diversity of concepts related to its measurement variables. he export performance studies have reviewed a variety of evaluation modes, without introducing a dedicated model that allows uniform results. Regarding operational aspects, the lack of data in adequate quantity and quality cannot extract all the precision of the statistical techniques applied to the analysis performed on the data.
There is also the insertion of external variables to the used model, since the idiosyncratic character of the model developed here cannot infer over the environment inluence. Still, this research opens the way for the development of qualitative studies that seek triangulation between the quantitative results, companies characteristics and the environment in which they operate. Another limitation lies in the rejection of the companies in participating in a research of this nature, sometimes manifested by the distrust of data conidentiality provided by respondents. he study is restricted to Brazilian companies, that is, an emerging country, which does not allow generalizations to developed countries. he analysis is restricted to internal variables, subjecting the results to the idiosyncrasies of the sample companies.
It is suggested greater focus on the part of managers on the variables related to skills development and knowledge of the target markets of company exports, since variables were identiied related to exports barriers related to legislation and red tape. hus, the encouragement of visits to foreign markets and participation in international fairs may contribute to an increased knowledge on the international market. Investments on the
product were also signiicantly related to export performance. he release of speciic products for export was an influential variable on the export performance, leading to infer the need for higher resources allocation to the development of products oriented to the external market.
A greater involvement with networks, especially governmental, is considered necessary, as its positive relations with export performance was veriied. As the variables related to organizational structure showed little inluence on the export performance, the focus inferred in skills related to international transactions allow companies with limited organizational resources to direct more investments to prepare managers for the involvement in trade fairs and visits to exports target markets.
he development of activities involving networks of governmental and corporate networks is suggested in order to stimulate knowledge exchange, information and relations in order to reduce perceived barriers in foreign markets, such as bureaucratic procedures and legislation, as well as to monitor the reputation of Brazilian products abroad. The stimulus to trade fairs abroad has become necessary to allow the increase of managers knowledge about foreign markets and their procedures, as well as the culture of potential export destination countries, thus allowing adjustments in products and their dissemination.
REFERENCES
AABY, N-E; SLATER, S. F. Management inluences on export performance: a review of the empirical literature. International Marketing Review, Bradford, v. 6, n. 4, p. 7– 26, 1989.
ALÉM, A. C.; GIAMBIAGI, F. O BNDES em um Brasil em transição. Rio de Janeiro: BNDES,
2010.
ARMARIO, J. M.; RUIZ, D. M.; ARMARIO, E. M. Market orientation and internationalization in small and medium-sized enterprises. Journal of Small Business Management, Morgantown, v. 46, n. 4, p. 485-511, Oct 2008.
BABAKUS, E.; YAVAS, U.; HAAHTI, A. Perceived uncertainty, networking and export performance: a study of Nordic SMEs. European Business Review, Bradford, v. 18, n. 1, p. 4-13, 2006.
BARNEY, J. Firm resources and sustained competitive advantage. Journal of Management, housand Oaks, v. 17, n. 1, p. 99-120, Mar. 1991. BONACCORSI, A. On the relationship between firm size and export intensity. Journal of International Business Studies, Basingstoke, v. 23, n. 4, p. 605-635, 1992.
BRASIL. Empreendedor - Mapa das micro e pequenas empresas: empregos de pequenas e medias empresas. 2012. Disponível em:
<http://www.brasil.gov.br/empreendedor/ empreendedorismo-hoje/o-mapa-das-micro-e-pequenas-empresas/print.>. Acesso em: 25 de jul. 2012.
BROUTHERS, L. E.; BROUTHERS, K. D.; WERNER, S. Is dunning’s eclectic framework descriptive or normative? Journal of International Business Studies, Basingstoke, v. 30, n. 4, p.
831-844, 1999.
BROUTHERS, L.; NAKOS, G.The role of systematic international market selection on small irms’ export performance. Journal of Small Business Management, Morgantown, v. 43, n. 4, p. 363-381, Oct. 2005.
CAMISON, C.; VILLAR-LÓPEZ, A. Effect of SMEs’ International experience on foreign intensity and economic performance: the mediating role of internationally exploitable assets and competitive strategy. Journal of Small Business Management, Morgantown, v. 48,
CARNEIRO, J.; ROCHA, A.; SILVA, J. F. Determinants of export performance: a study of large brazilian manufacturing irms. Brazilian Administration Review, Rio de Janeiro, v. 8,
n. 2, p. 107-132, Apr./June 2011.
COOPER, D. R.; SCHINDLER, P. S. Métodos de pesquisa em administração, 7. ed. Porto
Alegre: Bookman, 2003.
COVIELLO, N.; MUNRO, H. Network relationships and the internationalisation process of small software irms. International Business Review, [S. l.], v. 6, n. 4, p. 361, Aug. 1997.
CZINKOTA, M. R.; URSIC, M. Classiication of Exporting Firms According to Sales and Growth into a Share Matrix. Journal of Business Research,
New York, v. 22, n. 3, p. 241 -253, 1991.
DHANARAJ, C., BEAMISH, P.W. A resource-based approach to the study of export performance.
Journal of Small Business Management,
Morgantown, v. 41, n. 3, p.242-61, 2003.
DIERICKX, I.; COOL, K. Asset stock accumulation and sustainability of competitive advantage. Management Science, Linthicum,
v. 35, n. 12, p. 1504-151, Dec. 1989.
FÁVERO, L. P. et al. Análise de dados: modelagem multivariada para tomada de decisões. Rio de Janeiro: Elsevier, 2009.
FORTE, S. H. A. C.; MOREIRA, M. Z. Competitividade internacional baseada em recursos estudo da relação entre os recursos e as estratégias de internacionalização nas maiores empresas exportadoras do setor calçadista brasileiro. Revista de Ciências da Administração, Florianópolis, v. 9, n. 17, p. 27-52, jan./abr. 2007.
HAIR, J. F. et al. Análise multivariada de dados. 6. ed. Porto Alegre: Bookman, 2009.
and Uppsala Model
______; VAHLNE, J. he internationalization process of the firm – a model of knowledge development and increasing foreign market commitment. Journal of International Business Studies, Basingstoke, v. 8, n. 1, p. 23-32, Spring/ Summer 1977.
______; ______. he Uppsala internationalization process model revisited: From liability of foreignness to liability of outsidership. Journal of International Business Studies. Basingstoke,
v. 40, p. 1411–1431, 2009.
KALEKA, A. Studying resource and capability efects on export venture performance. Journal of World Business, Oxford, v. 47, n. 1, p. 93–105,
Jan. 2012.
K ATS I K E A S , C . S . ; L E O N I D O U , L . C.; MORGAN, N. A. Firm-Level Export Performance Assessment: Review, Evaluation, and Development. Journal of the Academy of Marketing Science, [S. l.], v. 28, n. 4, p.
493-511, Fall 2000.
KATSIKEAS, C.; PIERCY, N.; IOANNIDIS, C. Determinants of export performance in a European context. European Journal of Marketing, [S. l.], v. 30, n. 6, p. 6-35, 1996.
L A D O , N . ; M A R T Í N E Z - R O S , E . ; VALENZUELA, A. Identifying successful marketing strategies by export regional destination.
International Marketing Review, Bradford,
v. 21, n. 6, p. 573-597, 2004.
______; ______. SME internationalization and performance: growth vs. proitability.Journal of International Entrepreneurship, Dordrecht, v. 4, n. 1, p. 27-48, Mar. 2006.
MAJOCCHI, A.; BACCHIOCCHI, E.; MAYRHOFER, U. Firm size, business experience and export intensity in SMEs: a longitudinal approach to complex relationships. International Business Review, [S. l.], v. 14, n. 6, p. 719-38, Dec. 2005.
MARSHALL, A. Princípios de economia: tratado introdutório. São Paulo: Abril Cultural, 1982.
MARTIN-TAPIA, I.; ARAGÓN-CORREA, J. A.; RUEDA-ANZANARES, A. Environmental strategy and exports in medium, small and micro-enterprises. Journal of World Business, Oxford, v. 45, n. 3, p. 266–275, July 2010.
MAUREL, C. Determinants of expor t performance in French wine SMEs. International Journal of Wine Business Research, Bradford, v. 21, n. 2, p. 118-142, 2009.
MONTOBIO, F.; RAMPA, F. he Impact of technology and structural change on export performance in nine developing countries. World Development, Oxford, v. 33, n. 4, p. 527-547, 2005.
M O RG A N , N . A . ; VO R H I E S D . W. ; SCHLEGELMILCH B. B. Resource–performance relationships in industrial export ventures: the role of resource inimitability and substitutability.
Industrial Marketing Management, New York, v. 35, n. 5, p. 621-633, July 2006.
MUSTEEN, M.; FRANCIS, J.; DATTA, D. K. he inluence of international networks on internationalization speed and performance: a study of Czech SMEs. Journal of World Business, Oxford, v. 45, n. 3, p. 197-205, July 2010.
NAVARRO, A et al.. Implications of perceived competitive advantages, adaptation of marketing tactics and export commitment on export performance. Journal of World Business,
Oxford, n. 45, p. 49-58, Jan. 2010.
O’CASS, A.; WEERAWARDENA, J. Examining the role of international entrepreneurship, innovation and international market performance in SME internationalization. European Journal of Marketing, [S. l.].,v. 43, n. 11/12, p.