Performance of Brazilian Companies and its Evolution
Performance of Brazilian Companies and its Evolution
Performance of Brazilian Companies and its Evolution
Performance of Brazilian Companies and its Evolution
Performance of Brazilian Companies and its Evolution
Between 1990 and 2003
Between 1990 and 2003
Between 1990 and 2003
Between 1990 and 2003
Between 1990 and 2003
André Ribeiro Gonçalves
Rogério H. Quintella
R
R
R
R
R
E S U M OE S U M OE S U M OE S U M OE S U M OO presente artigo analisa a variância do retorno sobre ativos (ROA) de 1664 empresas brasileiras entre 1996 e 2003. Nesse estudo a variância é dividida entre os fatores associados às diferenças entre as empresas, os setores em que elas se inserem e as condições econômicas do país. Os resultados do modelo foram, também, analisados dividindo o período total em intervalos de quatro anos, de forma a permitir a percepção de eventuais reflexos da conjuntura econômica do País sobre o desempenho das companhias. Os resultados mostram que a principal fonte de variação de performance pode ser atribuída a diferenças existentes entre as empresas e que o peso deste efeito se eleva ao longo do período estudado. Surpreendentemente, apesar das muitas e freqüentes crises pelas quais o País passou nos últimos anos, o efeito do contexto econômico sobre o desempenho das empresas mostrou-se pequeno, equivalente ao encontrado por outros autores que analisaram o caso de empresas situadas no mercado Norte-Americano.
Palavras-chave: estratégia; performance; retorno sobre ativos; empresas brasileiras.
A
A
A
A
A
B S T R A C TB S T R A C TB S T R A C TB S T R A C TB S T R A C TThis work studies the variance of the return over assets (ROA) of 1,664 Brazilian organizations between 1996 and 2003. This variance is divided into in factors associated with differences between business units, imdustries and economic conditions. The model is also calculated dividing the overall period into four year intervals so as to follow the evolution of the factors over the years. Results show that the main source of the variation in the performance can be attributed to differences among companies. The weight of this element increases over time. Surprisingly, considering the many and frequent crises suffered in the last couple of years, the role of the economic climate is slight and similar to that found by other authors for the American market.
IIIII
NTRODUCTIONNTRODUCTIONNTRODUCTIONNTRODUCTIONNTRODUCTIONProfit is an essential condition for the existence and survival of a company and is critical if it desires to pursue its goals. Survivability is, in the long run, linked to the ability to generate profit and keep a positive cash flow. However, organizations are not equally adept at making money. Profit, as defined by Porter (1989) is the result of sustainable competitive advantages. Some firms seem to be able to get a return on capital persistently higher than average (Jacobsen, 1988). The reasons for this are controversial.
Many economic studies, especially in the field of Industrial Organization (Tirole, 2002) consider as a unit of analysis the market or industry in which the firm is competing. Therefore, the reasons for a company’s success can be found in the elements that define the market, rather than in the company itself. In the business strategy arena, this vision can be seen in the schools of strategic positioning (Hoskisson et al., 1999; Langlois, 2003; Porter, 1999). This point of view is one of the bases for Porter´s five force model (1989, 1999). Many empirical studies support this view (Geroski, Gilbert, & Jacquemin, 1990; Kessides, 1986; Martin & Jamumandreu, 1999; Scherer, 1996). The market, in this vision, is the main driver for performance.
On the other hand, many researchers have recently started adopting the opposite point of view. The main source of performance differences, they claim, are to be found within the companies themselves (Bonn, 2000; Collins & Porras, 2000). One strong contender in this line of work is the resource based view of the firm (Barney, 2001; Wernerfelt, 1984). According to this theory, organizations are intrinsically heterogeneous as regards available resources (Fahy & Smithee, 1999). These differences do not disappear with time, instead they are maintained by a multitude of mechanisms (Amit & Schoemaker, 1993; Collins, 1991; Grant, 1991; Peteraf, 1993). Some authors have analysed theoretical reasons for this persistence (Schoemaker, 1990). Again, empirical studies support this view, showing significant differences among companies competing in the same industries (Mueller, 1977; Waring, 1996; Wiggins & Ruefli, 2002). From this viewpoint, differences between firms, namely the strategies they employ, are responsible for differences in profits.
economic plans failed, dramatic currency devaluations occurred, there was a presidential impeachment, and a default on external debt (Miranda, 2003).
During the nineties, Brazil suffered profound changes in its economic foundations. Increased trade opening reduced the average import tariff from 51% to 14.9% in six years (Soares, Servo, & Arbache, 2003), a comprehensive, although incomplete, privatization programme changed entire sectors (Carvalho, 2001), in 2001 there was an electric energy crisis (Moreira, Motta, & Rocha, 2003), as well as a dramatic increase in public debt (Versiani, 2003). These factors do not affect all industries in the same way, some are benefited, while others harmed. However, on average, it is expected that such sudden and profound changes have greater effects on the performance than those observed in more stable economies, where such crises are rare.
It would be reasonable to suppose that such changes, both those affecting the whole economy as well as those affecting different industries, play a greater role in explaining the differences in performance of Brazilian businesses than the equivalent contribution of such changes in more developed economies.
This work attempts to analyze the contribution of the business unit, industries and economic global factors on profit levels of Brazilian companies from 1996 to 2003. Three hypotheses are used in this analysis:
H1a – If the market structure is the main source of differences in profitability, the differences in performance of firms in different industries should be higher than the difference of performance of firms in the same industry.
H1b – If the differences between firms are the main source of differences in profitability, then the difference in performance of firms in the same industries should be greater than differences in performances of firms among industries.
H2 – If unstable overall market conditions affect the profitability of the firms, then the contributon of this effect for the differences in profitability should be higher in Brazil given successive crises than in markets with stable environments, such as the United States.
H3 - If unstable overall market conditions affect the profitability of firms differently in different industries, then the contribution of this effect for the differences in profitability should be higher in Brazil given successive crises than in markets with stable environments, such as the United States.
P
P
P
P
P
REVIOUSREVIOUSREVIOUSREVIOUSREVIOUSS
S
S
S
S
TUDIESTUDIESTUDIESTUDIESTUDIESA pioneering study using this methodology was carried out by Schmalensee (1985). The author analyzed companies within the Federal Trade Comission´s Line of Business database. Only the year of 1975 was used. His article considered the effects of the industry (market), economic group and marketshare on the variance of profitability. The equations were solved using a nested ANOVA model. The results indicated significant effects only for the industry (market) effect.
Although not the first, Rumelt´s (1991) work became one of the best known text using this kind of modeling. His article advanced the model proposed by Schmalensee by adding a series of improvements to the methodology, the main one being the inclusion of three more years of data. With that he was able to measure the firm effects directly, dismissing the use of marketshare as a proxy. As well as the nested ANOVA Rumelt added a new analysis of variance of components (VARCOMP). He divided the firm effects in two components, business unit for individual firm effects and group for parent corporate effects. Rumelt’s work gave final shape to the empirical model used for this line of research. All further research in the subject, in one way or another, can be understood as derivations from his study. His results show that the business unit is the main component responsible for performance variance, contrary to previous works.
McGahan and Porter (1997) did a similar study but using a considerably larger database, Compustat, which allowed them to analyze five other macro sectors besides manufacturing where the previous works had been concentrated. These were agriculture and mining, transport, sales, tourism, services and manufacturing. The aggregate results were similar to Rumelt’s, with the business unit as the main factor, followed by industry effects. Slight corporate and transient effects were found.
McNamara and Valeer (2001) presented a working paper using a similar methodology and using Compustat as the database. The novelty here was the division of the period of time for the data covered, from 1979 to 1998, into seventeen four year windows. It allowed for the analysis of the evolution of each effect over time. Their work showed group effects becoming more important on the North American market whereas industry effects lost significance during the interval studied. Although this work had not been published, the authors used it as part of another text (McNamara & Valeer, 2003) which examines competition among companies in the nineties.
Eriksen & Knudsen, 2003; Khanna & Rivkin, 2001). Particularly important for this text was a study by Brito and Vasconcelos (2003a) which made use of a similar model to Rumelt´s, but without the corporate effect. This is the only work known to use the Gazeta Mercantil database. Despite the database’s size (only 15 industries and 245 firms were used) the results were, in many aspects, unexpected. One important argument was that Brazil, due to successive crises and a generally unstable business environment, would suffer considerable year and transient effects. However, the results actually found were even lower than those reported by Rumelt (1991) and, at least for the year effects, not statistically significant. The general conclusion of previous works, that the main effect on profitability is due to the business unit, was also found in this study.
Brito and Vasconcelos (2003b) published a second study, with a very similar model to Rumelt´s (1991), this time using the Compustat database. An additional effect was added to account for the so-called country effect, representing local culture and environment. This work found significant country effects in all industry aggregates. This result lends weight to the notion that there are significant differences between countries with regard to the weight of the factors analyzed.
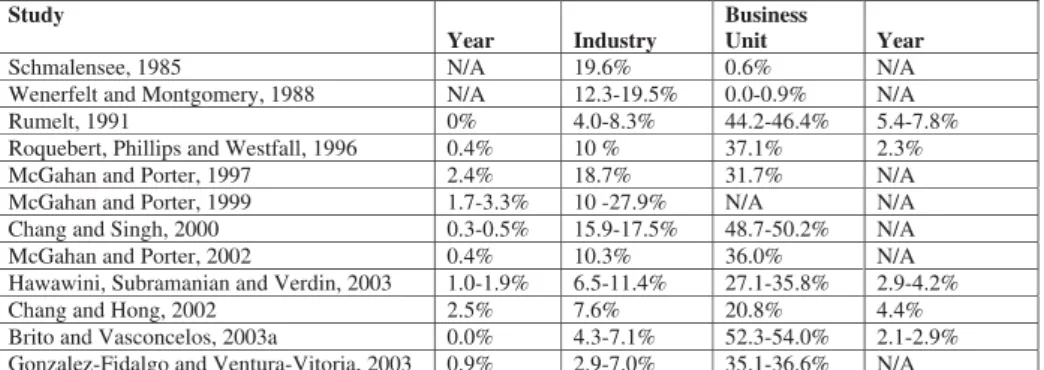
Tables 1, 2a and 2b represent and outline the main results of the studies that use the methodology used in this work.
Table 1: Results Overview
D
D
D
D
D
ATAATAATAATAATAFor this work, the On-Line version of Balanço Anual da Gazeta Mercantil, the leading Brazilian business newspaper, was selected as source. Its database contains data extracted from annual reports of Brazilian main companies in the most diverse sectors of the economy since 1977. The current version includes about 10,000 companies grouped in 72 macro economic sectors and 300 groups (Gazeta Mercantil, 2003). These 72 macro sectors, in turn, are subdivided in 1104 economic sectors.
information roughly ten times more than in the previous work. The data selection and handling consisted of two stages. A first stage defined the inclusion criterion, i.e. which companies, among those available in the original database, could participate on the sample. The second phase consisted of the exclusion criteria. In other words, which companies, of those chosen in the first stage, would have to be removed from the research database and the criteria for this removal.
The data of 16 macro-sectors was selected, these being: foods, leather and footwear, household-electric, electric, diverse manufacturing, pharmaceutical equipment, hygiene and cleaning products, wood and furniture, clerical, mechanics, paper and cellulose, oil and gas, plastics and rubber, petrochemicals and, textile material, vehicles and auto parts.
These are the economic segments of manufactured goods, coming close thus to those chosen by Rumelt (1991). These macro-sectors constitute a total of 226 economic sectors.
Although the Balanço Anual da Gazeta Mercantil has been published for 26 years, in practical terms, the oldest editions contain little information compared to the newer. After an exploratory analysis it was decided to select only nine years, between 1995 and 2003. This criterion resulted in the analysis of 14,328 data for 3,150 companies.
An analysis of the data disclosed cases of ROA values above 1 and, also, below -1. For these cases the profits or losses would have been superior to the total of assets of the company. These cases, in a total of 120, possibly attributed to typing errors in the database used were removed. As a consequence the database was reduced to 14,208 items of data.
The analysis of the number of companies per year reveals that the year of 1995 is under represented in the original database. Only 307 companies, about 10% of the total, are registered in the Balanço Anual da Gazeta Mercantil in this year. Therefore, the related year was eliminated from the database used in the article, decreasing the amount of useful data to 13,901.
After that the economic sectors with just one company were also eliminated as it is impossible to distinguish the effect of the profitability due to company and the effect due to the market where it operates. The database was, then, reduced to 13,715 items.
years. As an additional criterion, for four year intervals, the company should be present in at least two of these years.
When eliminating companies in the given sample for the last criteria, there was the risk that certain sectors would again be reduced to only one participant company. Therefore, at the end of each selection, the database was verified again to check if any companies failed to meet the criterion of at least two companies in each considered economic sector. The final numbers of the analyzed database are those listed in Table 3. It shows a total of 1,102 companies for the eight year period.
Table 3: Selected Database in the Different Steps
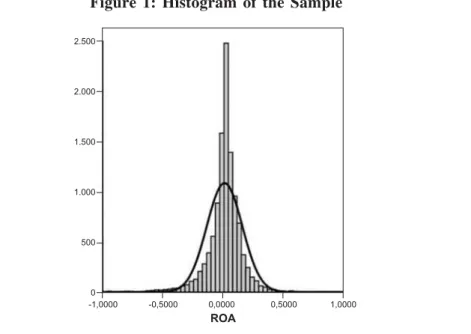
The average ROA in the used sample is 0.45%, its median is 1.03% and standard deviation is 14.6%. The kurtosis’ coefficient is 7.89 and its asymmetry is -1.07.
Figure 1 below shows the histogram of the used sample against a normal distribution curve.
R
R
R
R
R
ESULTSESULTSESULTSESULTSESULTSANDANDANDANDAND
D
D
D
D
D
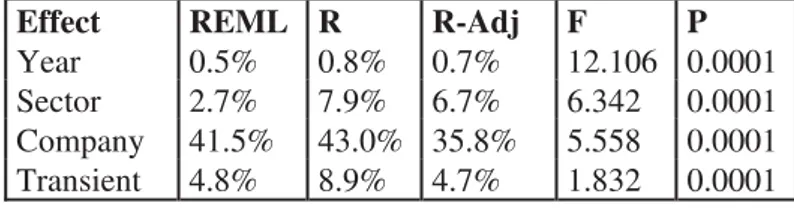
ISCUSSIONISCUSSIONISCUSSIONISCUSSIONISCUSSIONThe interval of 1996 up to 2003 was analyzed using ROA as dependent variable through two different methods of calculation: ANOVA (fixed effect) with squared minimums and Variance of Components (random effect) with REML using SPSS - 12. The result of the analysis can be found in Table 4 below.
Table 4: Results 1996-2003 (ROA)
Following the same methodology as Rumelt (1991), ANOVA was used to define whether the effect is statistically significant or not (P in Table 4). The contribution of the effect on profitability was measured on the basis of the result of the Variance of Components (REML in Table 4). All the results are statistically significant to the level of at least 99.99%, in other words, highly significant.
The results demonstrate that the preponderant effect on profitability is the company effect, which accounts for 41.5% of the contribution to performance. This effect represents 83.9% of model’s full capacity of explanation. This finding ratifies the results of aforementioned studies of the North American market where also it was found that the contribution of the company was the most significant. The effect of the economic sector on the profitability was of 2.7%, contributing with 5.5% of model’s full capacity of explanation. This effect is fifteen times smaller than the company effect. These two results allow testing the hypotheses H1a and H1b previously presented. The true hypothesis can be derived from this confrontation and is Hypotheses H1b:
H1b – If the differences between firms are the main source of differences in profitability, then the difference in performance of firms in the same industries should be greater than differences in performances of firms among industries.
The year factor, in turn, represents the effect of the economic conjuncture that affects all the companies in the same way. This factor is small, contributing only 0.6% to performance, however, it is statistically significant.
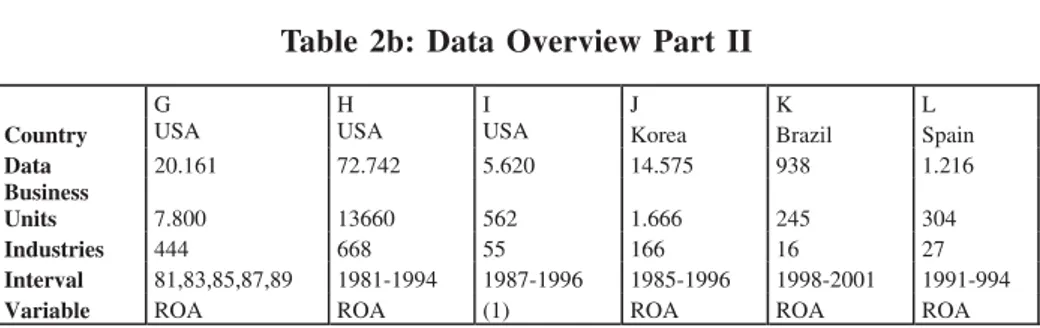
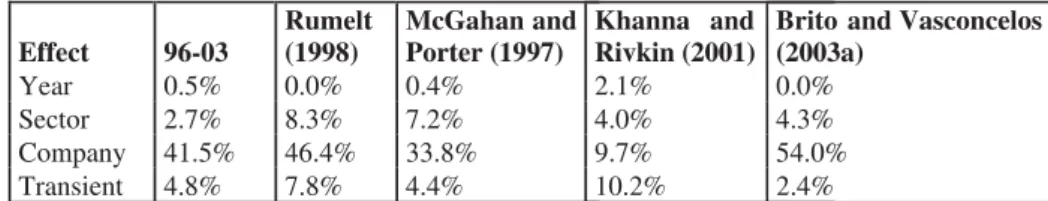
Table 5 below compares the numbers found in the present work with the results for the North American market (McGahan & Porter, 1997; Rumelt, 1991) and with previous studies of the Brazilian market (Brito & Vasconcelos, 2003a; Khanna & Rivkin, 2001).
Table 5: Comparison between Brazilian and North American Studies
In comparison with the North American research, the most significant difference found in the present article is the small contribution of economic sector, even less than that in the American case. The causes of this are not clear. Considering other variables, the values are comparable, especially when compared with the work of McGahan and Porter (1997). These authors made use of a more extensive database when compared with Rumelt (1991), which makes this similarity even more relevant.
Another important result is the similarity of results obtained for transient and year effects on profitability. The values found in this work are quite similar to North American ones. These results are surprising, as one would expect that the climate of permanent crisis in Brazil would have a greater impact on company profitability than the business climate prevailing in countries with steadier economies. The results refute hypotheses 2 and 3, that the timing effect would be more significant in the Brazilian market than in the North American one.
H2 – If unstable overall market conditions affect the profitability of the firms, then the contributon of this effect for the differences in profitability should be higher in Brazil given successive crises than in markets with stable environments, such as the United States.
H3 - If unstable overall market conditions affect the profitability of firms differently in different industries, then the contribution of this effect for the differences in profitability should be higher in Brazil given successive crises than in markets with stable environments, such as the United States.
items for Khanna and Rivkin (2001) and 938 for Brito and Vasconcelos (2003a), compared to the 11,113 of the present article. Despite this, Brito and Vasconcelos (2003a) present results similar to those in this article. The lack of year effect in Brito and Vasconcelos papers is probably related to the small amount of data. Khanna and Rivkin (2001), on the other hand, present results which are quite different from the others. However, as their source of data was not published it is impossible to analyze the cause of these differences.
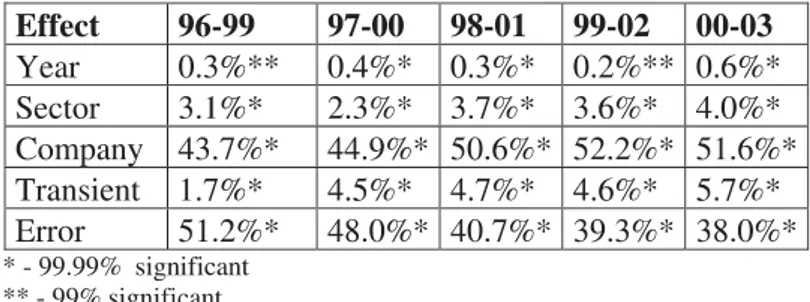
The interval of 1996 to 2003 was divided in smaller intervals of four years, and these have been analyzed using as dependent variable ROA., through two methods of calculation: ANOVA (fixed effect) with squared minimums and Variance of Components (random effect) with REML (restricted probability). The results can be seen in Table 6 below.
Table 6: Variance of the Components for Five Intervals
The main conclusion that can be drawn from the statistics in this table is the apparent contribution of the company to profitability, which increases year by year. Using the data of the contribution of independent companies as variable in an equation of the type Y = aX + b, adjusted for linear regression of squared minimums (Gujarati, 2000) results in a line practically straight with adjusted R of 0,79. This result has 95% significance. Consequently, in recent years the contribution of the particular characteristics of each company to profitability has increased. The model is purely descriptive and it does not offer any hypothesis on the reason for these results.
A
A
A
A
A
NALYSISNALYSISNALYSISNALYSISNALYSISOFOFOFOFOF
THETHETHETHETHE
L
L
L
L
L
IMITATIONSIMITATIONSIMITATIONSIMITATIONSIMITATIONSprofitability in different economic sectors. To calculate this contribution correctly the economic sectors have to be correctly classified. Ideally, each sector should correspond to a market. When this does not occur in the database used, there is a risk of underestimating the effect of the sector on profitability. Official classification of markets in Brazil is carried out by CNAE (National Classification of Economic Activities) regulated by the National Commission for Classification (this classification can be found on the Internet at http://www.ibge.gov.br/concla/cl_download.php). The CNAE is based on ISIC (International Standard Industrial Classification) an international code of classification. The classifications of each country, also refer to NASIC (North American Standard Industrial Classification), however, there are differences in classification from one country to the other. It has been observed that even the ISIC is not free of doubts about how correct it is (Scherer et al., 1987). The present work follows the classification used by the leading Brazilian business newspaper, which is different from CNAE’s classification. A preliminary comparison between the two classifications shows that the database used by the Brazilian business newspaper corresponds, in the most cases, to the four levels of CNAE’s classification. In a similar way, most of the American papers on the subject use the four levels of classification SIC/ NASIC. Thus, they are roughly equivalent. This equivalence reduces the risk of underestimating the effect of the sector on profitability in this study.
A second risk is related with the number of sectors used in the analysis. If it is not big enough it will not be sufficient to allow the use of the model. Of the 1,074 possible existing sectors in the Brazilian business newspaper’s database, only 156 have been used. If the risk of underestimating the value of the contribution of the sector can not be eliminated, the number of chosen sectors and the way they are divided seems to adjust them to the standard adopted for previous studies (Chang & Hong, 2002; Eriksen & Knudsen, 2003; Gonzalez-Fidalgo & Ventura-Victoria, 2003; Rumelt, 1991). Thus, despite the intrinsic errors of the present work, the results are comparable to those reached in studies carried out in other markets.
The minimum limit of revenue for inclusion of companies in the Gazeta Mercantil database means that the database fails to reveal the contribution of small companies in the economy. These companies do not normally publish Annual Reports. The inclusion of this type of company in the database used in the present paper is therefore difficult, not only because of lack of data, but also because of the high mortality rates they reveal. This should be seen as a limitation to the present paper. Future research on the subject would make a great contribution by allowing the inclusion of smaller companies into their own samples.
C
C
C
C
C
ONCLUSIONSONCLUSIONSONCLUSIONSONCLUSIONSONCLUSIONSANDANDANDANDAND
S
S
S
S
S
UGGESTIONSUGGESTIONSUGGESTIONSUGGESTIONSUGGESTIONSThe main conclusion of this work, considering the limitations already mentioned, is that, as already verified in the North American markets, the differences between companies are the main contributing factor for profitability variance. Therefore strategy, rather than markets, seems to be the crucial battlefield where company profit is defined.
This article reveals the existence of important timing effects of two distinct types. In the first type, the steady effect for profitability that can be attributed the economic conjuncture (represented in this article for the factors year and transient). These effects are small and similar to those found in other markets. Nevertheless, the small contribution of the conjuncture is surprising in a country where it is common to attribute most of its problems to its permanent state of supposed crisis. Again, considering the limits of this study, these successive crises seem to have exerted little effect on the performance of companies or, conversely, such effects are more or less similar across the board. New research in this area could attempt to explain how companies face and solve their conjunctural crises and if such affect or not profitability.
The second type of noteworthy timing effects is the increase in importance of the contribution of differences between companies to profitability over the whole period studied. This result is completely new in the literature reviewed as the only study to deal with this subject (McNamara & Valeer, 2001) showed a reduction in this factor. As the model is purely descriptive, no hypothesis can be offered from the observation of this phenomenon. Further more analytical research will be necessary to explain the reasons for this. Another excellent contribution would be gained by research that extends this analysis over longer periods of time.
R
R
R
R
R
E F E R E N C E SE F E R E N C E SE F E R E N C E SE F E R E N C E SE F E R E N C E SAmit, R., &
Schoemaker, P. J. (1993, January). Strategic assets and organizational rent. Strategic Management Journal,
14(1), 33-46.
Barney, J. B. (2001, November/December). Resource-based theories of the competitive advantage: a ten-year retrospective on the resource-based view. Journal of management, 27(6), 643-650.
Bonn, I. (2000).
Staying on top: characteristics of long-term survival. Journal of organizational change management, 13(1), 32-48.
Brito, L. A. L., &
Vasconcelos, F. C. (2003a).
Firm performance in extremly turbulent environment: year industry and firm effects. Anais do Encontro Nacional dos Programas de Pós-Graduação em Administração, Atibaia, SP, Brasil, 27.
Brito, L. A. L., &
Vasconcelos, F. C. (2003b).
How much does country matter?
Anais do Encontro Nacional dos Programas de Pós-Graduação em Administração, Atibaia, SP, Brasil, 27.
Carvalho, M. A. S. (2001).
Privatização, dívida e déficit públicos no Brasil.IPEA (Textos para discussão n. 847, novembro, 2001).
Retrieved January 12, 2004, de http:// www.ipea.gov.br/pub/td/2001/ td_0847.pdf
Chang, S. J., & Singh, H. (2000, July).
Corporate and industry effects on business unit competitive position. Strategic Management Journal, 21(7), 739-752.
Chang, S. J., & Hong, J. (2002, March).
How much does the business group matter in Korea? Strategic Management Journal, 23(3), 263-274.
Collins, C. C., & Porras, J. I. (2000).
Feitas para durar: práticas bem-sucedidas de empresas visionárias. Rio de Janeiro: Rocco (Obra original publicada 1995).
Collins, D. J. (1991, Summer).
A resource-based analysis of global competition: the case of the bearings industry. Strategic Management Journal, 12, pp. 49-68.
Dean, A., & Voss, D. (2000).
Design and analysis of experiments
(2nd ed.). Nova Iorque: Verlag.
Eriksen, B., &
Knudsen, T. (2003, March)
Fahy, J., & Smithee, A. (1999).
Strategic marketing and the resource based view of the firm. Academy of marketing science review. Retrieved July 28, 2004, from http:// www.amsreview.org/articles/fahy10-1999.pdf
Fisher, F., &
McGowan, J. (1983, March).
On the misuse of accounting rates of return to infermonopoly profits.
American Economic Review, 73(1), 82-97.
Furman, J. (2000).
Does industry matter differently in different places? Evidence from four OECD countries (MIT-Sloan working paper, #4121). Retrieved September 11, 2003, from http://people.bu.edu/ furman/Industry%20matters.pdf
Gazeta Mercantil (2003).
Balanço on line. Retrieved December 11, 2003, de http:// w w w . i n v e s t n e w s . c o m . b r / balanco2004/default.asp
Geroski, P., Gilbert, R. J. & Jacquemin, A. (1990).
Barriers to entry and strategic competition. Nova Iorque: Harwood Academic Publishers.
González-Fidalgo, E., & Ventura-Victoria J. (2003).
How much do strategic groups matter? Seção teses de doutorado. Retrieved August 05, 2003, from http:/ /www19.uniovi.es/econo/doctrabajo/ Dt01/d231_01.pdf
Grant, R. M. (1991, Spring).
The resource-based theory of competitive advantage: implications for strategy formulation. California Management Review, 33(3), 114-135.
Gujarati, D. N. (2000).
Econometria básica (3a ed.). (E. Yoshida, Trad.). São Paulo: Atlas. (Obra original publicada 1995).
Hawawini, G., Subramanian, V., & Verdin, P. (2003, January).
Is performance driven by industry-or firm-specific factors? A new look at the evidence. Strategic Management Journal, 24(1). 1-16.
Hoskisson, R. E., Hitt, M. A., Wan, W. P. &
Yiu, D. (1999, May/June).
Theory and research in strategic management: swings of a pendulum.
Journal Of Management, 25(3), 417-456.
Iudicibus, S., & Marion, J. C. (2000).
Curso de contabilidade para não contadores (3a ed., Cap. 11, pp. 155-168). São Paulo: Atlas.
Jacobsen, R. (1988, September/October). The persistence of abnormal returns.
Strategic Management Journal, 9(5), 415-430.
Khanna, T., &
Rivkin, J. W. (2001, January).
Estimating the performance effects of business groups in emerging markets.
Strategic Management Journal, 22(1), 45-74.
Langlois, R. N. (2003, June/July). Strategy as economics versus economics as strategy. Managerial and Decision Economics, 24(4), 283-290.
Martin, A., &
Jaumandreu, J. (1999).
Entry, exit and productivity growth in Spnish manufacturing during the eighties. Universidad nacional de educacion a distancia, set 1999. Retrieved September 28, 2004, from http://www.uned.es/dpto-analisis- economico2/fichprof/amartin/Entry-exit.PDF
McGahan, A. M., &
Porter M. E. (1997, Summer).
How much does industry matter, really? Strategic Management Journal, 18(special issue), 15-30.
McGahan, A. M., &
Porter M. E. (1999, February).
The persistence of shocks to profitability. The Review of Economics and Statistics, 81(1), 143-153.
McGahan, A. M., & Porter, M. E. (2002, July).
What do we know about variance in accounting profitability? Management Science, 48(7), 834-851.
McNamara, G., & Valeer, P. M. (2001).
Devolving corporate effects: reconcilling mainstream and revisionist views of corporate strategy [working paper]. MIT University.
McNamara, G., Vaaler, P. M., &
Devers, C. (2003, April).
Same as it ever was: the search for evidence of increasing hypercompetition. Strategic Management Journal, 24(3), 261-278.
Miranda, M. C. (2003).
Crises cambiais e ataques especulativos no Brasil. Universidade de Brasília (Texto para discussão 266, dez. 2003). Retrieved September 12, 2004, de http://www.unb.br/face/eco/ cpe/TD/266Dez02MMiranda.pdf
Moreira, A. R. B., Motta, R. S., & Rocha, K. A. (2003).
A expansão do setor energético de energia elétrica: falta de mercado ou de planejamento. IPEA (Notas Técnicas n. 1, set. 2003). Retrieved January 12, 2004, de http:// w w w. i p e a . g o v. b r / p u b / n o t a s / notastecnicas1.pdf
Mueller, D. C. (1977, November). The persistence of profits above the norm. Economica, 44, pp. 369-380.
Peteraf, M. A. (1993, March).
The cornerstones of competitive advantage: a resource-based view.
Porter, M. E. (1989).
Vantagem competitiva: criando e sustentando um desempenho superior (21a ed.). (E. M. P. Braga, Trad.). Rio de Janeiro: Campus. (Obra original publicada 1985).
Porter, M. E. (1999).
Competição: estratégias competiti-vas essenciais (9a ed.). (A. C. C. Serra da Trad.). Rio de Janeiro: Campus. (Obra original publicada 1979).
Roquebert, J. A., Phillips, R. L. &
Westfall, P. A. (1996, October).
Markets vs. management: What ‘drives’ profitability? Strategic Management Journal, 17(8), 653-664.
Rumelt, R. P. (1991, March).
How much does industry matter?
Strategic Management Journal, 12(3). 167-185.
Scherer, F. M. (1996).
Industry structure, strategy, public policy. New York: HarperCollins.
Scherer, F. M., Long, W. F., Martin, S., Mueller D. C., Pascoe, G., &
Ravenscraft D. J. et al. (1987, March). The validity of studies with line of business data: comment. American Economic Review, 77(1), 205-217.
Schmalensee, R. (1985, June).
Do markets differ much? American Economic Review,75(13), 341-351.
Schoemaker, P. J. (1990, October). Strategy, complexity and economic rent. Management Science, 36(10), 1178-1192.
Searle, S. R. (1997).
Linear models. Wiley classics library. New York: John WiIley & Sons.
Soares, S., Servo, L. M. S., & Arbache, J. S. (2003).
O que (não) sabemos sobre a relação entre abertura comercial e o mercado de trabalho no Brasil. IPEA (Textos para discussão n. 843, november, 2003). Rio de Janeiro, RJ. Retrieved January 12, 2004, de http:// www.ipea.gov.br/pub/td/2001/ td_0843.pdf
Tirole, J. (2002).
The theory of industrial organization
(13th ed.). Cambridge: MIT Press.
Versiani, F. R. (2003).
A dívida pública interna e sua trajetória recente. Universidade de Brasília (Texto para discussão n. 284, março, 2003). Retrieved January 12, 2004, de http://www.unb.br/face/eco/ cpe/TD/284Mar03FVersiani.pdf
Waring, G. F. (1996, December).
Industry differences in persistence of firm-specific returns. The American Economic Review, 86(5), 1253-1265.
Wernerfelt, B. (1984, April/June). A resource-based view of the firm.
Wernerfelt, B., &
Montgomery, C. A. (1988, March). Tobin´s q and the importance of focus in firm performance. American Economic Review, 78(1), 246-250.
Wiggins, R. R., &