© FECAP
RBGN
Review of Business Management
DOI:10.7819/rbgn.v19i65.2911
432
Received on
02/23/2016
Approved on
02/10/2017
Responsible editor:
Prof. Dr. Guilherme Shiraishi
Evaluation process: Double Blind Review
The multilevel effect of marketing activities
on sales, revenue and profitability in a
micro-enterprise
Rafael Barreiros Porto
Rafaela da Rocha Costa
Eluiza Alberto de Morais Watanabe
University of Brasília,Faculty of Economics, Administration, Accounting and Public Policy Management, Administration Department, Brasília, Brazil
Abstract
Purpose – This study dynamically assessed the effectiveness of
marketing activities in the generation of product sales, revenue, and proitability in a micro-enterprise, a context that lacks research in marketing.
Design/methodology/approach – A longitudinal multilevel study was
conducted using daily panel data for 5,800 products sold and monthly time series on the business level, involving 26 months of commercial and inancial records for a micro-enterprise (a drugstore). Panel and time series regressions were performed.
Findings – The research shows that (1) marketing activities, in
particular price elasticity, quite accurately generate product sales, (2) the aggregated estimate of total marketing activities predicts monthly company revenue and proitability, and (3) in the investigated company, if marketing activities are intensiied in the same proportion to increase costs in products and goods, they are not eicient in generating proit.
Originality/value – his research supports investigations concerning
micro→macro level analysis relationships with commercial and inancial data in order to merge marketing decisions to inance.
Keywords – Marketing activities; business performance;
1
Introduction
Marketing activity is characterized as being a management task that involves planning the conception of products, their price, promotions, and distributions to meet consumer demand (Wilkie & Moore, 2007). It is a set of entrepreneurial actions that are part of the management process that connects a business with its consumers and can be conigured in several ways (Finkelstein & Peteraf, 2007). It is generally measured as an amount of managerial work executed in sales, converting input into output. In short, it is what marketing professionals do and is central to marketing concept from a managerial perspective (Nicolau, 2013).
The effectiveness of such activities in terms of revenue and proitability is a topic that brings together the interests of professionals and researchers from the business management ield (Mintz & Currim, 2013; Roberts, Kayande, & Stermersch, 2013). However, due to the operational limitations involving how to measure activities and how to relate them to business performance indicators, researchers have made few advances in the scientiic knowledge that could improve the efectiveness of marketing management.
Part of what is researched regarding this subject is related to the marketing costs (especially advertising) described in accounting information such as the company’s income statement and balance sheet (Raman, Mantrala, Sridhar, & Tang, 2012). his line of investigation has been rewarding (Guissoni & Neves, 2013), but leads to general indings on the inluence of marketing costs on inancial performance without specifying which speciic cost is responsible for variations in rates of returns. Moreover, these studies do not indicate the incidence or execution of an individual activity itself, but rather, the alleged costs connected to them (Ward, 2013). hus, the true sources of the company’s product and service sales, those that directly afect consumers, remain unknown.
he reason for the lack of studies directly investigating marketing activities and inancial performance involves the diferences between what is recorded and focused on company customer management and what is recorded for accounting and inancial purposes (Hill, 2001; Ward, 2013). In general, business documents do not “talk” to each other and do not have the same purpose or target. Furthermore, there is the problem of directing the information: marketing activities are almost exclusively intended for managers to decide on the sale of products and accounting cost information is generally directed at decisions about the company’s inancial results (Monteiro & Barbosa, 2011).
hese diiculties are partially overcome when studies consider diverse levels of analysis (McDonald, Mouncey, & Maklan, 2014): one that concerns a company’s commercialized products and another that concerns the company as a whole, the latter encompassing the former. To bring forward this solution, studies need to investigate both levels of analysis, containing disaggregated (individualized) data regarding product commercialization and aggregated data regarding business inancial performance.
his approach has come across obstacles, especially in the context of micro and small businesses (Brooks & Simkin, 2011). hese do not generally record their marketing activities with precision and their accounting information may not be audited regularly, which hampers investigations. However, the incidence of these companies in the Brazilian market is quite high (Sebrae, 2015) and they do, nonetheless, implement some marketing activities, controlling their inancial operations to some degree.
To this end, we investigate (1) the efect of each marketing activity carried out by a micro-enterprise on sales, for each one of its daily commercialized products; (2) whether the entire set of marketing activities in an aggregated way explains monthly variations in revenue; and (3) whether these marketing activities explain monthly variations in sales returns (elasticities of proitability), comparing to the efect of product costs. hus, the aim is to show a method for evaluating marketing activity returns in a small company.
2
Marketing dynamics and the
financial performance of small
enterprises
From a managerial perspective, what marketing professionals do is a set of actions that involve analyzing market opportunities, choosing target markets, developing marketing strategies/ programs, and organizing, implementing, and controlling marketing efforts (Zait, 2009). Marketing activities are generally analyzed via the execution of the marketing mix – product, price, place, and promotion (Asgarnezhad Nouri, Sanayei, Fathi, & Kazemi, 2015). heyare part of marketing capacities (e.g. adaptation of marketing process, use of market information to develop marketing processes, etc. - Vorhies, Orr, & Bush, 2011).
Traditionally, studies that relate marketing activities with financial performance use the Compustat databases with data on Proit Impact of Marketing Strategy – PIMS (Boyd, Farris, & Hildebrandt, 2004). he data are on a business strategy unit level for North American companies and provide information regarding relative market share, marketing costs, relative prices, relative product quality, introductions of new products, and product line innovations, etc.
Recent advances in the interface between marketing and inance have provided empirical evidence on the impact of a speciic marketing activity on company performance, using real and not only North American longitudinal company
data (Morgan, 2012). The Market Response Models – MRM (Hanssens, Parsons, & Schultz, 2003) have been quite widely used since the end of the 1990s to explain the dynamics of the efects of marketing activities.
Some studies assess the effect of each marketing activity on product sales over time, by separating short and long term efects (Ataman, Van Heerde, & Mela, 2010; Jandaghi, Amiri, Amini, & Darani, 2011), and others investigate the dynamic efect of these activities on revenue, proitability, and value in the inancial market (Feng, Morgan, & Rego, 2015; Lima & Porto, 2012; Mizik, 2014; Siddhanta & Banerjee, 2014).
Specifically, Hanssens and Dekimpe (2008) support these studies by reporting how marketing investment evaluations are useful not only for marketing functions, but also for the entire company. hey use contextual explanations involving the Chain of Marketing Productivity – CMP (Rust, Ambler, Carpenter, Kumar, & Srivastava, 2004) and flow metrics directed towards the shareholder from Srivastava, Shervani, and Fahey (1998). To ensure higher or quicker and more sound proitability, they propose that marketing investment can generate immediate results in company revenue low and in building brands and customer base, which are not very visible in the short run.
In turn, Mizik (2014) demonstrates through aggregated company level data that only a small portion of the total inancial impact (proit) of brand equity (one of the most strategic marketing activities) is revealed immediately (current year), whereas most is realized in subsequent years. his result is consistent with the proposal from Hanssens and Dekimpe (2008) regarding the efect of brand building being more visible in the long run; however, Mizik (2014) found a lot of heterogeneity in these efects (some companies only presented immediate brand equity efects while others only presented them in the long run).
quite distant from the reality that the PIMS, RMR, and CMP studies have investigated. he owners or managers of small enterprises are generally not trained in marketing and hardly use professional marketing techniques (Hankinson, 1991). For example, aspects such as the customer relationship, word of mouth, and dialogue with clients are practiced by managers or owners without the use of professional marketing techniques and any awareness of these being systematized marketing actions (Coelho, de Miranda, Camargo Filho, Freitag, & de Almeida, 2015).
In broader terms, McCartan-Quinn and Carson (2003) list some of the marketing characteristics that the small businesses have in common: (1) the limited physical and inancial resources results in asymmetrical and limited marketing actions; (2) generally, they do not systemically record the marketing actions implemented; (3) they do not trade their shares on a stock exchange; (4) because they are not mandatorily audited, some of the companies do not have reliable accounting data; (5) many do not have a strong brand or market power; and (6) the marketing actions implemented generally aim for immediate increases in revenue and accounting proit, and these actions may often be inefective.
he greatest incidence of small enterprises is in commercial retail. Besides the previous features, these companies are characterized for: (1) having few sales outlets, if not only one; (2) rarely engaging in promotional activities and often limiting themselves to identifying the name of the shop or sporadic actions involving posters, lealets, or gifts; (3) there is little variety in product assortment or little variety of brands, with cases of companies that sell only one product; (4) they regularly use price reduction strategies, despite often not measuring the returns from these actions; (5) they occasionally renovate the store externally or internally; and (6) they may make use of a sales team that earns via sales commissions (Braghin, Higashibara, de Freitas, Catuchi, & Mancini, 2008; Conselho Federal de Farmácia
CFF, 2008; Guia das Farmácias, 2014; Oliveira Filho, 2013).
All these limitations have led to a loss of opportunity for the managers or owners to operate in the market in terms of obtaining scale and an impact on financial indicators. McCartan-Quinn and Carson (2003) concluded that the marketing practices of small companies are informal, intuitive, and focused on sales. his situation has required considerable efort on behalf of researchers to understand the efects of marketing on inancial performance in these small enterprises.
In developing countries such as Brazil, small enterprises systematically lack recorded marketing data. hus, some studies investigating the reality of small companies have used a cross section involving questionnaires to measure marketing activities [e.g. asking for comparisons with competitors regarding marketing capacities using Likert type scales (Floriani & Fleury, 2012; Vorhies, Orr, & Bush, 2011)] and company performance [e.g.: if financial performance is better or worse than competitors or how much respondents say they used a particular performance metric to evaluate results (Akroush, 2011; Mintz & Currim, 2013)].
Additionally, multivariate analyses are rare in the studies involving this theme in Brazil (Sarquis et al., 2016), and do not systematically demonstrate marketing activity derived predictors of inancial success for small enterprises. Because small companies focus on sales [and not so much on proitability maximization (McCartan-Quinn & Carson, 2003)], managers’ or owners’ concerns with growing revenue are obvious. However, the efect of the entire group of marketing actions on the sales of each product, company turnover, and proitability as a whole is not evident for entrepreneurs or managers. This requires a longitudinal analytical study of this efect in terms of both revenue and proitability, to unveil possible instabilities.
for marketing activities and inancial metrics becomes central to discuss the efectiveness of marketing. In general terms, a small commercial company worries a lot about selling suppliers’ products, stimulating sales using promotional material, increasing product assortment, product pricing alterations, offering more than one form of payment, changing the store ambience, and spending on sales teams, where applicable (Grewal, Levy, & Kumar, 2009; Newman & Cullen, 2002; Runyan & Droge, 2008). hese actions aim to stimulate the demand for some product sold on a daily basis. Nevertheless, the traditional revenue and proit/loss measurements are accounting related and refer to companies as a whole and do not capture the dynamics and heterogeneity of data. his makes it diicult to test and analyze efectiveness, and requires comparisons between diverse levels of analysis.
3
Research model and hypotheses
he importance of using multilevel models in large companies has been well documented (Hitt, Beamish, Jackson, & Mathieu, 2007). However, researchers addressing company performance and marketing activities have used little knowledge derived from models that cover more than one level simultaneously (Hansen & Wernerfelt, 1989; Wieseke, Lee, Broderick, Dawson, & Van Dick 2008). his has generated partial knowledge regarding the real impact of explanatory variables over an explained variable (e.g. inancial results), particularly when these explanatory variables are derived from diferent levels of analysis. he application of multilevel models in small companies is rare.
The models can contain different combinations of variables (Mayntz, 2004): (1) micro-micro, when the explanatory and explained variables are all on the lower level of analysis; (2) macro-micro, when the explanatory variables are on the higher level and the explained ones on the lower level; (3) micro-macro, when the explanatory variables are on the lower level and the explained ones on the higher level; and (4)
macro-macro, when the explanatory and the explained variables are on the higher level. Only models 2 and 3 are multilevel, while 1 and 4 are treated within the same level of analysis.
Isaeva, Safiullin, Bagautdinova, and Shaidullin (2013) suggest that in studies regarding competitive performance within economic systems, the objects of multilevel research can be in rising order: products, companies, sectors (or industries), and countries (or regions). his study presents a model on two levels (Figure 2), namely the product level and company level, and is characterized as micro-micro and micro-macro in a dynamic form (over time).
In the model in Figure 2, the micro-micro level is characterized by the daily marketing activities (for each product brand) that inluence the explained variable, daily sales (for each product brand) for a small retail company. hus, each marketing activity carried out for the product brands (price in log, payment via credit, sales commission, change in store ambience, promotional materials, and increased product assortment) is expected to exert a positive influence over products sales (Ataman, Van Heerde, & Mela, 2010; Bijmolt, Heerde, & Pieters, 2005; Klapper & Zenetti, 2012; Mishra, Sinha, & Koul, 2014; Morgado & Benito, 2015; Porto & Oliveira-Castro, 2015; Porto & Silva, 2014; Shields, 2006).
These activities are very commonly implemented by small companies (Newman & Cullen, 2002; Runyan & Droge, 2008) and this was the main reason behind choosing them. Moreover, these activities vary over time and aim to immediately increase revenue, which is typical of small companies with little concern for creating or sustaining brands to generate long term returns (Hanssens & Dekimpe, 2008).
should be linear and positive. Given that managers or owners execute these actions to increase supplier product sales, Hypothesis 1 (H1) can be thus formulated: the marketing activities generate a positive efect on the daily sales of the products sold by the small company.
Confirming (H1) is necessary so that Hypotheses 2 and 3 may be formulated. he micro-macro relationship in this study has two explained variables on the business (macro) level: monthly sales revenue and monthly company proitability (representing both inancial results variables). he micro level explanatory variable (monthly estimate of marketing activities) represents the total behavior of the irm involving its product marketing, which represents a logic contrary to that which multilevel studies generally test (Wieseke et al., 2008).
The monthly estimate of marketing activities is characterized by the sum of the score (Total Xbeta) for all daily product marketing
activities aggregated monthly. his reduces the heterogeneity of the micro level data, but allows for a general view of marketing activities. his aggregation is routine in market modeling for strategic marketing decisions (Leelang, Wieringa, Bijmolt, & Pauwels, 2015).
The modeling can be dynamic and analyzed via stationary time series. Hanssens et al. (2003) indicates that aggregation alters the functional form of disaggregated data, thus generating possible specification errors, and suggests that, as a rule, when it is applied to sales, any aggregation over time should correspond to a product’s purchase cycle.
However, correspondence to a product’s purchase cycle is not needed if diferent levels of analysis are considering dynamically. Purchase cycle should be handled at the micro level of daily product sales, which is useful for marketing
(commercial) decision making. However, it is not needed at the macro level of company decisions, which is generally monthly for cash low purposes (Irvine & Pontif, 2009). herefore, Hypothesis 2 (H2) and Hypothesis 3 (H3) can be formulated: the aggregated estimate of marketing activities dynamically generates a positive result in revenue (H2) and in company proitability (H3), just as they do at the micro-micro level these activities have an impact on product sales.
Marketing activity scores on the macro level can cause a non-significant (or even negative) efect on revenue and on proitability
due to spurious efects. In turn, these efects can occur due to speciication or measurement errors regarding the micro level variable to be aggregated (Croon & Van Veldhoven, 2007).
One way to avoid this and capture variables on a lower level in order to forecast a company’s performance (higher level) is by using latent scores for the explanatory variables originating from regression parameters (Croon & Van Veldhoven, 2007). In this study, this was done by calculating the aggregated estimate for all of the marketing activities carried out for the entire range of product brands sold monthly, which eliminates the possibility of spurious effects. Monthly aggregation of this score was necessary because the company performance variables are
calculated monthly for management purposes, which led to the conception of the macro level in this study.
Figure 1. Two level model of marketing activity efectiveness in terms of product
sales, revenue, and the proitability of the micro-enterprise.
Source: Elaborated by the authors.
a For certain products only.
4
Method
4.1
Framework
his study1 simultaneously uses product
panel data over 790 days (micro-micro level) and a 26-month time series for the investigated
subsequent presence (or high magnitude) is similar to experiments with repeated measurements, but it is manipulated naturally. In this paper, the manipulation is carried out by the micro-business managers themselves.
The study is quasi-experimental and involves a longitudinal section with two levels of analysis: micro level (product daily) and macro level (company monthly). The manipulated (explanatory) variables were the marketing activities implemented daily by the company to sell its products (micro level) and the aggregated estimates of these marketing activities on the macro level. We chose to insert a covariate (cost of products) on the macro level of the analysis to identify more clearly the efectiveness of the aggregated estimates of marketing activities. he explained variables were the daily sales of each product sold (micro level), monthly company revenues, and the monthly proitability indicator, both on a macro level.
4.2
Sample and data collection
he company is family run, was created in 1991, and is located in the Federal District of Brazil. It belongs to the pharmaceutical retail area and has six employees, of which four are sales assistants, one is a pharmacist, and one is a bookkeeper. It is open to the public from Monday to Sunday, from 8 am to 10 pm. he company carries out its management controls using a speciic software package for drugstores, called Microfarma, which classifies products into: perfumery, generic drugs, ethical drugs and natural food, and from which the research data was extracted.
In order to conirm that the marketing activities already recorded in the software were carried out, the researchers asked for payment receipts showing the exact moment each activity was carried out (e.g. change in store ambience, promotional periods, etc.). Changes in store ambience were both internal (changes to loor and walls) and external (changes to storefront) and occurred during a month of operations.
Moreover, the company bookkeeper provided reports containing turnover, taxes, social security contributions, and purchases. To complete this information, the owner provided data such as fees and administrative expenses. With all these data, net revenue and monthly returns on sales could be calculated.
The company analyzed has an annual gross revenue of less than R$ 360,000.00 and is thus classiied as a retail sector micro-business (Supplementary Law N. 139, 2011). A total of 5,800 products (bar-coded packages) were sold over 790 days, including samples of each packaging for all the available brands in the following categories: cosmetics, general usage medicines and red and black labelled (laboratory and generic) drugs, personal hygiene, perfumery, and natural food. On the microanalysis level, the sample was composed of 57,903 receipts for products sold, whereas on the second level it was composed of 26 months of the company’s recorded commercial and inancial data.
On the microanalysis level, the sample power for multiple regression with a small size efect (F2 = 0.02), with a probability error
α = 0.05, and with seven predictors, was equal to 99.99%, and more than enough to minimize Type 2 error. On the second analysis level, for both the relationships tested, the sample power for multiple regression with a large efect (F2 =
0.35), with a probability error α = 0.05, and with two predictors, was equal to 89.99%, and enough to minimize Type 2 error. Nonetheless, for samples below 50 on the macro level, Maas & Hox, (2005) suggest that standardized errors in macro level estimates are biased, characterizing a possible sample limitation.
4.3
Descriptive analysis of variables
Also in Table 1, it is observed that the estimates that represent the company`s marketing activities on a daily product commercialization level presented a high standard deviation, which means that there is a high spread in their use between products. But the spread in these estimates is high over the months (macro level), which means that the company reasonably maintains the same marketing activities for the products over the months.
It should be highlighted that the non-metric marketing activity variables were treated as dummies in the analysis. hus, promotional
periods were given code 1 if they were in the period and 0 otherwise, changes in store ambience were given code 1 if they were in the post change period and 0 otherwise, and periods of increased product assortment were given code 1 if they were in the period and 0 otherwise.
It was observed that regarding promotional periods, respiratory tract drugs, bronzers, sun blocks, and moisturizers were considered. With regard to product assortment, the nail varnish assortment was analyzed, since during the period it was the only one that presented any alteration (increased ofer in packaging and brands).
Table 1
Descriptive analysis of the data from the study
Variable Operational deinition Average Standard
Deviation %
Annual gross revenue Sum of multiplying the sales of all products by their sales prices
for one year 322,652.35 77,206.12
Monthly net revenue Monthly gross revenue minus returns, discounts, and sales taxes 26,164.40 6,079.74
Monthly cost of products Initial stock for the month plus purchases made during the month minus inal stock at month end 22,513.64 2,153.17
Monthly net proit Operating proit minus non-operating expenses minus employee proit sharing minus social security contributions 5,930.86 2,218.09
Returns on sales
(proitability) Net proit divided by net revenue for one month 0.25 0.12
Daily sales in the company Sum of multiplying one day of sales of all products by their sales prices 704.56 251.68
Daily sales per product Sum of multiplying one day of sales of each product by their sales price 12.22 2.39
Price of the products for one
day Product sales price (bar code) for one day 9.69 11.54 Sales assistant commission for
one day Sum of the amount paid for the product sold in one day 58.56 119.03 Percentage of payments made
via client credit for one day Amount of payment via credit card for each product divided by the total amount of client payments for each product in one day 14.54 7.43 Estimate of marketing activities
per product for one day Estimates (product in one dayXbeta) of all company marketing activities per 0.90 0.99 Promotional period for
respiratory tract drugs Total number of days that the drugs were on sale divided by the total number of days 23.30 Promotional period for
bronzers, sunscreens, and moisturizers
Total number of days that the cosmetics were on sale divided by
the total number of days 19.60
Change in store ambience Total number of days that the company operated with loor, wall, and storefront changes divided by the total number of days 69.40
Increase in nail varnishes assortment
Total number of days that the company operated with an increased variety of nail varnishes divided by the total number of days
4.4 Analysis procedure
In order to make the data analyses on two analysis levels possible, three regressions were carried out (Stock & Watson, 2004). he irst, on the micro-micro level (product daily time series panel data), in which the sales of each product is the explained variable and each marketing
activity present in the research model (Figure 1) the explanatory variables. Equation 1 illustrates the relationship tested. he Arellano panel data model with ixed efects and robust errors was used. he explained variable did not have normal distribution or the same variance error, thus requiring it to be transformed.
Equation 1
he sales of each product were initially divided by the average for each one during the period analyzed and their natural logarithms were subsequently extracted. his gave the variable normal distribution (Kolmogorov-Smirnov = 0.1; p > 0.05) with the same error variance (Wald Chi Squared = 46.86; p > 0.05). Interpreting the change in the value of sales then involves percentage points (above or below average sales). his also occurred with the explanatory variable, product sales price. Its transformation into a natural logarithm then allowed for price-revenue elasticity to be analyzed.
he model did not present multicollinearity problems (VIF < 2.4) and after considering the panel data structure it did not present serious problems of autocorrelation of the explained
variable (Durbin Watson = 1.79). he intercepts between the products were diferent (p ≤ 0.01) and the diagnostic test for the panel data model found that the MQO cluster model was not adequate, thus validating the alternative hypothesis that the ixed efect panel data structure was adequate (p ≤ 0.01).
The second regression analysis is the micro-macro one, for which the explanatory variable was the estimate of marketing activities on the lower level (derived from the irst regression), aggregated for the whole company monthly. he focus is on identifying whether marketing activities can be good predictors of revenue on the monthly business level. Equation 2 illustrates the tested relationship.
Equation 2
Due to the Durbin-Watson Test inding autocorrelation problems (0.35), time series regression was chosen. his regression made it possible to discover possible dynamic efects of the marketing activities implemented by the micro-enterprise on monthly revenue. he explained variable (monthly net revenue) presented normal distribution (Kolmogorov-Smirnov = 0.2; p > 0.05). he relationship is linear (LM = 0.001; p > 0.05), with adequate speciication (F = 2.08; p > 0.05), without heteroscedasticity (White Test LM = 2.75; p > 0.05; Breusch Pagan Test
LM = 0.79; p > 0.05), and with residual normality (Chi Squared = 5.62; p > 0.05).
Finally, the third regression analysis is also micro-macro, in which the explanatory variables are the estimates of marketing activities on the micro level (aggregated score), and with a macro level covariate (monthly cost of products). he focus is on identifying whether the marketing activities can be good predictors of returns on sales (proitability) on the company’s monthly level, controlling the efect of costs of products. Equation 3 illustrates the tested relationship.
Equation 3
Where, t = 1,2,3..., x.
Due to the Durbin-Watson Test inding autocorrelation problems (0.55), time series regression was chosen. his regression made it possible to discover possible dynamic efects of the marketing activities implemented by the micro-enterprise on proitability.
he explained variable (returns on sales) did not present normal distribution (Kolmogorov-Smirnov = 0.45; p < 0.01), requiring it to be transformed into a logarithm. Moreover, the two explanatory variables were transformed into logarithms to illustrate changes in elasticity and to standardize the interpretation. he relationship of the explanatory with the explained one is linear (LM = 3.59; p > 0.05), with adequate speciication (F = 1.85; p > 0.05), without multicollinearity (VIF < 2), without heteroscedasticity (White Test LM = 3.36; p > 0.05; Breusch Pagan Test LM = 1.67; p > 0.05), and with residual normality (Chi Squared = 5.98; p > 0.05). However, there is a unit root both in the explained variable and in the explanatory variables (Augmented Dickey-Fuller Test with constant and tendency p > 0.05), requiring the irst diference for each variable to
be generated aiming to eliminate non-stationarity efects.
5
Results
Initially, the result of the micro-micro analysis is revealed (products daily panel data), in which the explained variable is the sales of each product and the explanatory variables are each marketing activity implemented by the company daily. Subsequently, the irst result of the micro-macro relationship is shown: the efectiveness of the monthly estimate of marketing activities in terms of the retail micro-business’ revenue. his section ends by demonstrating the second micro-macro relationship: the efectiveness of the monthly estimate of marketing activities in terms of the retail micro-business’ proitability, comparing with the efect of costs of products.
5.1
he efect of marketing activities on
a company’s daily product sales
of each product; however, some of them had a tenuous efect (see Table 2). All in all, they presented good explained variance both between products (R2 = 80.58%) and within product (R2
= 80.26%) over the 790 consecutive days. Product price was the main inluencer of sales (B = 0.853; p < 0.01). As both variables are in natural logarithms, there is price-sales elasticity. Increasing company product price by 1% generates a 0.85% increase in product sales revenue. In other words, in general, prices practiced tend to be inelastic in terms of sales.
Altering the store ambience (altering the storefront, floor, internal and external
identiication) generates the second biggest efect on sales (0.137% increase). he period in which the assortment of a high rotation product (nail varnish) was increased generated the third biggest efect on sales (0.070% increase), followed by the percentage of payments carried out via credit (0.048% increase). he promotional period for respiratory tract drugs generated an increase of 0.021%, the promotional period for cosmetics generated a 0.016% increase, and inally, the increase in sales commission for products sold in the store generated a 0.002% increase.
Table 2
Efect of marketing activities on product sales (micro-micro)
Marketing activities Estimate of ixed
efect
Standard Error
95% Conidence Interval
Low High
Intercept -2.01* 0.01 -2.03 -2.00
Product price (in log) 0.853* 0.00 0.85 0.86
Sales commission 0.002* 0.00 0.00 0.00
% of payment on credit 0.048* 0.01 0.04 0.06
Store ambience (after change)a 0.137* 0.01 0.12 0.14 Promotional period (sun block, bronzer, sunscreen and
moisturizer) 0.016* 0.01 0.01 0.03
Promotional period (respiratory tract drugs) 0.021* 0.01 0.01 0.03 Increased period assortment (nail varnishes) 0.070* 0.01 0.05 0.09
R2 Between 80.58%
R2 Within 80.26%
BIC (reference – only constant = 128,782.80) 53,610.80 a: in relation to the period before changing the store ambience
* p ≤ 0.01
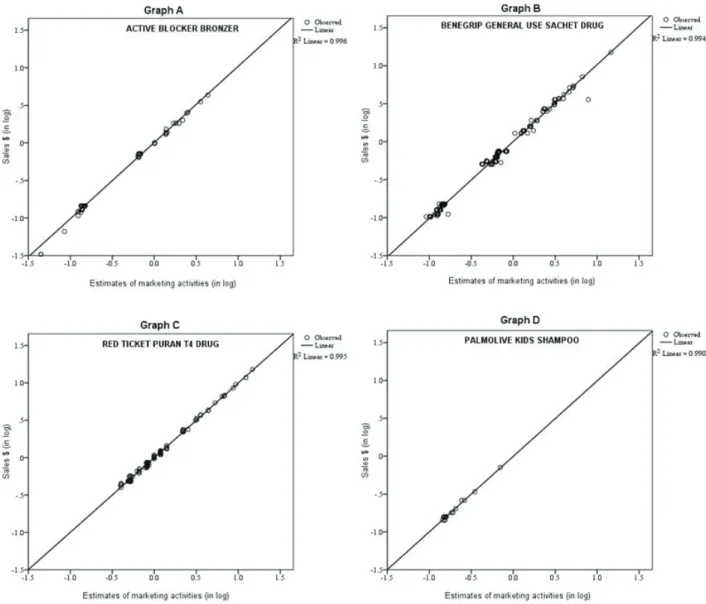
Examples of the efect of these activities taken altogether over sales can be seen in Figure 2. Both axes are in logarithms (log-log model), which enables the elasticity of the entire group of marketing activities (horizontal axis) in terms of sales (vertical axis) to be discovered.
In Graph A, the efect of the marketing activities over sales of the Active Bloc cosmetic bronzer can be perceived. his is also the case in Graph B for Benegrip general use sachet drugs, in Graph C for Puran T4 red label drug, and in
Graph D for Palmolive kids soap hygiene product. All have a high R2, showing that the line adjusts
well to the data.
Figure 2. Example of graphs showing the efect of marketing activities on product sales.
Source: Database
5.2
Effect of monthly estimates of
marketing activities on revenue
By aggregating the estimates of the marketing activities monthly, they also generate efects on aggregated sales (revenue) per month. A one point increase in the monthly estimate generates an increase of 5.12 times in monthly revenue (Table 3). he model in monthly time series presented optimal adjustment (R2 stationary
= 95.80%), which means that, dynamically, the
Table 3
Efect of estimates of marketing activities on company revenue (micro-macro)
EV: Monthly revenue
Estimate Standard Error
Constant 20,987.80* 1,488.99
Monthly company marketing activities (in log) 5.12* 0,50
R2 Stationary 95.80%
Bic Normalized 13.92
Ljung-Box Q (18) 19.74 (p > 0.05)
* p ≤ 0.01
Graph E (Figure 3) illustrates the dynamics of the relationship between the variables. Almost perfect adjustment of the estimates to monthly
net revenue is observed. herefore, marketing activities generate a positive efect on the revenue on the retail of the micro company’s sales.
Figure 3. Graph of temporal relationship (months) between aggregated marketing activity estimates
and revenue
Source: Database
5.3
Efect of monthly marketing activities
estimates on proitability, controlling the
cost of products
To analyze the efectiveness of marketing activities in terms of proitability (returns on sales) in a more precise way, the cost of products was controlled and a stationary model with time series
was also used, involving the irst diference both for the explained variable and for the explanatory variables. Additionally, all the variables were transformed into logarithms, illustrating changes in percentage points.
4). A 1% increase generates a 1.64% increase in returns on sales. However, a 1% increase in cost of products generates a 2.34% reduction in proitability. hus, if the retail micro-business increases the costs of products, it needs to increase its marketing activities more than proportionally in order to compensate for the increase in costs.
herefore, despite the efectiveness of the marketing activities in terms of net accounting proit, they are not enough to cover the costs of products in this micro-enterprise. Both explanatory variables present an immediate efect on sales returns in the current month and lasts only during that same month.
Table 4
Efect of marketing activity estimates and costs of products on proitability (micro-macro)
EV: Proitability (in log)
Estimate Standard Error
Monthly company marketing activities (log and diference 1) 1.64* 0.30 Cost of products and merchandise (log and diference 1) -2.34* 0.40
R2 Stationary 89.40%
Bic Normalized -5.18
Ljung-Box Q (18) 23.29 (p > 0.05)
* p ≤ 0.01
With an explained stationary variance of 89.40%, both explanatory variables can be used to predict returns on sales.
Figure 4. Graph showing temporal relationship (months) between marketing activity estimates, costs of
products and proitability
6
Discussion
he present paper demonstrates that the marketing activities generate a dynamic efect both on product sales and company net revenue and proitability. his shows that if the micro-enterprise maintains its operations over time, it is because the marketing activities carried out generate a minimally positive efect on product sales. Activities that are typically carried out by small enterprises (Newman & Cullen, 2002; Runyan & Droge, 2008) focus on the day-to-day business. his study investigated the approach for the micro-micro level of analysis – product sales, supporting Hypothesis 1. It bears mentioning that unlike studies that list the costs of marketing activities (Ward, 2013), this study found results of this relationship by comparing the incidence and/or execution of an activity itself, and is thus more useful for commercial decisions (Leelang et al., 2015).
At the same time, these marketing activities, in an aggregated way, dynamically alter the inancial consequence for the company by positively afecting revenue, and, also proit. his supports Hypotheses 2 and 3, respectively. hus, aggregation of the data on a product level to a company level does not need to obey the product purchase cycle (Hanssens et al. 2003), but, otherwise, be adapted for decision making [decisions regarding cash flow (Hanssens & Dekimpe, 2008)].
Particularly within the micro-micro relationship, the price of sales, alterations in store ambience and increases in product assortment are, respectively, the marketing activities that most generate efects over the sales of each product in a dynamic way. his inding is not new in the literature. Price-elasticity has traditionally been shown to be one of the biggest inluencers of sales (Bijmolt et al., 2005), especially products sold in retail (Klapper & Zenetti, 2012). Store ambience and product brands assortment have also been evaluated recently as sales inluencers or performance indicators derived from product level
sales (Mishra et al., 2014; Morgado & Benito, 2015; Porto & Oliveira-Castro, 2015; Porto & Silva, 2014; Shields, 2006). herefore, the result from the micro-micro relationship only proves that the marketing activities carried out by micro-businesses also generate efects over sales, just as those carried out by large companies do.
It bears mentioning that payment by credit card, promotional materials, and commission given to sales assistants also generate a positive efect on product brand sales, but in a much less impactful way than alterations in price, product assortment and store ambience. Although the study did not test long term efects, this result corroborates with studies that have found that product, place, and price generate bigger efects than promotional actions (Ataman et al., 2010). Considering the results regarding diferent levels of analysis (micro-macro), the aggregated estimate of total marketing activities on the micro level predicts company revenue and proitability on a monthly basis (macro level). hus, a micro level variable has quite a dynamic inluence over a macro level variable. his ofers an approach for addressing how to make studies between levels with the micro-macro combination, using real market data (Croon & Van Veldhoven, 2007) in order to test the efectiveness of company behavior, even in micro-enterprises.
hus, using an aggregated score to capture the micro level efects on the aggregated level, contributes empirically to testing the predictive power of marketing activities conceived by means of their execution (instead of only by means of their costs – Raman et al., 2012) in relation to company inancial performance. he method used here implies gathering secondary data (inancial
which is the focus of this analysis. his study used an aggregation of estimates (latent scores) of the micro level explanatory variable to relate it with the macro level explained variables. his method appeared to adjust well to the data used.
he negative efect of the cost of physical resources over proitability supports Hypothesis 4. Cost was stronger than marketing activities. hus, if the irm’s current behaviors regarding marketing are proportionally increased in relation to the cost of products, the company business will not be sustainable. he company would therefore not be eicient (Guissoni & Neves, 2013). For this to happen, it would need to increase the execution of its activities by approximately 30% to reach the level of inluence of increasing cost. herefore, if the micro-business studied executes the same intensity of marketing activities as the costs of products, the former would not be enough to cover the latter.
7
Conclusion
his paper demonstrated the efectiveness of marketing activities in dynamically generated products sales, revenue and proitability in a microenterprise. All the four hypotheses in the paper were confirmed. This showed that analytical techniques of Market Response Model (Hanssens et al., 2003) can also be used to identify the Marketing Productivity Chain (Rust et al., 2004) in micro-enterprises, providing explanations regarding inancial performance. It also demonstrated that the relationships between diferent levels of analysis, speciically micro-macro, can be useful for forecasting the revenue and proitability of companies.
hus, owners and managers of for-proit micro-businesses can evaluate the efectiveness of the marketing activities they carry out in a dynamic and pragmatic way for corrective decision making. Moreover, it is possible to compare this efectiveness with the costs of selling products to discover whether these activities are also eicient. his study contributes methodologically in terms of the way it carries out this test.
he results can be generalized for any company that carries out marketing for supplier products and that aims to increase revenue and proitability without, however, being concerned with long term efects of marketing actions. his situation typically occurs in micro-enterprises in stationary markets. Nevertheless, the sample limitation on the macro level could lead to problems in generalizing the indings. Moreover, micro-enterprises can plan and execute other marketing activities besides those that were investigated here.
In general terms, the statistical techniques used in this study investigated the linear dynamics of the relationship between marketing and inance; yet, there may be nonlinear efects and/or non-recursive efects and/or evolutionary efects that are not investigated here. Future research could address these relationships, providing further details regarding the efect of marketing on company inancial performance.
Note:
1 his research received inancial support from the Brazilian
National Council for Scientific and Technological Development (Conselho Nacional de Desenvolvimento Cientíico e Tecnológico/CNPq).
References
Akroush, M. N. (2011). he mediation efect of marketing expertise on marketing assets and capabilities toward inancial performance.
International Journal of Internet Marketing and Advertising, 6(4), 373-412.
Asgarnezhad Nouri, B., Sanayei, A., Fathi, S., & Kazemi, A. (2015). The effect of marketing tactical capabilities on the inancial performance of the firms: Meta-analysis approach. Iranian Journal of Management Studies, 8(1), 73-96.
Bijmolt, T. H., Heerde, H. J. V., & Pieters, R. G. (2005). New empirical generalizations on the determinants of price elasticity. Journal of Marketing Research, 42(2), 141-156.
Boyd, E., Farris, P., & Hildebrandt, L. (2004). PIMS and COMPUSTAT data: Diferent horse for the same course. In: P. Farris & M. Moore (Eds.), he Proit Impact of Marketing Strategy Project: Retrospect and Prospect (pp. 41-72). Cambridge: Cambridge University Press.
Braghin, F., Higashibara, L. G. I., de Freitas, M. F., Catuchi, Y. A., & Mancini, R. (2008). Marketing de varejo: O ambiente das farmácias independentes sob o ponto de vista de seus gestores. Trabalho de Conclusão de Curso, Faculdade de Ciências Econômicas e Administrativas de Presidente Prudente, Presidente Prudente, Brasil.
Brooks, N., & Simkin, L. (2011). Measuring marketing effectiveness: An agenda for SMEs. he Marketing Review, 11(1), 3-24.
Coelho, R. L. F., de Miranda, J. R., Camargo Filho, A., Freitag, M. S. B., & de Almeida, M. I. S. (2015). Gestão do marketing em micro e pequenas empresas. Revista de Empreendedorismo e Gestão de Pequenas Empresas, 4(2), 219-250.
Conselho Federal de Farmácia, CFF. (2008). Marketing em farmácias e drogarias.
Planejamento Estratégico Empresarial, 1(8),
1-4.
Cozby, P. C. (2006). Métodos de pesquisa em ciências do comportamento. São Paulo: Atlas.
Croon, M. A., & Van Veldhoven, M. J. (2007). Predicting group-level outcome variables from variables measured at the individual level: A latent variable multilevel model.
Psychological Methods, 12(1), 45-57.
Feng, H., Morgan, N. A., & Rego, L. L. (2015). Marketing department power and firm performance. Journal of Marketing, 79(5), 1-20.
Finkelstein, S., & Peteraf, M. A. (2007). Managerial activities: A missing link in managerial discretion theory. Strategic Organization, 5(3), 237-248.
Floriani, D. E., & Fleury, M. T. (2012). O efeito do grau de internacionalização nas competências internacionais e no desempenho inanceiro da PME brasileira. Revista de Administração Contemporânea, 16(3), 438-458.
Grewal, D., Levy, M., & Kumar, V. (2009). Customer experience management in retailing: An organizing framework. Journal of Retailing, 85(1), 1-14.
Guia das Farmácias (2014). O que fazer diante tantos produtos? Guia das Farmácias. Produtos para Saúde Correlatos, 21(260), 12-14.
Guissoni, L. A., & Neves, M. F. (2013). Ensaio sobre a análise de desempenho em marketing e aplicação de métricas. Revista Brasileira de Marketing, 12(4), 201-229.
Hankinson, A. (1991), Small business: Management and performance. London: Avebury.
Hansen, G. S., & Wernerfelt, B. (1989). Determinants of firm performance: The relative importance of economic and organizational factors. Strategic Management Journal, 10(5), 399-411.
Hanssens, D. M., & Dekimpe, M. G. (2008). Models for the financial-performance efects of marketing. In: B. Wierenga (Ed.),
Handbook of Marketing Decision Models (pp.
501-523). New York: Springer.
and time series analysis (Vol. 12). Norwell: Kluwer Academic Publishers.
Hill, J. (2001). A multidimensional study of the key determinants of effective SME marketing activity. International Journal of Entrepreneurial Behavior & Research, 7(5), 171-204.
Hitt, M. A., Beamish, P. W., Jackson, S. E., & Mathieu, J. E. (2007). Building theoretical and empirical bridges across levels: Multilevel research in management. Academy of Management Journal, 50(6), 1385-1399.
Irvine, P. J., & Pontif, J. (2009). Idiosyncratic return volatility, cash lows, and product market competition. Review of Financial Studies, 22(3), 1149-1177.
Isaeva, T. N., Saiullin, L. N., Bagautdinova, N. G., & Shaidullin, R. N. (2013). Aspects of a multilevel study of competitive performance of objects and subjects of economic management. World Applied Sciences Journal,
27(13), 116-119.
Jandaghi, G., Amiri, A. N., Amini, A., & Darani, M. (2011). Assessment and ranking the efects of marketing mix on lower and plant sale volume. International Journal of Academic Research in Business and Social Sciences, 1(3), 207-219.
Klapper, D., & Zenetti, G. (2012). Combining micro and macro data to study retailer pricing in the presence of state dependence. In: A. Diamantopoulos, W, Fritz, & L. Hildebrandt (Eds.), Quantitative Marketing and Marketing Management (pp. 379-400). Wiesbaden:
Springer.
Kosan, L. (2014). Accounting for marketing: Marketing performance through inancial results. International Review of Management and Marketing, 4(4), 276-283.
Leelang, P. S., Wieringa, J. E., Bijmolt, T. H., & Pauwels, K. H. (2015). Building models for markets. New York: Springer.
Lima, M.I.C., & Porto, R.B. (2012). Efeito prolongado das estratégias de comunicação de marketing e dos indicadores setoriais no faturamento de bares. Revista Brasileira de Marketing, 11(3), 53-74.
Maas, C. J., & Hox, J. J. (2005). Suicient sample sizes for multilevel modeling. Methodology,
1(3), 86-92.
Mayntz, R. (2004). Mechanisms in the analysis of social macro-phenomena. Philosophy of the Social Sciences, 34(2), 237-259.
McCartan-Quinn, D., & Carson, D. (2003). Issues which impact upon marketing in the small irm. Small Business Economics, 21(2), 201-213.
McDonald, M., Mouncey, P., & Maklan, S. (2014). Marketing value metrics: A new metrics model to measure marketing effectiveness. London: Kogan Page Publishers.
Mintz, O., & Currim, I. S. (2013). What drives managerial use of marketing and inancial metrics and does metric use afect performance of marketing-mix activities?
Journal of Marketing, 77(2), 17-40.
Mishra, H. G., Sinha, P. K., & Koul, S. (2014). Impact of store atmospherics on customer behavior: Inluence of response moderators.
Journal of Business and Management, 20(1), 45-66.
Mizik, N. (2014). Assessing the total inancial performance impact of brand equity with limited time-series data. Journal of Marketing Research, 51(6), 691-706.
para as micro e pequenas empresas. Revista da Micro e Pequena Empresa, 5(2), 38-59.
Morgado, Á. G., & Benito, Ó. G. (2015). Merchandising at the point of sale: Diferential efect of end of aisle and island.
Business Research Quarterly, 18(1), 57-67.
Morgan, N.A. (2012). Marketing and business performance. Journal of Academy of Marketing Science, 40(1), 102-119.
Newman, A. J., & Cullen, P. (2002). Retailing: Environment & operations. London: Cengage
Learning EMEA.
Nicolau, I. (2013). he evolution of the marketing concept. Knowledge Horizons-Economics,
5(3), 154-156.
Oliveira Filho, J. B. D. (2013). O mercado farmacêutico de varejo no Distrito Federal do Brasil de 2000 a 2012. Dissertação de mestrado. Universidade de Brasília, Brasília, Brasil.
Porto, R. B., & Oliveira-Castro, J. M. (2015). Consumer purchase and brand performance. In: G. Foxall (Ed.), he Routledge companion to consumer behavior analysis, (pp. 175 – 201). New York: Routledge.
Porto, R. B., & Silva, A. T. V. (2014). Efeitos da preciicação, da diferenciação e da oferta de valor no desempenho de marcas em contextos competitivos. Revista de Administração, 49(1), 103-115.
Raman, K., Mantrala, M. K., Sridhar, S., & Tang, Y. E. (2012). Optimal resource allocation with time-varying marketing efectiveness, margins and costs. Journal of Interactive Marketing, 26(1), 43-52.
Roberts, J. H., Kayande, U., & Stermersch, S. (2013). From academic research to marketing practice: Exploring the marketing science
value chain. International Journal of Research in Marketing, 31(2), 127-140.
Runyan, R. C., & Droge, C. (2008). A categorization of small retailer research streams: What does it portend for future research?. Journal of Retailing, 84(1), 77-94.
Rust, R.T., Ambler, T., Carpenter, G.S., Kumar, V., & Srivastava, R.K. (2004). Measuring marketing productivity: Current knowledge and future directions. Journal of Marketing, 68(4) 76–89.
Sarquis, A. B., Cittadin, J., de Morais, A. S. A., Tondolo, R. D. R. P., & Santos, E. (2016). O estado da arte do tema marketing para pequenas empresas: Um estudo bibliométrico da produção científica nacional. Revista Brasileira de Gestão e Inovação,3(3), 109-134.
Serviço Brasileiro de Apoio às Micro e Pequenas Empresas, Sebrae (2015). Anuário do trabalho na micro e pequena empresa: 2015.
Departamento Intersindical de Estatística e Estudos Socioeconômicos. Brasília: Sebrae.
Shields, J. (2006). Effects of atmospherics on revenue generation in small business restaurants. Jour nal of Business and Entrepreneurship, 18(2), 79-87.
Siddhanta, S., & Banerjee, N. (2014). he impact of promotional mix on proit in the B2B sector. Marketing Intelligence & Planning, 32(5), 600-615.
Srivastava, R. K., Shervani, T. A., & Fahey, L. (1998). Market-based assets and shareholder value: A framework for analysis. he Journal of Marketing, 62(1), 2-18.
Stock, J. H., & Watson, M. W. Econometria. São
Paulo: Pearson Education Brasil, 2004.
Complementary Law No 123, from December 14th 2006, and give other arrangements.
Brasília. Recovered on December 26, 2016, from http://www.planalto.gov.br/ccivil_03/ leis/LCP/Lcp139.htm#art5
Vorhies, D. W., Orr, L. M., & Bush, V. D. (2011). Improving customer-focused marketing capabilities and irm inancial performance via marketing exploration and exploitation.
Journal of the Academy of Marketing Science,
39(5), 736-756.
Ward, K. (2013). Financial aspects of marketing. New York: Routledge.
Wieseke, J., Lee, N., Broderick, A. J., Dawson, J. F., & Van Dick, R. (2008). Multilevel analysis in marketing research: Differentiating analytical outcomes. Journal of Marketing heory and Practice, 16(4), 321-340.
Wilkie, W. L., & Moore, E. S. (2007). What does the definition of marketing tell us about ourselves? Journal of Public Policy & Marketing, 26(2), 269-276.
Zait, L. (2009). The process of marketing management–between the management marketing activities and the operational marketing. Studies and Scientiic Researches. Economics Edition, 14, 129-136.
Supporting agencies:
CNPq: 484425/2013-7
About the authors:
1. Rafael Barreiros Porto, PhD in Behavior Science, University of Brasilia, Postgraduate Program in
Administration, Brasília, Brazil. Email: [email protected]
2. Rafaela da Rocha Costa, Bachelor in Administration, University of Brasília, Faculty of Economics,
Administration, Accounting and Public Policy Management, Brasília, Brazil. Email: [email protected]
3. Eluiza Alberto de Morais Watanabe, PhD in Business Management, University of Brasília, Faculty of
Economics, Administration, Accounting and
Public Policy Management, Brasília, Brazil. Email: [email protected]
Contribution of each author:
Contribution Rafael Porto Rafaela Costa Eluiza Watanabe
1. Deinition of research problem √ √
2. Development of hypotheses or research questions
(empirical studies) √ √
3. Development of theoretical propositions (theoretical Work) √ √
4. heoretical foundation/Literature review √ √
5. Deinition of methodological procedures √ √
6. Data collection √
7. Statistical analysis √
8. Analysis and interpretation of data √
9. Critical revision of the manuscript √ √