REVISTA BRASILEIRA DE GESTÃO DE NEGÓCIOS ISSN 1806-4892 REVIEw Of BuSINESS MANAGEMENT e-ISSN 1983-0807 © FECAP
RBGN
520
Review of Business Management
DOI: 10.7819/rbgn.v0i0.2436
Received on 07/11/2016 Approved on 04/24/2017
Responsible editor:
Prof. Dr. Guilherme Shiraishi
Evaluation process:
Double Blind Review
The impact of store satisfaction on consumer
responses in out-of-stock situations
Aleksandar Grubor
Nikola Milicevic
Nenad Djokic
University of Novi Sad, Faculty of Economics in Subotica, Department of Trade, Marketing and Logistics,
Subotica, Republic of Serbia
Abstract
Purpose – he purpose of this paper is to test a conceptual model by means of which we try to establish the inluence of store satisfaction and other variables (gender, mobility and availability of alternative stores) on consumers’ responses to out-of-stock (OOS) situations.
Design/methodology/approach – he authors used a standardized questionnaire to gather data on consumer responses to OOS and then analyzed determinants including store satisfaction (for which reliability, validity and unidimensionality were tested). he survey was conducted in the four largest cities in Serbia. All respondents were interviewed randomly, through telephone calls, whereby 392 responses were gathered. he established hypotheses were tested by means of a multinomial logit model with the use of marginal efects.
Findings – he results show that store satisfaction signiicantly afects three out-of-stock responses (store switching, postponement and product switching), whereas, positively in the case of product switching and postponement and negatively in the case of store switching. he results also show that store satisied consumers, regardless of other factors, are not likely to switch stores in out-of-stock situations.
Originality/value – As well as managerial implications, this paper included store satisfaction as an antecedent of consumer OOS responses for the irst time. In addition, the impact of this variable on OOS responses was analyzed at both levels of the availability of alternative stores, gender and mobility.
1
Introduction
Forming and carrying inventories basically results from the wish to ensure the continuity of a company’s business operations, in order to secure protection against disruption to supplies, or price volatility, and appropriately meet demands (Blinder & Maccini, 1991). Bearing in mind that inventories are a substantial part of business assets both in trade and in manufacturing companies, they account for comparatively high inancial assessments. According to the report by the World Bank (2010), inventory costs make up 2.1% of the United States’ GDP and up to 5% of Brazilian GDP.
However, as well as the costs caused by the “existence” of inventories, most companies, especially retailers, often confront them with those related to out-of-stock situations. When a consumer cannot ind a desired product in the store, both the retailer and the supplier can sufer certain consequences. hereby, almost any consumer OOS response may produce adverse effects. According to Roland Berger Strategy Consultants (2003), because 9% of consumers who face an out-of-stock situation cancel their purchases, retailers and manufacturers lose over 4 billion Euros every year. In addition to cancellation, other responses related to brand switching or item switching (i.e. purchasing cheaper ones) as well as store switching, can also relect negatively through a reduction in sales (Ehrenthal, Gruen, & Hofstetter, 2014). Overall sales losses caused by out-of-stock amount to 3.9% at the global level, 3.8% in the United States, and 3.7% in Europe (Gruen, Corsten, & Bharadwaj, 2002). his percentage is even higher in other regions, including South America. Sale losses due to stock-outs in Colombia are estimated at 5.3% of total sales (Barajas, 2004). According to the Brazilian association of supermarkets (Abras), the OOS problem is responsible for 42% of all sale losses in the retail sector (ECR Brasil, 2004). In this regard, the study of ECR Brasil (2007) has shown that 37% of consumers who would
substitute the store in the case of out-of-stock cost an average Brazilian supermarket R$ 265,375.00 in lost sales. On the other hand, in Argentina, sale losses due to this problem amounted to 502 million pesos (R$ 496 million) in 2003 (Oliveira, 2004).
In addition to direct sales losses, an OOS situation can cause indirect negative efects as well (Gruen et al., 2002; Ehrenthal et al., 2014). Higher inventory holding costs, inaccurate information exchange and sales planning are just some of them. However, to retailers, one of the biggest issues is related to a decrease in store loyalty (Ehrenthal & Stolzle, 2013), which can have long term consequences on business performance. Even though the consumer switching rate is still undocumented, the annual cost of permanent shopper loss to competitors is estimated at US $1 million per every 200 shoppers (Gruen & Corsten, 2007).
Due to considerable costs caused by out-of-stock situations in retail stores and neglecting these by retailers (Institute of Grocery Distribution, 2007), this article presents the fundamental characteristics of this problem. Bearing in mind that OOS effects primarily depend on consumer response, special attention was given to its contributing factors. Having analyzed the results of previous studies, we established a conceptual model with emphasis on store satisfaction as a store-related antecedent. As this variable was proven to be one of the key determinants of consumer purchase behavior (Seiders, Voss, Grewal, & Godfrey, 2005), it was examined in the context of OOS responses in this paper. After interpreting the results, some guidelines for retailers as to mitigating the negative consequences of OOS situations are presented.
2
Deining out-of-stock situations
Aleksandar Grubor / Nikola Milicevic / Nenad Djokic
deined as a situation in which demand is not met and the order is cancelled. To them, OOS difers from a backorder, a situation in which the order is held and fulilled later, after the replenishment cycle is over and inventories for the item are available again.
Roland Berger Strategy Consultants (2003) ofered a much more complex explanation for OOS. hey presented three diferent forms of OOS: classical, dual placement and delisting out-of-stocks. Classical OOS means that the item is not available on the labelled shelf-place. Dual placement OOS occurs when the item can be found on the shelf but not on the other placement site (for example, a special place in the case of promotion) and vice versa. Delisting OOS appears when consumers cannot reach the desired item because it was taken by store staf.
Holman and Buzek (2008) had a similar approach to deining out-of-stocks. According to them, there are ive speciic OOS types, all representing the situation wherein a consumer who enters the store to buy a speciic product leaves it without making the purchase. hese types include (Holman & Buzek, 2008):
a) empty shelf – when the consumer cannot ind the speciic product on the marked shelf space;
b) stock present, but no help available – when the consumer can see the product, but cannot reach it (because it is locked or placed on a high shelf ), while there is no store staf help available;
c) stock present, but no access – in this case the consumer inds store staf to help, but they cannot get the product either (for instance, they do not have access to the location where the product is stocked); d) promo price mismatch – the consumer
does not make the purchase because the price/ofer in the store does not match that advertised;
e) any other reason (except lower expenses and the four reasons above) because of which the consumer decides to leave the store and not buy the desired product.
To Bayle-Tourtoulou, Laurent and Macé (2006), classical OOS deinitions are too myopic from the sellers’ perspective, because they do not cover the economic side of stock-outs. According to these authors, efective deinition of OOS should include elements such as OOS frequency, duration, occurrence at a time of low or high store traic, or importance of the item in the category. hereby, a long stock-out of a major item during a rush hour should be much more important to a retailer then a brief OOS for a minor item at a slow hour, during which no sales are lost (Bayle-Tourtoulou et al., 2006).
In this context, Gruen and Corsten (2007, p.1) have identiied two fundamental concepts: OOS event and OOS attributes. While the former refers to “what an out-of-stock is”, the latter is related to aspects of its description and calculation as an out-of-stock rate, such as number of occurrences over time, number of simultaneous occurrences, duration, lost sales etc. In addition to these concepts, Gruen and Corsten (2007) distinguished three OOS measuring methods:
a) manual auditing method; b) POS sales estimation; and c) perpetual inventory aggregation.
In the irst, direct approach, store auditors visits stores over particular time periods in order to ind shelf gaps (Roland Berger Strategy Consultants, 2003). heir main task is to identify out-of-stocks and measure availability of reference items by physical counting. According to Fernie and Grant (2008), third-party service providers can be engaged to carry out in-store OOS checks for these operations.
the major limitations of this method refers to diiculties in the application for SKUs that sell slowly (Gruen & Corsten, 2007).
Opposite to the first two, the third “PI” measurement method based on the use of Perpetual Inventory data (when sales = 0, the item is OOS) usually applies only for store out-of-stocks (when the item is not physically available in the store) in lower volume store formats (Gruen & Corsten, 2007). Because of these reasons and its low accuracy, this method should be combined with the manual approach.
In spite of the fact that methods based on POS data are developing and attracting the attention of retailers and researchers (Hausruckinger, 2006; Milicevic & Grubor, 2015; Papakiriakopoulos & Doukidis, 2011), in most OOS studies the out-of-stock rate was measured through manual auditing (Gruen & Corsten, 2007). According to Gruen et al. (2002), the average worldwide OOS rate is estimated at 8.3%, a bit higher than the average US (7.9%) and a bit lower than the average European out-of-stock rate (8.6%). Compared to these rates, the situation is much better in Asia-Paciic and Australia/NZ regions, where the average out-of-stock levels are 5% and 4.4% (ECR AP, 2012). On the other hand, higher OOS rates are recorded in South America. According to Ribeiro (2008), in Argentina and Chile, the average OOS rate amounts to 17.15% and 14.3%, respectively. Its level is lower in Colombia, where Barajas (2004) recorded the average stock-out rate of 9.2%. In Brazil, the results of the study conducted in 2004 by ECR Association Brazil in partnership with the Brazilian Association of Supermarkets (Abras) and ACNielsen, revealed an average out-of-stock rate of 8% (ECR Brasil, 2005). Later measurements have shown that this value hasn’t changed a lot, whereby Vasconcellos and Sampaio
(2009) reported that it was 8.3%, while Catuogno (2013) stated that the average OOS rate in Brazil amounted to 7.8%.
Besides countries and regions, out-of-stock levels difer among product categories as well. hereby, in Europe, OOS rate for product categories like fresh ready meals, confectionery and ice cream exceeds 10%, while for categories such as hair care, baby care and cosmetics, it is under 4% (Roland Berger Strategy Consultants, 2003). In Brazil, results of the research of Azevedo and Araújo (2004) pointed that bread and sugar categories had the highest OOS rates, over 10% (11.6% and 10.8% respectively), contrary to the dairy category, whose OOS rate was 6.8%.
However, according to Holman and Buzek (2008) all these out-of-stock rates are much lower than the “true OOS rate.” Partially because of the use of a more expanded deinition of out-of-stocks, these authors calculated the OOS rate of 17.8%, because of which they warned retailers, who are, according to their opinion, “in denial about out-of-stocks.”
3
Consumer responses to
out-of-stock situations
Aleksandar Grubor / Nikola Milicevic / Nenad Djokic
lower than the “true OOS rate.”
retailers, who are, according to their opinion, “in denial about out
.”
dissatisfaction, which can later have a negative effect on the retail’s business performance.
“ ”
s is “a
little frustrated” by the inability to find the desired product. In all countries, it ranges from
43 51
59 62
35 37
33 29
13 8
7 8
9 4
1 2
0% 20% 40% 60% 80% 100%
Spain Germany Great Britain France
very frustating a little frustrating not very frustrating not at all frustrating
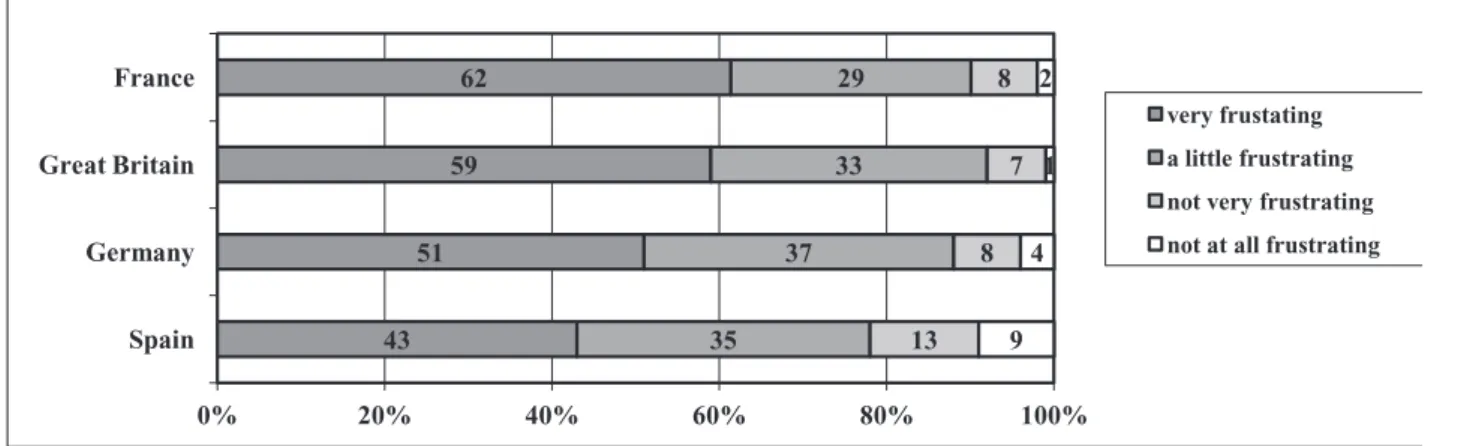
Figure 1. Consumer feelings in OOS situations.
Note.Retrieved from “On-shelf availability making-it-happen together”by K. Olofsson, 2006.
As seen in Figure 1, the largest number of consumers feels very frustrated when faced by OOS events. his percentage is highest in France, amounting to 62%, followed by 59% in Great Britain, 51% in Germany and 43% in Spain. A signiicant number of consumers is “a little frustrated” by the inability to ind the desired product. In all countries, it ranges from 29% in France to 37% in Germany. he lowest percentage accounts for consumers who do not regard stock-outs as a major problem. It does not exceed 10%, with only 1% in Great Britain. herefore, over 90% of consumers faced with the stock-out issue feel a certain degree of frustration.
If they cannot ind the desired item in a retail store, consumers may react in various ways. he irst studies of consumer responses to OOS situations appeared in the second half of the 20th
century (Peckham, 1963; Progressive Grocer, 1968). his period also saw the irst classiication of their responses, based on which consumers in stock-out situations may opt for substitution (of the item, the brand or the retail store), giving up or delaying the purchase. he basis of the SDL (Substitute, Delay or Leave) classiication was established by Walter and Grabner in 1975, analyzing the behavior of consumers faced
with stock-outs in beverage retail stores. Over the subsequent period, many authors based their researches on the above mentioned SDL responses (Campo, Gijsbrechts, & Nisol, 2000; Emmelhainz, Emmelhainz, & Stock, 1991; Schary & Christopher, 1979; Verbeke, Farris, & hurik, 1998; Zinn & Liu, 2001). In 2002, Gruen et al. (2002) presented one of the most comprehensive OOS reports (made up of 52 studies with over 71,000 respondents), analyzing ive consumer responses:
a) item switching; b) brand switching; c) store switching; d) cancellation; e) delay purchase.
Table 1
Consumer responses to OOS
Authors Regions
OOS responses
Store switching
Delay purchase
Item switching
Brand
switching Cancell.
Gruen et al. (2002) Worldwide 31% 15% 19% 26% 9%
Roland Berger Consultants (2003) Europe 21% 17% 16% 37% 9%
Azevedo & Araújo (2004) Brazil 36% - 3% 53% 8%
Sudarevic, Milicevic, Pupovac, &
Vukmirovic (2012) Serbia 21% 4% 23% 47% 5%
In EU countries, as well as in Brazil and Serbia, the majority of consumers (37%, 53% and 47%) respond to stock-outs by opting for buying another manufacturer’s product (i.e. brand substitution). A signiicant percentage of consumers faced by OOS choose store switching
as well. However, opposite to Brazil, where only 3% of consumers will switch items, in Europe this percentage is much higher, exceeding 15%. Still, if out-of-stock situations occurs repeatedly, the consumer response may change, as shown in Figure 2.
Retrieved from “
” by T. Gruen, D. Corsten, & S. Bharadwaj, 2002.
rd “disappointment”, the likelihood of brand or item substitution
7050
30 30
50
70
0% 10% 20% 30% 40% 50% 60% 70% 80% 90% 100%
1st time 2nd time 3rd time
Not buy
Sabstitute
Figure 2. Response to repetitive out-of-stocks.
Note. Retrieved from “Retail out-of-stocks a worldwide examination of extent, causes and consumer responses” by T. Gruen, D. Corsten, & S. Bharadwaj, 2002.
If an OOS situation repeats itself for the second time, the number of consumers opting for substitution of the brand or item will fall from 70% to 50%. On the other hand, the percentage of those willing to switch stores or cancel the purchase will increase from 30 to 50%. hereby, after the third “disappointment”, the likelihood of brand or item substitution will fall
Aleksandar Grubor / Nikola Milicevic / Nenad Djokic
loyal consumers, special attention should be given to factors inluencing their decisions.
4
A n t e c e d e n t s o f c o n s u m e r
response to out-of-stock situations
Consumer responses to OOS situations are inluenced by a large number of factors. Zinn and Liu (2001) grouped them into consumer, situational, demographic and perceived store characteristics. Most other studies (Campo et al., 2000; Helm, Hegenbart, & Endres, 2013; Sloot, Verhoef, & Franses, 2005; Verhoef & Sloot, 2006) included product characteristics as well, while demographic characteristics were usually lumped in consumer-related variables. hereby, according to Sloot et al. (2005), all antecedents can be classiied into four main clusters: product-related variables, store-related variables, consumer-related variables and situation-related variables. Later, Verhoef and Sloot (2006) separated brand-related variables from product-related variables.
While product-related antecedents comprise factors that are related to the speciic product category, store-related variables comprise factors that are related to store or retail-chain in which the OOS occurs (Sloot et al., 2005). According to Helm et al. (2013), product-related antecedents consist of the following factors: product involvement, buying involvement,
brand loyalty, package size, item variants, decision diiculty and acceptable alternatives. In product characteristics, Campo et al. (2000) also included deal proneness, private label purchase and product importance. On the other hand, store loyalty, number of alternative stores and store types represent store-related antecedents (Verhoef & Sloot, 2006). In addition, store satisfaction may also be considered an important store characteristic, specially when having in mind that it is one of the main predictors of store loyalty (Bridson, Evans, & Hickman, 2008). Hereby, satisfaction can generally be understood as an overall evaluation based on experience with product or service provider (Homburg, Koschate, & Hoyer, 2005), inluencing purchase intentions and behavior (Seiders et al., 2005).
Out-of-stock responses may depend on consumer-related antecedents, i.e. their psychographic and socio-demographic characteristics (Verhoef & Sloot, 2006), such as shopping attitude, shopping frequency, general time constraint, age, mobility, price consciousness and quality consciousness (Campo et al., 2000; Sloot et al., 2005). Moreover, attention should be given to certain speciics of the shopping situation, including part of the week, product usage and
Table 2
OOS study overview
Antecedent Variables Authors
Consumer responses
Item switching
Brand switching
Store
switching Delay
Product
Brand loyalty Verhoef & Sloot (2006)
-Hedonic level Sloot et al. (2005) +
Acceptable alternatives Campo et al. (2000) + + -
-Number of brands Sloot et al. (2005) - +
Brand strength Verhoef & Sloot (2006) + - +
Store Store loyalty Campo et al. (2000) + + - +
Alternative stores Sloot et al. (2005) +
-Consumer
Shopping attitude Campo et al. (2000) - - + -/+
Decision diiculty Fitzsimons (2000)
-Price consciousness Sloot et al. (2005)
-Quality consciousness Sloot et al. (2005)
-Age Verhoef & Sloot (2006) - +
Mobility Helm et al. (2013) +
Situation Part of the week Sloot et al. (2005)
-Buying urgency Verhoef & Sloot (2006) +
-In addition to the variables that afect consumer behavior in OOS situations, Campo et al. (2000) expanded their analysis with three basic cost types: substitution, opportunity and transaction costs. Substitution costs represent the potential decrease in beneits caused by poorer performance and/or higher prices of the alternative choice. Transaction costs include all the costs related to seeking and purchasing an alternative product (time- and energy- related costs), whereas opportunity costs occur due to loss of beneits when potential consumption decreases. Campo et al. (2000) related these costs to the following consumer responses: item substitution, package size switching, store switching, postponement and cancelation. hereby, when substituting an item in an OOS situation, the consumer is faced with substitution and transaction costs, which are highly product-dependent (may depend on availability of acceptable alternatives, item loyalty and decision diiculty). Similar to item switching, package switching can also incur substitution and transaction costs which primarily refer to product-related antecedents (such as package size). In
the case of store switching, substitution costs depend on the availability of acceptable alternative stores, store loyalty, shopping trip and private label purchase (as product-related variable), while the transaction costs of this response are strongly related to consumer antecedents, such as consumer mobility (Campo et al., 2000; Messinger & Narasimhan, 1997). Mobility, shopping attitude and shopping frequency as consumer-related variables can also afect the transaction costs of purchase postponement. Besides these costs, consumers who postpone or cancel the purchase can be exposed to opportunity costs as well. According to Campo et al. (2000, p. 228), “these costs are product-speciic, and/or situation-dependent.”
Aleksandar Grubor / Nikola Milicevic / Nenad Djokic
service will be less likely to opt for switching it in the case of stock-out and more likely to switch products or postpone, the following hypotheses were established:
H1: Store satisfaction negatively afects the probability of store switching.
H2: Store satisfaction positively afects the probability of product switching.
H3: Store satisfaction positively afects the probability of postponement.
As well as store satisfaction, the number of alternative stores, as a store related antecedent, has also been considered in a number of studies. While Verbeke et al. (1998) didn’t find this variable relevant, Sloot et al. (2005) pointed out that number of alternative stores had a positive efect on store switching and a negative efect on postponement. Considering this variable as dichotomous, whether there were any alternative stores located in radius of 250m (the distance is in accordance to Sloot et al. [2005]) or not, we formulated the following hypotheses:
H4: he availability of alternative stores positively affects the probability of store switching.
H5: he availability of alternative stores negatively afects the probability of product switching.
H6: The availability of alternative stores negatively afects the probability of postponement.
The subject of several out-of-stock studies was the correlation between consumer OOS responses and individual demographic variables (such as gender and age). Verhoef and Sloot (2006) established the existence of slightly signiicant correlation between age, as consumer-related antecedent, and two
out-of-stock responses (brand and store switching). Helm et al. (2013) research results have shown that mature consumers in OOS situations more often opt for item switching, delay or cancellation. On the other hand, in terms of gender, these authors did not conirm the existence of a statistically signiicant efect of this variable on out-of-stock responses. However, Dholakia (1999) pointed to certain gender diferences in shopping behavior, whereas women, contrary to men, see shopping as a pleasure. herefore, while men prefer to shop quickly with less effort, women enjoy shopping (Das, 2014) and go on more frequent shopping trips (Dholakia, 1999). According to the assumption of Campo et al. (2000), by which consumers with high shopping frequency may decide to look for OOS products elsewhere at a later point in time, we established the following hypotheses:
H7: Female consumers are more likely to switch stores in the case of out-of-stock.
H8: Female consumers are less likely to switch products in the case of out-of-stock.
In addition to gender, according to other studies (Campo et al., 2000; Helm et al., 2013) our research included mobility as the second consumer-related antecedent. According to Campo et al. (2000) consumer mobility may decrease the efort cost of shopping trip in the case of store switching and postponement. However, unlike these authors, who did not conirm the existence of a statistically signiicant relationship between these variables, Helm et al. (2013) found that car owners would rather substitute stores than cancel their purchases in the case of out-of-stock. Deining consumer mobility as having a car to drive to the store, we developed the hypotheses:
H9: Consumer mobility negatively afects the probability of purchase cancellation.
H11: Consumer mobility positively afects the probability of postponement.
While, referring to hypothesis H9, it’s not likely that consumers who use cars as
transportation to stores would cancel their purchases, the last two hypotheses (H10 and H11) imply that these consumers are more likely to switch stores and postpone their purchase in the case of out-of-stock.
Store satisfaction
Store switch
Product switch
Postponement Consumer
responses
Cancellation
Mobility Gender Alternative
stores
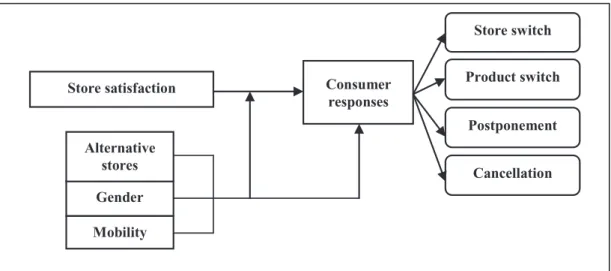
Figure 3. Conceptual model
Furthermore, besides testing the hypotheses, we have also paid attention to the interactions of these variables. In conceptual model presented in Figure 3, the emphasis was on store satisfaction and its relationship with the availability of alternative stores, gender and mobility in the context of out-of-stock responses.
5
Research methodology
5.1
Sample
he survey was conducted in the four largest cities of the Republic of Serbia – Belgrade, Novi Sad, Niš and Kragujevac. All respondents were interviewed randomly, through telephone calls. he great majority (71%) of them were female. Having eliminated the incomplete ones, 392 responses were analyzed in 2014.
5.2
Questionnaire
he questionnaire was made up of three parts. he irst one referred to the questions about consumers’ characteristics: gender (male, female) and mobility (having a car to drive to the store or not).
The second part of the questionnaire referred to the store in which respondent usually performs his/hers purchases. Hereby, the respondents were asked about stores’ locations (in purpose of investigating the presence of alternative stores in radius of 250m). Besides, consumer satisfaction with the store was measured by using the adapted scale from the research of Patterson and Smith (2003). he scale considers satisfaction as an overall evaluation based on respondent’s experience with the store. It consists of 4 items: I am happy with my decision to buy in this store, My choice of this store was a wise one, I feel good about my decision to buy in this store, Taking everything into consideration, how do you feel about the service you received in this store. Respondents rated these items on a 7-point Likert scale.
Aleksandar Grubor / Nikola Milicevic / Nenad Djokic
the items could increase its value. he result of Kaiser-Meyer-Olkin test of 0.802 higher than 0.6 (Kaiser, 1970; 1974) and the level of signiicance of Barthlett’s sphericity test of 0.000 (Barthlett, 1954) suggested conducting exploratory factor analysis as appropriate. Maximum likelihood exploratory factor analysis (with Promax rotation) identiied one factor with Eigenvalue higher than 1 (Kaiser, 1960), which explained 67.235% of the total variance. he conirmatory factor analysis results (after correlating the residuals of two items, conducted in accordance with the recommendations of modiication) were related to recommendations of Hu and Bentler (1999) for acceptable model it and showed it as acceptable (Chi-square/df=1.212, p value for the model = 0.271, CFI = 1.000, GFI = 0.998, AGFI = 0.985, SRMR = 0.0075, RMSEA = 0.023, PCLOSE = 0.474). Consequently, all four items of scale for measuring store satisfaction remained in the questionnaire.
The third part of the questionnaire considered consumer OOS responses. Like Sloot
et al. (2005), we used a hypothetical stock-out situation. Respondents were asked to choose one potential OOS response (between product switching, store switching, postponement and cancellation). he responses referred to the store in which the respondent usually makes purchases. These responses referred to three product categories: detergents, shampoo and toothpaste. All three categories belong to the group of non-food products, with a great assortment and a varied range of brands. In addition, they also have approximately similar stock-out rates, ranging from 7% to 9% (ECR Europe, 2009).
5.3
Procedures
Following other out-of-stock researches (Campo et al., 2002; Helm et al., 2013; Sloot et al., 2005), we tested the established hypotheses by means of multinomial logit model. While dependent variable (OOS responses) was categorical, all antecedents, except store satisfaction, were dummy variables (see Table 3).
Table 3
Independent antecedents
Antecedents Concept Measure
Store satisfaction Satisfaction towards store Self-reported scale based on Patterson & Smith (2003)
Alternative stores Availability of alternative stores Dummy variable: alternative store within the radius of 250m = 1, no alternative store within the radius of 250m = 0;
Gender Gender of respondent
Dummy variable: female = 1, male = 0;
Mobility Transportation shopping mode Dummy variable: car = 1, no car = 0;
Additionally, we calculated the marginal efects of each antecedent on all consumer OOS responses, whereas we analyzed store satisfaction at both levels of all other independent variables (Williams, 2012). he statistical software used for this model was the STATA version 13.0.
6
Empirical results
square (χ2) amounts to 32.85 (df = 12, p = 0.001), which indicates that our model shows
27,8%
58,7% 8,4%
5,1%
Store switch
Product switch
Postponement
Cancellation
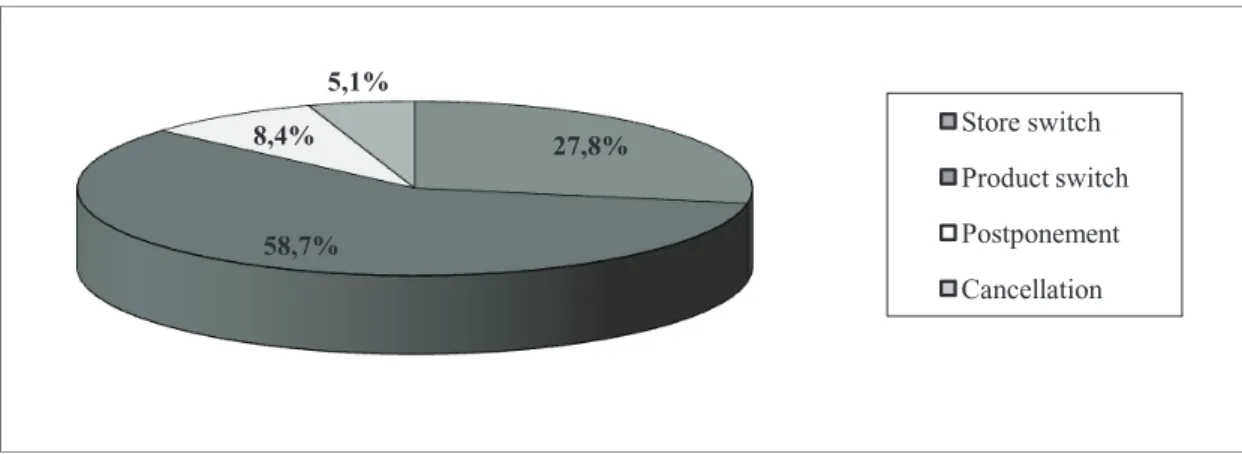
Figure 4. Out-of-stock consumer responses across three product categories.
he most frequent response was product switching (58.7%), followed by store switching, with 27.8%, and postponement, with 8.4%. he lowest response percentage was cancellation (5.1%).
In further analysis, the multinomial logit model was applied. he likelihood ratio chi-square
(χ2) amounts to 32.85 (df = 12, p = 0.001), which indicates that our model shows strong general signiicance at p<0.01.
For testing hypotheses, we calculated the marginal efects of analyzed variables. heir values are presented in Table 4.
Table 4
Marginal efects
Antecedents OOS responses
Store switching Product switching Postponement Cancellation
Store satisfaction -0.0494** 0.0373* 0.0253** -0.0132
Alternative
stores available -0.0546** 0.0440** 0.0192* -0.0086
not available -0.0430** 0.0294 0.0328* -0.0193
Gender female -0.0517
** 0.0406* 0.0260** -0.0149
male -0.0432** 0.0290 0.0234 -0.0092
Mobility car -0.0502
** 0.0284 0.0294* -0.0076
no car -0.0476** 0.0465** 0.0210** -0.0199
Alternative stores 0.1001** -0.0102 -0.0526* -0.0372
Gender 0.0901* -0.1177** 0.0006 0.0270
Mobility -0.0447 0.0609 0.0386 -0.0548**
Note. **p<0.05; *p<0.1
Store satisfaction significantly affects three out-of-stock responses (store switching and postponement at p<0.05, and product switching at p<0.1). hereby, as expected, positive efects of store satisfaction are recorded in the case of product switching (0.0373) and postponement
(0.0253) and negative efect in the case of store switching (-0.0494). hese results conirm our irst three hypotheses.
Aleksandar Grubor / Nikola Milicevic / Nenad Djokic
and signiicant negative efect on postponement (-0.0526) at p<0.1. his conirms hypotheses H4 and H6. However, although the inluence of this variable on product switching response is negative, its p value is higher than 0.1 (p=0.836), what is not in accordance to hypothesis H5.
Concerning gender, we found a signiicant positive efect on store switching (0.0901) at p<0.1, and a signiicant negative efect on product switching (-0.1177) at p<0.05, which supports hypotheses H7 and H8. Referring to this, female consumers, confronted with an out-of-stock situation, are more likely to switch stores and less likely to switch products.
In the case of mobility, signiicant negative efect was found only for cancellation response (-0.0548), in support to hypothesis H9. On the other hand, with respect to store switching and postponement, we did not ind signiicant efects for this variable. hus, hypotheses H10 and H11 are not supported.
In addition to testing hypotheses, we have calculated the efects of store satisfaction on OOS responses for diferent levels of other antecedents (the availability of alternative stores, gender and mobility). As can be seen in Table 4, negative
efects of store satisfaction on store switching are signiicant at all six levels with p<0.05. It implies that for store satisied consumers, regardless the availability of alternative stores, their gender and mobility, it’s not likely to switch stores. Contrary, positive efects of store satisfaction on postponement response occur in all cases, whereas they are all signiicant (at p<0.05 or p<0.1), except for male consumers (p=0.101). his indicates that, confronted with an out-of-stock situation, consumers are all more likely to postpone the purchase. Store satisfaction also has positive efects on product switching at all levels, but they are signiicant only for female (0.0406), consumers who don’t use the car as transportation mode (0.0465) and even in the cases when there are available alternative stores (0.0440). With respect to cancellation, despite the fact that all efects are negative, none of them is signiicant.
Furthermore, for obtaining deeper insights into the research problem, we compared possibilities of diferent OOS responses in the context of analyzed variables. Table 5 presents parameter estimates for these responses, with regard to baseline responses.
Table 5
Parameter estimates for OOS responses
Baseline responseS OOS responses
Antecedents
Store satisfaction
Alternative
stores Gender Mobility
Postponement
Store switching -0.5066** 1.0164** 0.3759 -0.6610
Product switching -0.2497 0.6168 -0.1855 -0.3749
Cancellation -0.5914** -0.0769 0.6414 -1.6173**
Store switching
Product switching 0.2568** -0.3995 -0.5615** 0.2860
Cancellation -0.0847 -1.0934** 0.2654 -0.9563*
Postponement 0.5066** -1.0164** -0.3759 0.6610
Cancellation
Store switching 0.0847 1.0934** -0.2654 0.9563*
Product switching 0.3416* 0.6938 -0.8270 1.2424**
Postponement 0.5914** 0.0769 -0.6414 1.6173**
Product switching
Store switching -0.2568** 0.3995 0.5615** -0.2860
Cancellation -0.3416* -0.6938 0.8270 -1.2424**
Postponement 0.2497 -0.6168 0.1855 0.3749
When looking at a column with the store satisfaction antecedent, we see what happens with the probability of consumer OOS responses in comparison to reference OOS response (baseline response) as their satisfaction with stores rises. For example, the negative parameter estimate of -0.5066 suggests that, as consumer satisfaction with stores rises, the probability of store switching will be signiicantly smaller in comparison to the probability of postponement. he same conclusion can be reached when it comes to the probability of cancellation in comparison to postponement. On the other hand, the positive parameter estimate of 0.2568 suggests that, as consumer satisfaction with stores rises, the probability of product switching will be signiicantly greater in comparison to the probability of store switching. he greatest implications are that more satisfied consumers will more likely switch products and postpone than switch stores or cancel the purchase.
When considering the remaining antecedents, Table 5 shows probabilities of consumer OOS responses in comparison to baseline response in cases when alternative stores are available, when consumers are female and when they use car. When alternative stores are available, consumers will rather switch stores than postpone or cancel the purchase. Female consumers will more likely switch products than stores, while consumers who use car will rather opt for other responses (postponement, store switching and product switching) than for cancellation.
7
Discussion and conclusions
Almost any consumer response to stock-out events may produce adverse effects, not only for retailers but also for manufacturers. In addition to sales loses, it can cause operational problems as well. Keeping that in mind, special attention should be given to out-of-stock situations. As consequences mostly depend on consumer responses, this article presented their antecedents.
In this article, we focused on the inluence of store satisfaction and the availability of alternative stores, and on gender and mobility as consumer-related factors on consumer out-of-stock responses (product switching, store switching, postponement and cancellation). Moreover, we investigated the relationships between store satisfaction and these responses at both levels of all other antecedents.
he results show that store satisfaction signiicantly afects three out-of-stock responses (store switching, postponement and product switching), whereas, positively in the case of product switching and postponement and negatively in the case of store switching. Concerning the second store-related variable, the availability of alternative stores positively afects the probability of store switching and negatively the probability of postponement.
With regard to gender, female consumers confronted with an out-of-stock situation are more likely to switch stores and less likely to switch products.As for mobility, consumers who use cars as a transportation mode to the store are less likely to cancel the purchase.
The results also show that, for store satisied consumers, regardless of the availability of alternative stores, gender and transportation mode, they are not likely to switch stores in the case of out-of-stocks. Confronted with such a situation, in most cases, they are more likely to switch products or postpone the purchase.
Aleksandar Grubor / Nikola Milicevic / Nenad Djokic
features), bearing in mind their positive impact on consumer satisfaction levels (Dabholkar, Shepherd & horpe, 2000; Shemwell, Yavas, & Bilgin, 1998). Other inluential factors, such as store environment (Kaltcheva & Weitz, 2006), customer involvement in the shopping process etc., should not be neglected either.
References
Azevedo, C., & Araújo, O. (2004). Causas e impactos na cadeia de abastecimento e no comportamento do consumidor. São Paulo: ACNielsen a VNU business.
Barajas, R. F. (2004). Optimizando la disponibilidad de producto para el consumidor. Colombia: IAC Colombia.
Bartlett, M. S. (1954). A note on the multiplying factors for various chi square approximations.
Journal of the Royal Statistical Society, 16(Series B), 296-298.
Bayle-Tourtoulou, A., Laurent, G., & Macé, S. (2006). Assessing the frequency and causes of out-of-stock events through store scanner data. Paris: HEC.
Blinder, A., & Maccini, L. (1991). Taking stock a critical assessment of recent research on inventories. Journal of Economic Perspectives, 5(1),
73-96.
Bridson, K., Evans, J., & Hickman, M. (2008). Assessing the relationship between loyalty program attributes, store satisfaction and store loyalty. Journal of Retailing and Consumer Services,
15(5), 364-374.
Catuogno, N. (2013, September). Sem falta.
SuperVarejo, Capa Ruptura, 36-50.
Campo, K., Gijsbrechts, E., & Nisol, P. (2000). Towards understanding consumer response to stock-outs. Journal of Retailing, 76(2), 219-242.
Dabholkar, P., Shepherd, C. D., & horpe, D. I. (2000). A comprehensive framework for service
quality: An investigation of critical conceptual and measurement issues through a longitudinal study.
Journal of Retailing, 76(2), 139-173.
Das, G. (2014). Impacts of retail brand personality and self-congruity on store loyalty: he moderating role of gender. Journal of Retailing and Consumer Services, 21(2), 130-138.
Dholakia, R. R. (1999). Going shopping: Key determinants of shopping behaviors and motivations. International Journal of Retail and Distribution Management, 27(4), 154-166.
ECR AP. (2012). On shelf availability in Asia Paciic. Asia-Paciic: Author.
ECR Brasil. (2004). Estudo vai rastrear perdas no varejo. São Paulo: Author.
ECR Brasil. (2005). Supermercados perdem 8% das vendas com falta de produtos e cliente troca de marca quando não encontra a que deseja. São
Paulo: Author.
ECR Brasil. (2007). Como resolver/atacar o problema de rupturas em sua loja - Campanha do Bilhão - 1o Fascículo. São Paulo: Author.
ECR Europe. (2009). Living and breathing on-shelf availability: How to get break-through. Barcelona: Author.
Ehrenthal, J., Gruen, T., & Hofstetter, J. (2014). Value attenuation and retail out-of-stocks, a service-dominant logic perspective. International Journal of Physical Distribution & Logistics Management, 44(1/2), 39-57.
Ehrenthal, J., & Stolzle, W. (2013). An examination of the causes for retail stockouts.
International Journal of Physical Distribution & Logistics Management, 43(1), 54-69.
Emmelhainz, M., Emmelhainz, L., & Stock, J. (1991). Consumer responses to retail stock-outs.
Ettouzani, Y., Yates, N., & Mena, C. (2012). Examining retail on shelf availability promotional impact and a call for research. International Journal of Physical Distribution & Logistics Management,
42(3), 213-243.
Fernie, J., & Grant, D. B. (2008). On-shelf availability: he case of a UK grocery retailer.
he International Journal of Logistics Management,
19(3), 293-308.
Fitzsimons, G. J. (2000). Consumer response to stockouts. Journal of Consumer Research, 27(2), 249-266.
Gruen, T., Corsten, D., & Bharadwaj, S. (2002).
Retail out-of-stocks a worldwide examination of extent, causes and consumer responses. Washington: Grocery Manufacturers of America, he Food Marketing Institute and CIES.
Gruen, T., & Corsten, D. (2007). A comprehensive guide to retail out-of- stock reduction in the fast-moving consumer goods industry. Colorado:
Grocery Manufacturers. Association.
Hausruckinger, G. (2006). Approaches to measuring on-shelf availability at the point of sale. München:
ECR Europe.
Helm, R., Hegenbart, T., & Endres, H. (2013). Explaining costumer reactions to real stockouts.
Review of Managerial Science, 7(3), 223-246.
Holman, L., & Buzek, G. (2008). What’s the deal with out-of-stocks? Franklin: IHL Group.
Homburg, C., Koschate, N., & Hoyer, W. D. (2005). Do satisied customers pay more? A study of the relationship between customer satisfaction and willingness to pay. Journal of Marketing,
69(2), 84-96.
Hu, L., & Bentler, P. M. (1999). Cutof criteria for it indexes in covariance structure analysis: Conventional criteria versus new alternatives.
Structural Equation Modeling: A Multidisciplinary Journal, 6(1), 1-55.
Institute of Grocery Distribution. (2007). ECR UK availability 2007. Radlet, UK: Author.
Jacobs, F. R., Berry, W. L., Whybark, D. C., & Vollmann, T. E. (2011). Manufacturing planning and control for supply chain management. New York: McGraw-Hill.
Kaltcheva, V. D., & Weitz, B. A. (2006). When should a retailer create an exciting store environment? Journal of Marketing, 70(1), 107-119.
Kaiser, Η, F. (1960). he application of electronic computers to factors analysis. Educational and Psychological Measurement, 20(1), 141-151.
Kaiser, Η. F. (1970). A second generation Little Jify. Psychometrika, 35(4), 401-415.
Kaiser, H. F. (1974). An index of factorial simplicity. Psychometrika, 39(1), 31-36.
Lovreta, S., Petkovic, D., Berman, B., Veljkovic, S., Crnkovic, J., & Bogetic, Z. (2010). Menadžment odnosa sa kupcima. Beograd: Datastatus.
Messinger, P. R., & Narasimhan, C. (1997). A model of retail formats based on consumers economizing on shopping time. Marketing Science, 16(1), 1-23.
Milicevic, N., & Grubor, A. (2015). he efect of backroom size on retail product availability – operational and technological solutions. he Amiteatru Economic Journal, 17(39), 661-675.
Nunnally, J. C. (1978). Psychometric theory (2nd ed.). New York: McGraw-Hill.
Oliveira, R. (2004). Falta de produtos provoca perda de 8% nas vendas. São Paulo: ECR Brasil,
Gazeta Mercantil.
Olofsson, K. (2006). On-shelf availability making-it-happen together. Stockholm: ECR Europe.
Aleksandar Grubor / Nikola Milicevic / Nenad Djokic
about products missing from the shelf. Advances in Decision Sciences, 1-13.
Patterson, P. G., & Smith, T. (2003). A cross-cultural study of switching barriers and propensity to stay with service provider. Journal of Retailing, 79(2), 107-120.
Peckham, J. (1963). he consumer speaks. Journal of Marketing, 27(4), 21-26.
Progressive Grocer. (1968, October). he out-of-stock study: Part 1 (pp. 4-5). New York: he Nielsen Company.
Ribeiro, C. M. (2008, maio). A ruptura de produtos nas gôndolas de varejos alimentícios: Um problema enfrentado por redes de varejo alimentício. Anais do Encontro de Marketing da ANPAD, Curitiba, Paraná, Brazil, 3.
Roland Berger Strategy Consultants. (2003).
ECR: Optimal shelf availability increasing shopper satisfaction at the moment of truth. Munich:
Author.
Schary, P., & Christopher, M. (1979). The anatomy of a stock-out. Journal of Retailing,
55(2), 59-67.
Seiders, K., Voss, G. B., Grewal, D., & Godfrey, A. L. (2005). Do satisied customers buy more? Examining moderating inluences in a retailing context. Journal of Marketing, 69(4), 26-43.
Shemwell, D. J., Yavas, U., & Bilgin, Z. (1998). Customer service provider relationship: An empirical test of a model of service quality, satisfaction and relationship-oriented outcome.
International Journal of Ser vice Industr y Management, 9(2), 155-168.
Sloot, L., Verhoef, P. C., & Franses, P. H. (2002).
he impact of brand and category characteristics on consumer stock-out reactions. Rotterdam: ERIM.
Sloot, L., Verhoef, P., & Franses, P. (2005). he impact of brand equity and the hedonic level
of products on consumer stock-out reactions.
Journal of Retailing, 81(1), 15-34.
Sudarevic, T., Milicevic, N., Pupovac, L. J., & Vukmirovic, G. (2012, May). Empirical evidence of customer reactions to out-of-stock situations.
Proceedings of the Cross-Cultural Conference, Steyr, Austria.
Supermarket Guru Consumer Panel. (2011).
Shoppers cite store annoyances. Woodlands:
Supermarket News.
Vasconcellos, L. H. R., & Sampaio, M. (2009). he stockouts study: An examination of the extent and the causes in the São Paulo supermarkets sector. Brazilian Administration Review, 6(3), 263-279.
Verbeke, W., Farris, P., & hurik, R. (1998). Consumer response to the preferred brand stockout situation. European Journal of Marketing,
32(11), 1008-1028.
Verhoef, P., & Sloot, L. (2006). Out-of-stock reactions, antecedents, management solutions, and a future perspective: Retailing in the 21st century current and future trends. Berlin: Springer.
Walter, C. K., & Grabner, J. (1975). Stockout models empirical tests in a retail situation. Journal of Marketing, 39(3), 56-68.
Williams, R. (2012). Using the margins command to estimate and interpret adjusted predictions and marginal efects. he Stata Journal, 12(2),
308-331.
World Bank. (2010, February). How to decrease freight logistics costs in Brazil [Report n. 46885-BR]. World Bank, Washington, DC.
About the authors:
1. Aleksandar Grubor, PhD in Economics, University of Novi Sad, Subotica, Republic of Serbia. E-mail: [email protected]
ORCID
0000-0001-9798-0401
2.Nikola Milicevic, PhD in Economics, University of Novi Sad, Subotica, Republic of Serbia. E-mail: [email protected]
ORCID
0000-0003-4834-6994
3.Nenad Djokic, PhD in Economics, University of Novi Sad, Subotica, Republic of Serbia. E-mail: [email protected]
ORCID
0000-0001-8229-8354
Contribution of each author:
Contribution Aleksandar Grubor Nikola Milicevic Nenad Djokic
1. Deinition of research problem √ √
2. Development of hypotheses or research questions (empirical
studies) √ √
3. Development of theoretical propositions (theoretical work) √ √
4. heoretical foundation /Literature review √ √
5. Deinition of methodological procedures √ √
6. Data collection √ √
7. Statistical analysis √
8. Analysis and interpretation of data √
9. Critical revision of the manuscript √ √