Vitamin A Status of Children in Five
Ecuadorian Provinces1
ALICIA RoD~~G~z,~
GLADYS GUAM&~& DAVID I?. NELSON~
444
In mid-1993 Ecuador‘s Health Research Institute conducted a survey to evaluate the general nutrition and vitamin A status of children infive provinces (three in the mountains and two on the coast) containing pockets of extreme poverty. The survey enrolled 1 555 children U-59 months old who constituted a multiphased stratl@ed cluster sample obtained by random selection methods. Among its other aims, the survey sought to assess all or part of the study subjects’ serum retinol levels, dieta y vitamin A intake, and ocular signs of vitamin A deficiency, and to weigh the influence on vitamin A status of age, sex, parental (maternal) education, residt?nce in a rural or urban area, and the ethnic background of the residence area. Questionnaire interviews were conducted to gather information about each survey child’s identity, diet, pathologic histoy, and breast-feeding history; a blood sample was obtained; and the child was weighed, measured, and given a complete physical examination (including an eye examination).
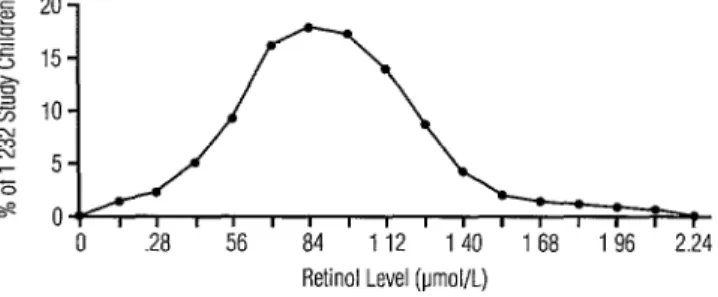
Of the 1232 survey children whose serum retinol levels were measured, 18% and 2% were found to have levels below 0.7 and 0.35 pmol/L, respectively. Low serum retinol levels were more common among children of mothers who had relatively little education and resided in rural areas. The presence of Bitot’s spots was confirmed in two of the study children.
Interviews conducted with 39% of the study children’sfamilies to assess the children’s diets showed the risk of insufficient vitamin A intake to be greater in the mountain provinces and
among Indian populations, children born to mothers with no formal education, children living in rural areas, and underweight and stunted children.
Forty-eight percent of the study population had serum retinol levels between 0.70 and 1.05 pmol/L, indicating marginal vitamin A deficiency. It would therefore appear that dieta y supple- mentation would cause a substantial part of the Ecuadorian population to improve its vitamin A status. Overall, the results of the survey were consistent with a previous national survey and confirmed the existence of a pronounced subclinical vitamin A deficiency that clearly con- stitutes a public health problem, especially in Ecuador’s rural Andean areas.
,
E
cuador’s 1985 National Nutrition and Health Survey found the percentage of preschool children with serum retinol lev- els below 20 &dL to be 13.9% (16.4% in’ Reprint requests and other correspondence should be addressed to Alicia Rodriguez, Ministerio de Salud Ptiblica de1 Ecuador, Instituto de Investigaciones de Salud, Casilla 17-21-538, Quito, Ecuador. This article was also published in Spanish in the Boletin de la Oficina Sanitaria Panamericana, Vol. 120, No. 2, February 1996, pp. 117- 124, under the title “Estado nutritional de 10s niiios de cinco provincias de1 Ecuador con respect0 a la vitamina A.”
*Ministry of Public Health of Ecuador, Health Research Institute, Quito.
3 Unpublished observation.
rural areas and 11.9% in urban areas) (I), reflecting higher vitamin A consumption rates in urban areas. A larger percentage of boys (17.1%) than of girls (10.7%) had se- rum retinol levels below 20 pg/dL. Based on WHO criteria in effect at the time, it was felt that the overall picture did not consti- tute a national public health problem.
been detected in recent years at pediatric health services in Guayaquil and Quito.
Partly to establish the prevalence of vi- tamin A deficiency in poor population groups, the Ecuadorian Ministry of Public Health’s Health Research Institute (Institute de Investigaciones de Salud-IIDES) con- ducted a prevalence survey in five prov- inces (three in the mountains and two along the coast) containing pockets of extreme poverty. This article presents the results of that survey, which was carried out to evalu- ate both the general nutrition and vitamin A status of children 12 through 59 months old. In 1990, the Ministry of Public Health classified all cantons (provincial subdivi- sions) by level of poverty according to stan- dard criteria (2); the survey provinces con- tamed the five most impoverished cantons in that classification.
MATERIALS AND METHODS
The survey employed a stratified multi- stage cluster sample obtained by randomly selecting parishes (canton subdivisions)
from among all the cantons in the five study
provinces, the selection probability being made proportionate to each parish’s popu- lation size (PPS sampling). Beginning at a randomly chosen starting point, visits were made to households within each selected parish. Within each family having at least one child 12-59 months old, a child was ran- domly selected from all the family’s children in this age range. A blood sample from the child was obtained, together with appropri- ate information about the child and family (see below), and in one out of every three cases the family’s diet was evaluated. It was estimated beforehand that a sample includ- ing 1 500 children would be appropriate, given a sample design effect factor of 1.5 and a low serum retinol prevalence of 15%.
The indicators selected to assess vitamin A deficiency were the child’s serum retinol level, dietary vitamin A intake, and ocular signs. Other indicators of health and nutri-
tion status that were studied included each child’s height, weight, presence or absence of fever, diarrhea1 or respiratory disease symptoms during the 15 days preceding the interview, and breast-feeding status of chil- dren 12-23 months old.
Regarding socioeconomic factors, mater- nal education was categorized as none, in- complete primary, complete primary, in- complete secondary, complete secondary, or post-secondary. The residence area of each survey cluster was classified as rural or urban according to how that area was defined by the National Statistics and Cen- sus Institute. Using the classification of the National Planning Council, the ethnicity of individual parishes was defined by the pre- dominant ethnic group (mestizo, Indian, or black) within that parish (3).
Regarding blood samples, these were taken with 10 mL syringes and immediately placed in vacutainers. The samples were then kept on ice in the dark for a maximum of six hours until it was possible to separate and freeze the sera. After that the frozen sera were transported on dry ice to the Research Institute of the Faculty of Chemistry at the Central University of Ecuador in Quito for analysis. Serum retinol levels were mea- sured by high-pressure liquid chromatog- raphy according to the method of Bieri et al., using retinol acetate as an internal stan- dard to control for retinol recovery (4).
Thereafter, the surveyors estimated the amounts of foods containing vitamin A that were given to the children during the 24 hours preceding the visit, as well as the fre- quency with which they were given such foods during the seven days preceding the survey. On this basis, each child’s vitamin A consumption on the survey day (“index of consumption”) and during the week pre- ceding the survey (“usual pattern of food consumption”) were estimated.
Ocular signs of vitamin A deficiency were evaluated by physicians trained by an ophthalmologist. The WHO xerophthalmia scale was used to classify the signs in ac- cordance with their degree of severity: Xl - conjunctival xerosis, Bitot’s spots; X2- cornea1 xerosis; X3-cornea1 ulceration, keratomalacia; and XS-cornea1 scarring (7). Suspected xerophthalmia cases were referred to an expert ophthalmologist for verification.
The field work began in June 1993 and ended in August. Advance teams visited the survey sites one to three days before the interviewers. They advised community leaders about the survey’s purpose and benefits for participants. They also updated census maps and identified dwellings in a clockwise order, starting from a predeter- mined landmark and listing those with chil- dren 12-59 months old. These homes were visited, and children were recruited to visit an examination/interview center at an ap- pointed time.
At the center, physician interviewers employed a questionnaire to gather infor- mation about each survey child’s identity, diet, medical history, and breast-feeding history. In addition, a blood sample was obtained from each subject, and each was measured, weighed, and given a complete physical examination (including an eye examination). Ill children were treated or referred to nearby health facilities.
Data entry and management were per- formed using the EPI-INFO software pack- age (8). Chi-square analyses were per-
formed, and results with P < 0.05 and P < 0.01 were considered statistically significant and highly significant, respectively. The degree of association between the scores obtained for the “index of consumption” and “usual pattern of food consumption” was estimated using Pearson’s correlation coefficient.
The participants’ nutritional status was evaluated on the basis of their weight-for- age and height-for-age z scores with respect to the standard employed by WHO and the US National Center for Health Statistics. These calculations were made using the EPI-INFO anthropometric software (8). Children whose weight-for-age or height- for-age was more than two standard devia- tions below z were considered respectively underweight or stunted for their age.
RESULTS
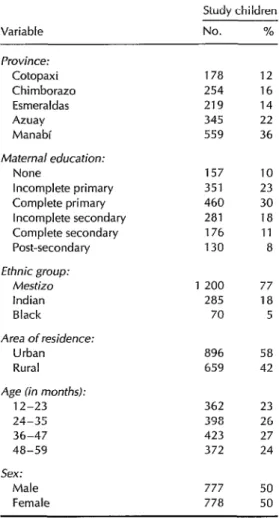
In all, 1555 children 12-59 months old (104% of the anticipated sample size) par- ticipated in the survey. The children were distributed homogeneously by age and sex (Table l), and the number from each prov- ince corresponded to that province’s popu- lation size. Table 1 also shows the sample’s distribution in terms of maternal education, area of residence (urban or rural), and pre- dominant ethnic group in the parish.
Table 1. Distribution of the children in the sample (N = 1 555) by various sociodemo- graphic variables.
Variable
Study children
NO.
%Province: Cotopaxi Chimborazo Esmeraldas Azuay Manabi
Maternal education: None
Incomplete primary Complete primary Incomplete secondary Complete secondary Post-secondary Ethnic group:
Mestizo Indian Black Area of residence:
Urban Rural Age (in months):
12-23 24-35 36-47 48-59 Sex:
Male Female
178 12 254 16 219 14 345 22 559 36
157 10 351 23 460 30 281 18 176 11 130 8
1 200 77 285 18 70 5
896 58 659 42
362 23 398 26 423 27 372 24
777 778
50 50
group, area of residence (urban or rural), and age.
With regard to provincial and ethnic cat- egories, it should be noted that all of the children classified as black (coming from predominantly black parishes) resided in the province of Esmeraldas, while all of the children classified as coming from pre- dominantly Indian parishes were living in the provinces of Cotopaxi and Chimborazo.
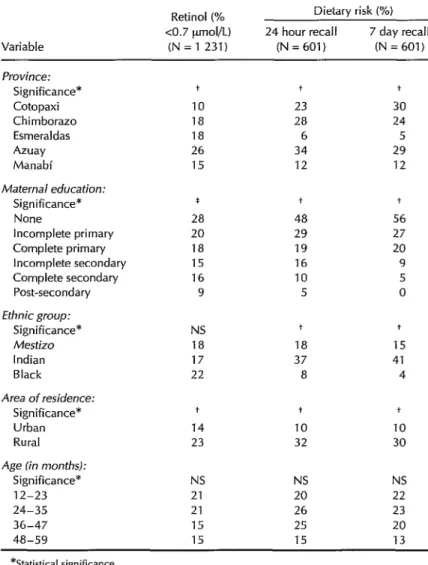
Marked variation was observed in the prevalence of low retinol levels (<7 urnol/L)
in different provinces, these prevalences ranging from a low of 10% in Cotopaxi to a high of 26% in Azuay. However, no obvi- ous difference emerged between the coastal and mountain provinces, the prevalences in the coastal provinces (EsmeraIdas and Manabi) being in the middle (15-B%) while prevalences in the three mountain provinces ranged from lowest to highest (lo-26%).
Low serum retinol levels were more common among children of mothers who had relatively little education and resided in rural areas (see Table 2). These statisti- cally significant trends were observed among both boys and girls as well as in all three ethnic groups. A trend was also found toward higher prevalences of low serum retinol levels in younger children, but this was not statistically significant. No signifi- cant relationship was found between serum retinol levels and nutritional status, al- though stunted children tended to have lower retinol levels.
Figure 1. Distribution of the study children in terms of serum retinol levels (N = 1 232).
Retinol Level (lmol/L)
The dietary evaluation showed the risk of insufficient vitamin A intake to be greater in the mountain provinces than in the coastal provinces. It was also highest in parishes with predominantly Indian popu- lations, lowest in those with predominantly black populations, highest among children whose mothers had no formal education, and highest among those residing in rural areas. In addition, underweight and stunted children were more likely to have high dietary risk than those with normal scores for these variables (XX = 1.5 and 2.0, respectively).
The presence of Bitot’s spots was con- firmed in two children (0.13% of those stud- ied), one in the mountain province of Azuay and the other in the coastal province of Manabi. Obviously, the small number af- flicted with these ocular signs made it im- possible to draw statistical inferences from the data.
DISCUSSION
AND
CONCLUSIONS
The prevalence of low serum retinol lev- els (18%) found by this survey was greater than the 12% reported by the 1985 National Health and Nutrition Survey. This result was not surprising, because the survey was designed to assess vitamin A deficiency in impoverished areas. Since the study prov- inces contain about 1 million inhabitants,
i.e., 20% of the national population, includ- ing some 240 000 children between the ages of 12 and 59 months, the results indicate that at least 43 000 children in those prov- inces are vitamin A deficient.
The Ministry of Public Health classifies as “critically poor” those cantons with the highest infant mortality, lowest health ser- vice coverage, and most deficient basic sani- tation and other services. All such cantons so classified are rural, a high percentage being located in the Andes mountains, and many have large Indian populations with low levels of literacy.
The group of provinces with the largest numbers of “critically poor” cantons are also classified as being critically poor, even though their urban populations are usually unaffected by rural poverty. The sample for this study was drawn from all of the can- tons included in those provinces, regard- less of whether or not they were critically poor. Accordingly, it is probable that the prevalence of vitamin A deficiency esti- mated for the rural areas (23%) represents an underestimate of the situation to be found in the critically poor poverty pock- ets. These latter areas, in turn, are undoubt- edly similar to the country’s other poor ru- ral cantons, especially those with Andean Indian populations.
Table 2. Prevalences of vitamin A deficiency (as determined by measurement of serum retinol levels and assessed risk of dietary deficiency) in the study children, by various sociodemographic variables.
Variable
Retinoi (% CO.7 pmol/L) (N = 1 231)
Dietary risk (%) 24 hour recall 7 day recall
(N=601) (N = 601)
Province:
Significance* Cotopaxi Chimborazo Esmeraldas Azuay Manabi
Maternal education:
Significance* None
Incomplete primary Complete primary Incomplete secondary Complete secondary Post-secondary
Ethnic group:
Significance* Mestizo Indian Black Area of residence:
Significance* Urban Rural
Age [in months):
Significance* 12-23 24-35 36-47 48-59
IO 23 30
18 28 24
18 6 5
26 34 29
15 12 12
* +
28 48 56
20 29 27
18 19 20
15 16 9
16 10 5
9 5 0
NS
18 17 22
14 23
NS NS NS
21 20 22
21 26 23
15 25 20
15 15 13
+
18 37 8
+ 10
32
+
+
15 41 4
10
30
*Statistical significance. +=P<o.ool.
*=p<o.o1.
NS = Not significant (P> 0.05).
lit health significance (IO). Thus, the preva- lence of this deficiency in all of the prov- inces and sociodemographic classes stud- ied clearly indicates a public health problem that needs to be addressed.
The prevalence of inadequate vitamin A intake, as indicated by the dietary data, closely paralleled the distribution of low
Regarding the differences observed be- tween the coast and mountain provinces, it is known that diarrhea1 and viral infec- tions reduce the concentration of retinol in the blood and cause retinol to be lost through urination (12-23). Diarrhea1
and
respiratory infections were detected more frequently on the coast. In addition, malaria is known to be endemic in the coastal prov- ince of Esmeraldas, which was one of those surveyed. Thus, prevailing disease rates could help to explain the lack of associa- tion between serum retinol levels and nu- tritional deficiency in the coastal areas.
In addition, the time of year during which the survey was conducted in the coastal region (July and August) coincided with the beginning of the harvest season. For this reason, the high prevalence of low serum r&in01 levels observed on the coast relative to dietary risk could be indicative of vitamin A status during the “hungry” period just prior to the harvest.
Like the serum retinol level, the indica- tor of vitamin A precursor consumption in the diet makes it possible to identify high- risk population groups within similar prov- inces or geographic regions; thus, it could be used to detect high-risk groups living in the same areas and, possibly, to monitor dietary changes occurring over time in the same groups. However, as used in this study, it would not be useful for making inter-regional comparisons.
The IVACG recommends using a 24- hour recall period to study populations with a monotonous diet and a 7-day recall period for populations with greater dietary diversity. Because of considerable variation within the study population, this survey examined both periods. As the Panama vi- tamin A survey demonstrated (24), studies using relatively long recall periods tend to detect less frequently consumed vitamin A sources and thereby tend to reduce the ob- served prevalence of high dietary risk. The close relationship found between data for the two recall periods used in this study sug-
gests low dietary diversity. Therefore, future dietary studies using this methodology in similar Ecuadorian settings could probably dispense with the 7-day recall period.
Ocular signs of vitamin A deficiency are so rarely reported in Latin America that ophthalmologists have often concluded the deficiency does not exist there. This study identified and confirmed two cases of Bitot’s spots (cheesy accumulations on the conjunctiva characteristic of vitamin A de- ficiency), which may indicate that poor chil- dren suffering from this deficiency are not normally seen by ophthalmologists. How- ever, the subjects’ serum retinol levels were not deficient, suggesting that the Bitot’s spots could have represented residual evi- dence of prior deficiency.
Forty-two percent of the Ecuadorian study population had serum retinol levels between 0.70 and 1.05 pmol/L (between 20 and 30 pg/dL), indicating marginal vitamin A deficiency. Several studies have con- firmed reductions in child mortality follow- ing administration of vitamin A supple- ments to members of population groups having such subclinical deficiency (15,2 6). Flores et al. showed that children who had received vitamin A supplements did not have serum concentrations of retinol below 1.05 umol/L (30 yg/dL) (27). Accordingly, it would appear that appropriate dietary supplementation would cause 60% of the Ecuadorian population studied to improve their vitamin A status and would reduce childhood mortality.
Overall, the results of this survey, which showed substantial consistency with those of the previous national survey, confirmed the existence of significant subclinical vita- min A deficiency that clearly constitutes a public health problem, especially in the rural Andes.
REFERENCES
2.
3.
4.
5.
6.
7.
a.
9.
10.
sifuacidn alimenfaria nufricional y de salud de la poblaci6n menor de cinco afios. Quito: Min- istry of Public Health, CONADE; 1986. Ecuador, Ministry of Public Health. Pobreza critica: anlilisis de indicadores de salud. Quito: 11. Ministry of Public Health; 1990.
Consejo National de Desarrollo. Desnuf- 12.
rici& y condiciones socioecondmicas en el Ec- uador. Quito: CONADE; 1992.
Bieri JG, Tolliver TJ, Catignani GL. Simulta-
neous determination of alpha-tocopherol 13.
and retinol in plasma and red cells by high- pressure liquid chromatography. Am J Clin Nufr 1979;32:2143-2149.
Nelson D. Computerization of IVACG sim- 14.
plified dietary assessment methodology for assessing risk of inadequate vitamin A in- take. XIV IVACG Meeting (Bangkok). Wash- 15. ington, DC: International Life Sciences In- stitute; 1994. (Abstract).
Nutrition Foundation, International Vitamin A Consultative Group. Guidelines for devel- 16. aping a simplified diefa y assessment of riskfor inadequate consumption of vitamin A. Wash- ington, DC: Nutrition Foundation; 1991. World Health Organization. Vitamin A def- ciency and xerophfhalmia: reporf of a joint 17.
WHO/usAID meeting. Geneva: WHO; 1976.
(Technical report series, 590).
Dean AD, Dean JA, Burton JH, Dicker RC. Epi Info, Version 5: a word processing, database, and statistics program for epidemiology on mi- crocomputers. Atlanta: United States Centers
cation in monitoring and evaluating inferven- tion programmes: report of a joinf WHO/ UWCEF consultation. Geneva: WHO; 1994. (Review version WHO/NUT/94.1).
Beisel WR. Metabolic effects of infection. Prog Food Nutr Sci 1984;8:43-75.
Alvarez JO, Salazar-Lindo E, Kohatsu J, Miranda I?, Stephensen CB. Urinary excre- tion of retinol in children with acute diar- rhea. Am T Clin Nufr 1995;61:1273-1276.
Stephensen CB, Alvarez JO, Kohatsu J,
Hardmeier R, Kennedy JI, Gammon RB. Vi- tamin A is excreted in the urine during acute infection. Am 1 Clin Nufr 1994;60:388-392. Caballero E, Rivera G, Nelson Dl? National vitamin A survey in Panama. Bull Pan Am Health Organ 1996;30(1):43-50.
Sommer A, Tarwotjo I, Djunaedi E, et al. Im- pact of vitamin A supplementation on child- hood mortality: a randomised controlled community trial. Lancef 1986;1:1169-1173. Rahmathullah L, Underwood BA, Thulasiraj RD, et al. Reduced mortality among children in Southern India receiving a small weekly dose of vitamin A. N Engl J Med 1990;
323:929-935.
Flares H, Azevedo MNA, Campos FACS, et al. Serum vitamin A distribution curve for children aged 2-6 years known to have ad- equate vitamin A status: a reference popu- lation. Am J Clin Nutr 1991;54:707-711.
for Disease Control and Prevention; 1990.
Olson JA. Recommended dietary intakes Manuscript submitted for publication on 12Aprill994. (RDI) of vitamin A in humans. Am 1 Clin Accepted for publication in the
Bolefin de la Oficina Nutr 1987;45:704-716. Sanitaria 9 October 1995. Accepted for Dublication Panamericana, A following 1 revision, on in the Bulletin