Article
0103 - 5053 $6.00+0.00*e-mail: [email protected]
Antithyroid Activity of 6-Chloropurine
Ismat Fatima,a Munawar A. Munawar,*,a Misbahul A. Khan,a Asmatullah,b
Afia Tasneemc and Muhammad Khalilb
aInstitute of Chemistry and bDepartment of Zoology, University of the Punjab-Lahore, Pakistan
cCentre for Nuclear Medicine, Mayo Hospital-Lahore, Pakistan
A atividade antitireóidea do 6-cloropurina, in vitro, foi determinada espectrofotometricamente por estudos de formação de seu complexo com iodo. O complexo mostrou estequiometria de 1:1. A constante de formação do complexo encontrada foi 7,652 × 103 L mol-1, o que indicou um bom
potencial de 6-cloropurina, como agente antitireóideo. Posteriores veriicações mostraram mudanças nos níveis hormonais tireóideos em coelhos machos, in vivo, após administração da dose via
intraperitoneal (i.p.) durante 14 dias e medindo os níveis de triiodotironina (T3) e tetraiodotironina (T4) livres, na circulação sanguínea, usando-se a técnica de radioimunoensaio. As análises de sangue mostraram decréscimo nos níveis de T3 e T4 livres em animais tratados, quando comparados com os controles. Desta maneira, conirmou-se uma boa atividade antitireóidea do 6-cloropurina.
Antithyroid activity of 6-chloropurine was determined, in vitro, by studying its complex formation with iodine spectrophotometrically. The complex exhibited a 1:1 stoichiometry. Formation constant (Kc) of the complex was found to be 7.652 × 10³ L mol-1, which indicated
good antithyroid potential of 6-chloropurine. For further veriication, changes in the thyroid hormone levels of the male rabbits were observed, in vivo, after administering the dose through intra peritoneal (i.p.) injections for 14 days and measuring free triiodothyronine (T3) and tetraiodothyronine (T4)levels in the blood serum using radioimmunoassay technique. The blood assays showed decrease in free T3 and T4 levels in the treated animals as compared to the control ones thus conirming fairly good antithyroid activity of 6-choloropurine.
Keywords: 6-chloro-9H-purine, iodine, antithyroid activity, charge transfer complex, thyroid hormones
Introduction
Propylthiouracil and methimazoleare the only two widely used antithyroid drugs.1 Undesirable side effects
associated with these drugs have been observedfor the past years.2 This scarcity of antithyroid drugs motivated
the search for new antithyroid agents. Consequently, antithyroid activity of a number of synthetic and natural compounds was studied.3 Synthetic antithyroid agents
may either act by making stable complexes with iodine or by interfering with thyroid peroxidase (TPO) enzyme. In the irst mechanism they make stable electron donor-acceptor complexes with molecular iodine produced by the oxidation of iodides, diverting the oxidized iodides away from thyroglobulin and ceasing the biosynthesis of thyroid hormones (T3 and T4). The formation constant
(Kc) is indicative of the strength of complex. Higher the Kc stronger will be the complex. While in a second proposed mechanism, TPO is inactivated by the action of antithyroid agents, which block its active Fe3+. The ability of TPO, to
oxidize the iodides and coupling monoiodotyrosine and diiodotyrosine residues of thyroglobulin to produce thyroid hormones, is greatly reduced. Lacto peroxidase (LPO), an analog of TPO is used to study the enzyme inhibition ability of the antithyroid compounds, in vitro. However, it has been observed that a number of drugs like levamisole, tetramethylthiourea, tetrahydrozoline and phenothiazines etc, which did not inhibit peroxidase activity showed high complexing tendency with iodine (obvious from high Kc values) and also exhibited strong antithyroid activity
in vivo.4 Electron donor properties of purines have been
reported by Pullman and Pullman.5 The formation of charge
was studied by Beukers and Szent-Gyorgyi,6 while
Machmer and Duchesne7 described the formation of a
donor-acceptor complex between chloranil (acceptor) and adenine and guanine (donors). Helm and co-workers,8 were
the irst to report the structural and spectral information about a charge transfer (CT) complex of purine, stabilized primarily, by donation of n electrons from ring nitrogen. Single crystals of iodine complex of 9-cyclohexyladenine were obtained by allowing iodine to diffuse into a CCl4 solution of 9-cyclohexyladenine. The complex nature was stated to be 1:1. Likewise, 1,7-dialkylxanthinesand some dimethylxanthines were reported to have antithyroid activity,9 whilst adenine and guanine also exhibited
low level antithyroid activity. Similarly, charge transfer complexes of purines with bromanil and p-benzoquinone have also been reported.10 There exists a good correlation
between antithyroid activity, in vivo, and formation constant (Kc) of complexes of different organic compounds with iodine. Kc≥ 100 L mol-1 indicates presence of considerable
antithyroid activity.11
The above mentioned and many other similar facts demonstrated the need to check purines for potential antithyroid activity and 6-chloro-9H-purine (Figure 1) was the irst choice in this regard because in an initial spectrophotometric analysis in the laboratory using method of continuous variations”,12 6-chloropurine-iodine complex
showed 1:1 stoichiometry. Lang13 described a simple
method to determine Kc of such complexes. Though Kc can be used as an indicator of antithyroid activity yet the decisive factor is in vivo testing of the compound. Nevertheless, Kc can help in predicting and selecting compounds for in vivo studies, which are conducted on animals (mice, rats and rabbits) thus reducing the investigation cost. The hormone levels are determined after administering the compound to the animals, in vivo,
for a certain period of time. Variation in hormonal levels indicates antithyroid effect of the compound.
Experimental
Iodine was obtained from Merck (suprapur) bisublimed and was kept in dark in a dessicator containing P2O5. DMSO of spectroscopic grade was obtained from Merck, was dried over calcium hydride, distilled under reduced pressure and
stored over type 4A molecular sieves. 6-Chloropurine was obtained from Sigma Aldrich. Spectra were recorded on a double beam UVD-3500 spectrophotometer (Labomed Inc.). Radioimmunoassay (RIA) kits for free T3 and T4 were obtained from Immunotech (France) and blood assay was carried out at Centre for Nuclear Medicine Lahore (Pakistan).
In vitro
Complex formation with iodine is an indication of antithyroid activity of a compound. Kc proved to be a useful parameter in this regard. In vitro antithyroid activity of 6-chloropurine was assessed spectrophotometrically by studying its complex formation with iodine. Solutions of iodine and 6-chloropurine were prepared just before the start of experiment by diluting gravimetrically prepared stock solutions in DMSO. Iodine concentration was kept constant (3×10⁻⁵ mol L-1), while the concentration of
6-chloropurine was varied between 1×10⁻⁴ mol L-1 and
1×10⁻³ mol L-1. The reaction was carried out directly in the
spectrophotometric cell by mixing 1.5 mL solutions each of 6-chloropurine (donor) and iodine (acceptor). Spectra were recorded immediately on double beam UV Visible spectrophotometer, which showed formation of a charge transfer (CT) complex at a different λmax than the reactants.
In vivo
Male rabbits weighing 1.35-1.40 kg were kept in animal house (Department of Zoology, University of the Punjab, Lahore) for in vivo study of variation in thyroid hormone (T3,T4) levels on treatment with 6-chloropurine. They were divided into three groups of ive animals each and were provided with green fodder with water ad libitum. The animals were kept under standard laboratory conditions. First group (treated) of ive rabbits received daily dose of 20 mg kg-1 of 6-chloropurine solution in DMSO via i.p.
injection for 14 days. Second group (vehicle control) received the equivalent dose of DMSO daily while the third (control) was kept untreated for the same period of time. Blood samples were collected from all three groups by dilating and puncturing veins of ears. The dose application and sample collection were performed under standard sterilized conditions.14 The levels of free T
3 and T4 from the samples
were determined using radioimmunoassay technique.
Results and Discussion
Both iodine and 6-chloropurine absorbed in UV region. However, the formation of complex led to the
N
N NH
N Cl
appearance of a CT band. This band is characteristic of the complex formation. It was quantiied by placing a solution of pure donor at the same concentration in the reference beam, and then by subtraction of absorption due to iodine. Complex formation was observed between 215 and 225 nm with λmax at 225 nm. The absorbance values at 215 nm, 220 nm and 225 nm wavelengths were recorded for different concentrations of 6-chloropurine and constant concentration of iodine (Table 1).
Kc was determined using Lang’s method,15 which has
been successfully used to determine the formation constants of 1:1 stoichiometric complexes,
Kc = [C] / ([I0]-[C]) ([P0]-[C]) (1)
where [I0] is the initial concentration of iodine and [P0] is the initial concentration of 6-choloropurine and [C] is the concentration of complex:
[c] = εcdc (2)
where dc is the absorbance of the complex and εc is extinction coeficient. Equation 1 can be re-written in the form:
Y= (1/ εc)X + 1/Kcεc (3)
where Y= [I0][P0]/dc and X= [I0] + [P0] – dc/εc.
Equation 3 is an equation of a straight line with slope 1/εc and Y-intercept 1/(Kcεc).
With ixed iodine concentration and different compound concentrations, different values of dc and hence Y were obtained. X contained unknown values of Kc and εc. Iteration
and linear regression were used to solve this equation. An initial value of εc was assigned and value of X was calculated. From the slope of the line, new value of εc was determined and used in the same process until the εc as well as Kc converged to particular values. Iterations were carried out by developing a simple computer program in the laboratory. The inal values of X and Y calculated, by the same iterative method were recorded (Table 2). The XY scatter was plotted to which linear regression curve gave the best it (Figure 2), with coeficients of determination (R2 > 0.99)K
c
was calculated for all three wavelengths (Table 3) and mean value was found to be 7.652 × 10³ L mol-1, which indicated
fairly good antithyroid activity of 6-chloropurine.
Table 1. UV spectral data for charge transfer complex between iodine and 6-chloropurine in DMSO at 20 °C with 6-chloropurine solution of the same concentration in the reference cell
[I2] / (mol L-1)
[6-CP] / (mol L-1)
Absorbance
215 nm 220 nm 225 nm
0.00003 0.0001 0.019 - 0.024
0.00003 0.0002 - 0.019 0.034
0.00003 0.0003 - 0.02 0.038
0.00003 0.0004 - - 0.043
0.00003 0.0005 0.031 -
-0.00003 0.0006 - 0.025
-0.00003 0.0007 - 0.025
-0.00003 0.0008 0.035 -
-0.00003 0.0009 0.037 0.027
-0.00003 0.001 0.038 - 0.051
Table 2. X, Y values calculated using Lang’s equation to plot regression lines
215 nm 220 nm 225 nm
X×103 Y×107 X×103 Y×107 X×103 Y×107
0.116 1.58 0.211 3.16 0.118 1.25
0.508 4.84 0.310 4.50 0.212 1.76
0.805 6.86 0.605 7.20 0.310 2.37
0.904 7.30 0.705 8.40 0.408 2.79
1.003 7.89 0.903 10.00 1.003 5.88
Figure 2. Relationship between [I2][P]/dc and [I2] + [P] − dc/ε
c for
6-chloropurine-iodine complex at 20 °C (DMSO, quartz cells with 1 cm path length). The regression lines are drawn on the basis of X, Y data for the following: 215 nm: (R2 = 0.9928); 220 nm: (R2 = 0.9959); 225 nm: (R2 = 0.9993).
Table 3. Formation constant and molar extinction coefficient for 6-chloropurine-iodine complex calculated at different wavelengths
λ / nm
ε
c /
(L mol-1 cm-1)
Kc / (L mol-1)
Mean Kc / (L mol-1)
Standard Deviation
215 1.40 × 10³ 7.61 × 10³
220 1.01 × 10³ 7.68 × 10³ 7.652 × 10³ 39
6-chloropurine (donor) did not absorb in visible region. When a solution of iodine was added to the donor solution, the characteristic band of the halogen shifted towards shorter wavelength (∆ = 15 nm). Spectra were recorded with different concentrations of 6-chloropurine and a ixed concentration of iodine (I2 = 3×10⁻⁵ mol L-1) between
300-800 nm at 20 °C. The absorbance peak of the complex was determined by placing a solution of iodine of the same concentration in the reference beam.
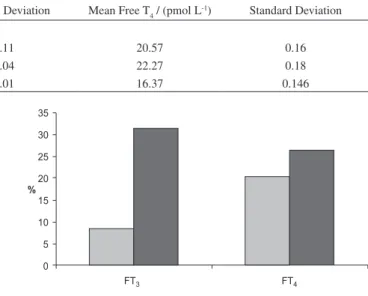
Circulating hormone levels i.e., free T3 and T4 of all three animal groups were determined after 14 days using RIA technique (Table 4). In hyperthyroidism, i.e. over active thyroid gland, thyroid hormones (T3 and T4) concentrations are increased in the blood and vice-versa. Therefore, a corresponding decrease in free T3 and T4 levels in the blood serum of the treated animals with respect to control will indicate antithyroid effects of the injected compound (6-chloropurine). The blood assays of the animals showed 8% and 20% decrease in average levels of free T3 and T4 in the treated animals as compared to the control ones, while the pertaining decrease with respect to the vehicle control was 31% and 26% respectively (Figure 3). The blood assay data was also checked statistically using the famous Student’s t test; to further conirm the decrease in hormonal levels of the treated category with respect to the control and vehicle control categories. In this regard, the proposed null and alternative hypotheses were:
Null hypothesis (H0): μc – μt = 0;
where, μ stands for population mean, while ‘c’ and‘t’ for control and treated groups respectively.
Alternative or research hypothesis (HA): μc – μt > 0 or μc > μt
where —Xc and —Xt are the mean of control and treated values respectively and n is the total number of samples and Sx (standard error of the means) is given by:
Sx = √ [{Σ (Xci – —Xc) + Σ (Xti −—Xt)}/ (nc + nt − 2)]; nc and nt are total number of samples in control and treated classes respectively, which in this case are equal.
“t” values were calculated from the assay results and were compared with the critical values of t’0.001(8) (significance level = 0.001, degree of freedom = 8) from the table, which rejected the null hypothesis, thus accepting the research hypothesis. Therefore, signiicant decrease in the T3 and T4 levels of the treated animals, as compared to the control and vehicle control groups was recorded, which conirmed the antithyroid effects of 6-chloropurine. However, the vehicle control group showed a rise in the hormonal levels as compared to the control group.
Conclusions
Antithyroid activity of 6-choloropurine was proved both in vitro and in vivo. The blood assay of treated animals compared to the vehicle control animals showed a marked decrease in hormonal levels. Kc proved to be a good indicator of antithryoid activity for1:1 stoichiometric complex of 6-chloropurine with iodine.
References
1. Laurence, C.; El Ghomari, M. J.; Le Questel, J. Y.; Berthelot, M.; Mokhlisse, R.; J. Chem. Soc., Perkin Trans. 1998, 2,
1545.
2. Bandyopadhyay, U.; Biswas, K.; Banerjee, R. K.; Toxicol. Lett. 2002, 128, 117; Cooper, D. S.; N. Engl. J. Med. 1984, 311, 1353; Abou-Shabaan, R. R. A.; Al-Khamees, H. A.; Abou-Auda, H. S.; Simonelli, A. P.; Saudi Pharm. J.1995, 3, 156.
Figure 3. Percentage decrease in hormone levels after 14 days treatment. Table 4. Serum hormone levels in rabbits of untreated (control), treated (with 6-chloropurine solution in DMSO) and vehicle control (treated with equivalent dose of DMSO) groups after two weeks
Hormone Levels Mean Free T3 /(pmol L-1) Standard Deviation Mean Free T
4 / (pmol L
-1) Standard Deviation
Animal Groups
Control 3.643 0.11 20.57 0.16
Vehicle Control 4.867 0.04 22.27 0.18
3. Lagorce, J. F.; Comby, F.; Russeau, A.; Buxeraud, J.; Raby, C.;
Chem. Pharm. Bull.1993,41, 1258.
4. Buxeraud, J.; Absil, A. C.; Raby, C.; J. Pharm. Sci.1984, 73,
1687; Taurog, A.; Endocrinology1976, 98, 103; Nakashima, T.; Taurog, A.; Riesco, G.; Endocrinology1978, 103, 2187; Engler, H.; Taurog, A.; Luthy, C.; Dorris, M. L.; Endocrinology 1983, 112, 86; Laurence, C.; El Ghomari, M. J.; Berthelot, M.; J. Chem. Soc., Perkin Trans.1998, 2, 1163; Beyssen, M. L.; Lagorce, J. F.; Cledat, D.; Jambut, A. C.; Buxeraud, J.;
Pharmacology2000, 61, 22; Roy, G.; Mugesh, G.; J. Chem. Sci.2006, 118, 619.
5. Pullman, B.; Pullman, A.; Biochemistry1958, 44, 1197. 6. Beukers, R.; Szent-Gyorgyi, A.; Rec. Trav. Chim. Pays-Bas.
1962, 81, 256.
7. Machmer, P.; Duchesne, J.; Nature1965,206, 618.
8. Helm, D. V.; Christian, S. D.; Lian, L.; J. Am. Chem. Soc.1973,
95, 2409.
9. Mann, F. G.; Porter, J. W. G.; J. Chem. Soc. 1945, 751.
10. Fulton, A; Lyons, L. E.; Aust. J. Chem.1968, 21, 419. 11. Raby, C.; Buxeraud, J.; Eur. J. Med. Chem.1980, 15, 425. 12. Duffey, G. H.; Physical Chemistry, 2nd ed., Mc Graw Hill: New
York, 1962.
13. Lang, R. P.; J. Am. Chem. Soc.1962, 84, 1185.
14. Campbell, A.; Gillett, G.; Jones, G.; Medical Ethics, 3rd ed., Oxford University Press: Singapore, 2002.
15. Lagorce, J. F.; Jambut-Absil, A. C.; Buxeraud, J.; Moesch, C.;
Chem. Pharm. Bull.1990, 38, 2172;Rousseau, A.; Comby, F.; Buxeraud, J.; Raby, C.; Biol. Pharm. Bull.1996, 19, 726; Raby, C.; Lagorce, J. F.; Jambut-Absil, A. C.; Buxeraud, J.; Catamzano, G.; Endocrinology1990, 126, 1683; Sauvage, M. F.; Rousseau, A.; Marquet, P.; Dumeirain, F.; Raby, C.; Lachatre, G.; Toxicol. Appl. Pharmacol. 1999, 158, 125.
Submitted: September 3, 2009