A MODELING STUDY OF PATOS LAGOON (BRAZIL) FLOW RESPONSE TO
IDEALIZED WIND AND RIVER DISCHARGE: DYNAMICAL ANALYSIS
Renato M. Castelao1 & Osmar O. Moller Jr 2
1
College of Oceanic and Atmospheric Sciences Oregon State University
(104 COAS Admin Bldg, Corvallis OR, 97331-5503, USA) Corresponding author: [email protected]
2
Fundação Universidade Federal do Rio Grande Departamento de Física
(Caixa Postal 474, 96201-900 Rio Grande, RS, Brasil)
A
B S T R A C TA three-dimensional numerical model is used to investigate the Patos Lagoon flow response to idealized northeasterly winds and river inflow. North of Ponta da Feitoria, in the central lagoon, the main balance in the alongshore direction at steady state is between the surface stress and the pressure gradient, with a small contribution from the bottom stress. The alongshore variability in the pressure gradient is balanced by the Coriolis acceleration. In the cross-shore direction, the balance is nearly geostrophic, with deviations from that balance in the shallow regions, where the bottom stress term makes a significant contribution. Close to headlands, nonlinear terms are also important, leading to an additional increase in the cross-shore pressure gradient. Relaxation events were found to be important for seiche generation in the central lagoon. Close to the lagoon's mouth, nonlinear terms were found to be the major terms balancing the pressure gradient generated in response to the wind forcing. After the wind relaxation, the pressure gradient in the estuarine region is reversed, driving a landward flow. River inflow acts to dampen out the generation of seiches following wind relaxations. A river inflow Q = 2000 m3 s-1 was found to be sufficient to shut down the landward flow generated following
relaxation events.
R
E S U M OUm modelo numérico tridimensional é utilizado para investigar a circulação na Lagoa dos Patos em resposta aos ventos e à descarga fluvial. Ao norte da Ponta da Feitoria, o principal balanço na direção longitudinal é entre o estresse superficial e o gradiente de pressão, com pequena contribuição do estresse de fundo. A variabilidade longitudinal no gradiente de pressão é balanceada pela aceleração de Coriolis. Na direção transversal à lagoa, o balanço é aproximadamente geostrófico, com desvios deste balanço nas regiões rasas, onde o estresse de fundo contribui significamente. Os termos não lineares são importantes próximo aos cabos, causando um aumento adicional no gradiente de pressão na direção transversal. Eventos de relaxação são significativos na geração de seiches na parte central da lagoa. Próximo à desembocadura da lagoa, os termos não lineares são os principais termos contrapondo-se ao gradiente de pressão gerado pela ação dos ventos. O gradiente de pressão é revertido após a relaxação dos ventos, causando a entrada de água na lagoa. A descarga fluvial atenua a geração de seiches após a relaxação. Valores médios de descarga (Q = 2000 m3 s-1) são suficientes
para impedir a entrada de água na lagoa após a relaxação do vento.
Descriptors:Coastal lagoon, Wind driven currents, Relaxation, River discharge, Momentum balance, Numerical modeling, Patos Lagoon, Brazil.
Descritores: Laguna costeira, Correntes forçadas por ventos, Relaxação, Descarga fluvial, Balanço de momento, Modelagem numérica, Lagoa dos Patos, Brasil.
I
NTRODUCTIONThe Patos Lagoon is located in the southern Brazilian coast, between 30o and 32oS (Fig. 1). It is considered the largest choked coastal lagoon in the world (Kjerfve, 1986), being 250 km long, and having an average width of 40 km. Despite its large size, the lagoon is very shallow, with an average depth of 5 m.
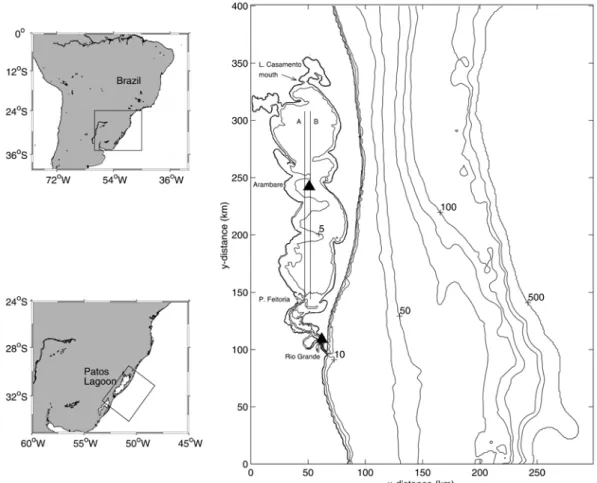
Fig. 1. The study area. Straight lines along the longitudinal axis of the lagoon are transects A and B. The locations close to Arambaré and Rio Grande where time series of momentum balance terms are analyzed are marked with triangles. Topographic contours shown are 1, 5, 10, 30, 50, 75, 90, 100, 150, 200 and 500 m. The box in the lower-left panel shows the model domain.
the area between Ponta da Feitoria and the mouth of the Lagoa do Casamento (Delaney, 1965). The lower and central areas are separated by a morphological step with local depth of less than 1 m, formed by sandy banks situated around Ponta da Feitoria (Moller et al., 2001) (Fig. 1).
Choked lagoons are mostly influenced by local winds (Kjerfve, 1986; Kjerfve & Magill, 1989). Northeasterly (NE) winds dominate throughout the year. Southwesterly (SW) winds have their importance increased during fall and winter as frontal systems become more frequent over this area (Moller et al., 2001). Typical wind speeds are between 3 and 5 m s-1 (Tomazelli, 1993). Tides are mixed but mainly diurnal, having a mean amplitude of 0.23 m (Moller et al., 2001). The mean freshwater discharge at the head of the lagoon is 2000 m3 s-1, with seasonal averages ranging from 700 m3 s-1 during summer to up to 3000 m3 s-1 in spring (Moller et al., 2001), although peaks
of 8000 and 12000 m3 s-1 can be observed during El Niño events (Moller, 1996).
gradient resulting from combined local and remote forcing effects with NE/SW winds driving seaward/landward flows. River discharge can also be important in the exchange. In extreme conditions of high-discharge, volumes of water equivalent to up to 7% of the lagoon volume can be flushed out in time intervals as short as 6 h (Fernandes et al., 2002).
The dynamical balances in the Patos Lagoon have been little discussed in the literature. Moller et al. (1996) used their two-dimensional results to analyze the balances in the central lagoon in quasi-steady state conditions when the system was forced by winds and weak river discharge. They found that a geostrophic balance holds in the cross-shore direction, both nearshore and at a mid-section. In the alongshore direction, they found a balance between the wind stress and the alongshore pressure gradient at a mid-section, with the bottom stress making a significant contribution nearshore. The pressure gradient was computed using the differences in the surface elevation between the extremes of the lagoon, thus representing an averaged pressure gradient. No description of the time evolution or the alongshore variability of the dynamical balances has been provided. Also, their analyses were restricted to the central lagoon, and did not include remote effects, as the surface elevation at the mouth of the lagoon was set to 0 m. The authors are not aware of any other study in which momentum balances in the Patos Lagoon have been analyzed.
In the present study, a three-dimensional numerical model is used to perform dynamic analyses of the circulation in response to the wind forcing followed by a relaxation event and river discharge. The basic dynamical response of a semi-enclosed shallow body of water to wind forcing is already known. We are then most interested in the alongshore variability of the dynamical balances and the dynamical response to temporal variations in the forcing (wind relaxation). We also extend the analysis to the estuarine region.
M
ODELC
ONFIGURATIONFor an in-depth description of the Princeton Ocean Model (POM) utilized here the reader is referred to Blumberg & Mellor (1987) and Mellor (2003). The vertical and horizontal viscosity coefficients are flow-dependent according to the level-2.5 turbulence closure model of Mellor & Yamada (1982) and the formulation of Smagorinsky (1963), respectively. The model domain extends 300 km in the cross-shore direction and 400 km in the alongshore direction (Fig. 1). The grid resolution is 1 km in both horizontal directions. The grid is rectangular and the
axes have been rotated to 37oN in order to better align with the coastline. In the vertical, 12 sigma levels are utilized with grid spacing that varies so that there is higher resolution in the upper part of the water column. The bottom topography is obtained from digitized data from the Brazilian Navy. Since we are only interested in the lagoon region, the maximum depth is set to 500 m in order to reduce the constraint on the time step. The time step for the baroclinic mode is 120 s, while the time step for the barotropic mode is 4 s. The Coriolis parameter f = -0.76 x 10⁻⁴ s-1 is constant.
The horizontal velocity v has components (u,v) corresponding to the cross-shore and alongshore velocities in the (x,y) directions, so that u is positive toward the east and v is positive toward the north. The depth-averaged velocities are denoted by V and (U,V). The boundary conditions are zero gradient for the surface elevation and Orlanski (1976) radiation conditions for U, V, u and v. For salinity, an upstream advection condition is used. The model is initialized with zero velocities, and the temperature is considered constant everywhere. The salinity is specified as linearly varying in the estuarine zone, in the range from 0 to 33, and a vertically well-mixed structure is adopted, as in Moller et al. (2001).
In the basic case experiment, a spatially uniform, time-dependent, northeasterly wind stress is applied. The wind stress magnitude is increased smoothly from 0 to 0.03 Pa (wind speed ~ 4 m s-1) over a period of 1 day and then held constant for the next 2 days. After that, the wind stress is decreased to 0 again over a period of 1 day, and then maintained at 0 for 6 more days, totaling 10 days of simulation. This time structure represents the spin up of a northeasterly wind event followed by a relaxation. Two more experiments were pursued using the same wind structure, but also considering the river discharge at the head of the lagoon. River inflows Q = 2000 and Q = 8000 m3 s-1 were imposed, representing periods of average and extreme discharges, respectively.
In order to determine the dynamics of the lagoon flow response to wind forcing and river inflow, the term balances in the depth-averaged momentum equations are examined, both in the cross-shore x and alongshore y directions. Those equations are written symbolically as
0
1 ( ) ()
= + − ∂ ∂ + − + ∂ ∂ D D x P fV NLX t U o x b o x s o
ρ
τ
ρ
τ
ρ
(1)0
1 ( ) ()
= + − ∂ ∂ + + + ∂ ∂ D D y P fU NLY t V o y b o y s o
ρ
τ
ρ
τ
where the terms are the acceleration, nonlinear advection plus the horizontal diffusion, Coriolis acceleration, pressure gradient, and surface and bottom stresses, respectively. In addition to the velocity components and the Coriolis parameter already defined, t is time, P is pressure, ρo is a constant reference density, (τs(x), τs(y)) and (τb(x), τb(y))
are the wind and bottom stress components in the (x,y) directions respectively, and D= η + H is the water depth, where H=H(x,y) is the undisturbed water depth and η is the free surface elevation.
N
UMERICALE
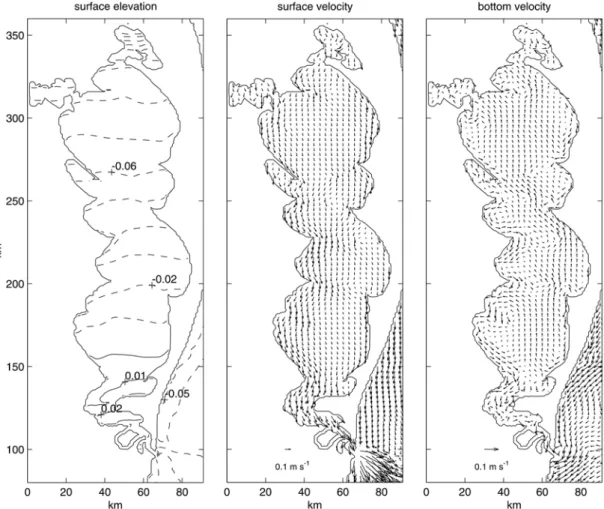
XPERIMENTSLagoon Flow Response to the Wind Event: the Basic Case General characteristics of the lagoon flow response to the NE wind event (no river discharge) may be seen in the plots of surface elevation, surface velocity and near-bottom velocity vector fields on day 3 (Fig. 2). The NE wind drives a southward flow in the surface layer, generating a relative rise in the surface level in the southern portion of the lagoon, and creating a depression in the northern part. Since no river inflow is considered in this simulation, there is a decrease in the mean surface elevation of the lagoon, as water is exported to the ocean. The surface flow is intensified close to the boundaries, particularly on the west side. In the near-bottom layer, a return flow in the deeper parts is spun up. Close to the boundaries, the bottom flow is in the same direction as the surface flow. In the estuarine region, the flow is directed offshore at all depths. This general description is consistent with results of Moller et al. (2001), and analogous to observations in Chesapeak Bay (Valle-Levinson et al., 2001).
Dynamics in the Central Lagoon
The time evolution of each of the terms in equations (1) and (2) at Arambaré (see Fig. 1 for location) is presented in Fig. 3. The local water depth is 6 m. The alongshore component of the surface stress (Fig. 3b) shows the time variability of the forcing. The spin up of the flow in response to the wind forcing occurs as follows. The southward wind generates a negative acceleration of the alongshore velocity V. The negative acceleration persists for the first 14 hours, when maximum depth-averaged southward velocities occur (see Coriolis term, Fig. 3a). The southward velocities help establish a negative alongshore pressure gradient which forces, on the other hand, a return flow close to the bottom (see also Fig. 2). The return flow generates a positive alongshore bottom stress and a decrease in the
magnitude of the depth-averaged velocity V. After day 1.1, the depth-averaged alongshore velocity V is positive and remains small, and the alongshore pressure gradient stays nearly constant. The result shows that the lagoon flow experiences only small accelerations after day 1.25 and is nearly in steady state after 2 days. After a steady state is reached, the alongshore balance at Arambaré is similar to the result found by Moller et al. (1996) for a mid-section. The major balance is between the surface stress and the pressure gradient. The magnitude of the bottom stress is much smaller than the magnitude of those two terms (Fig. 3b). In the x-component (Fig. 3a), the Coriolis term is balanced mostly by the cross-shore pressure gradient close to a geostrophic balance, again with some contribution from the bottom stress.
From day 3 to 4, the wind stress is decreased smoothly to zero and then maintained at zero after that. In response to the relaxation event, the alongshore velocity V accelerates northward, slightly intensifying the bottom stress, and decreasing the alongshore pressure gradient (Fig. 3b). After day 4, the temporal oscillations of the alongshore pressure gradient are balanced by local accelerations. The oscillations have a period of approximately 20 h, which is close to the natural period of oscillation of the lagoon (nearly 1 day; Moller, 1996). Seiches in the lagoon have been attributed to the combined effects of sea breeze and diurnal tide (Moller, 1996), and this result suggests that wind relaxation might also be important. The oscillations in the alongshore velocity V (see Coriolis term, Fig. 3a) persist for the 10 days of simulation, although their magnitude decreases significantly. Although V is positive at Arambaré before and after the relaxation event (Fig. 3a), there is an important difference between these periods. Before the relaxation event, surface currents are southward (v at surface < 0) and water close to the bottom flows northward (v at bottom > 0; Fig. 2). After the relaxation event, currents are northward (but weaker) throughout the water column at this location. A discussion of this is presented in the next section.
Throughout and after the relaxation event, terms in the x-momentum equation remain close to a geostrophic balance (Fig. 3a). There is a negative acceleration of U between days 3 and 3.6, pushing water toward the western boundary of the lagoon and intensifying the negative cross-shore pressure gradient following the relaxation event. The nonlinear terms remain very small throughout the period.
Fig. 2. Surface elevation (m), surface and bottom velocity vectors (m s-1) on day 3 for the basic case experiment. Data
density has been reduced by a factor of nine from the model grid, for clarity. Negative (positive) values of η are indicated by dashed (solid) contours.
scale of the forcing (from 3 to 15 days; Moller et al., 2001). It is important to realize that the current simulation does not include the effect of tides or sea breeze. It is, thus, useful to investigate alongshore variations in the terms in equations (1) and (2) during steady state. A plot (Fig. 4a) of the terms in the cross-shore depth-averaged momentum equation (1) as a function of alongshore distance along the longitudinal transect A (see Fig. 1 for location) averaged over day 3
shows that the Coriolis term is small over most of the transect. The exceptions are the extreme southern part of the transect (south of km 155, where both the surface and the bottom flow are southward, making V < 0) (see Fig. 2) and over the shallow banks around km 202 and km 228. North of km 240, V is positive. When the lagoon flow is nearly at steady state, there is a net return flow in that deeper region, which
Fig. 3. Time series of terms in the depth-averaged cross-shore [a, equation (1)] and alongshore [b, equation (2)] momentum equations (in m s-2 multiplied by 106) from location close to Arambaré for the basic case experiment.
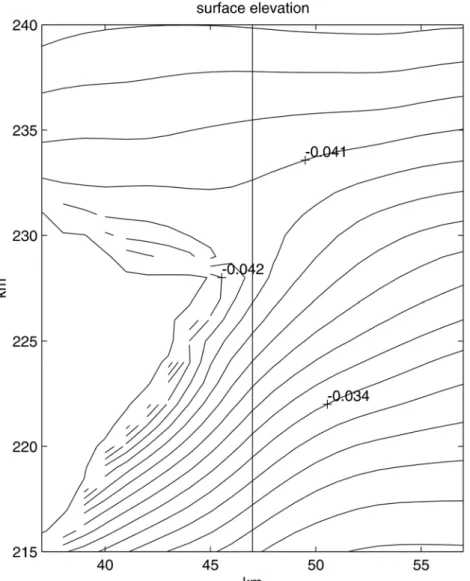
direction even nearshore. The nonlinear terms are negative over the banks, leading to an additional ageostrophic increase in the cross-shore pressure gradient. As a consequence of this increase, a local minimum in surface elevation in the vicinities of the
headlands develops (Fig. 5).
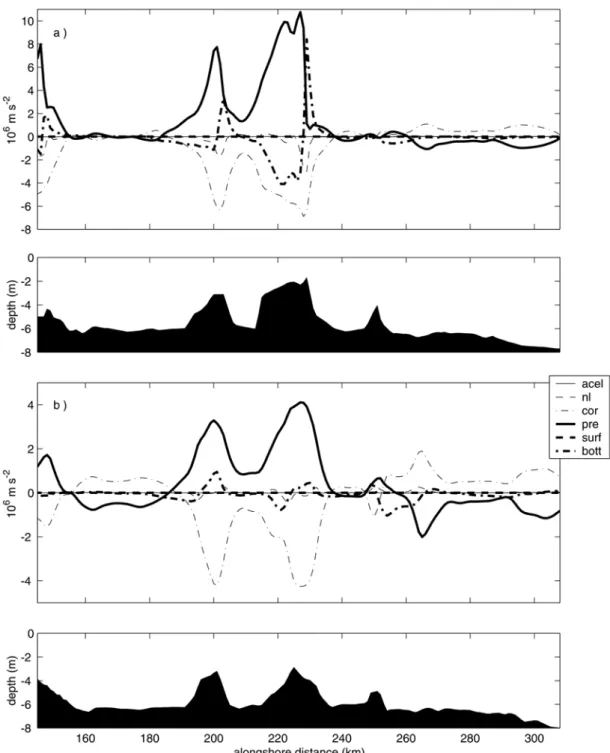
Fig. 4. Terms in the depth-averaged cross-shore momentum equation (1) (in m s-2, averaged over 24 h, multiplied by
106) as a function of distance y along transect A (a) and B (b) on day 3 for the basic case experiment. Note that vertical
a small contribution to the cross-shore momentum balance (except around km 200, km 220, and km 254), and the flow is nearly geostrophic. This is consistent with the time evolution of the terms in equation (1) at Arambaré (Fig. 3a).
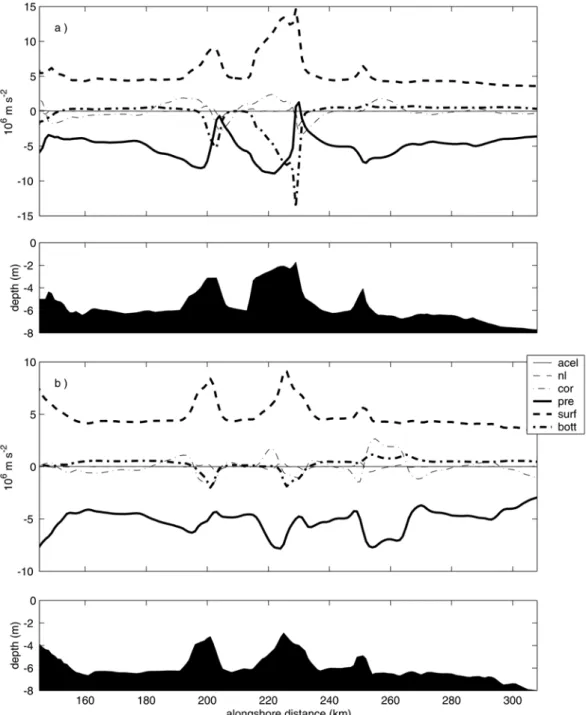
The terms in the alongshore depth-averaged momentum equation (2), again as a function of alongshore distance along the longitudinal transect A (see Fig. 1 for location) (Fig. 6a), show that the dynamics described at Arambaré on day 3 hold over most of the central lagoon, except in the shallower areas. The existence of a local minimum in surface elevation near the headlands (Fig. 5) strongly
diminishes the alongshore pressure gradient there, even reverting it around km 230. At these locations, the bottom stress is the major term balancing the surface stress. The Coriolis term also changes sign near the banks, as the nearshore currents turn around the headlands. At transect B (Fig. 6b), where the banks are not as shallow as at transect A, the bottom stress term contribution in the momentum balance is smaller, and the main balance is between the pressure gradient and the surface stress, in agreement with the findings of Moller et al. (1996). It is interesting to note that the
alongshore pressure gradient has significant alongshore variability (Fig. 6a,b). The amplitude of the variations in the alongshore pressure gradient is similar to the magnitude of the Coriolis term (especially at transect B), and both terms are well
correlated (correlation coefficient is -0.91 for transect A, -0.70 for transect B). Therefore, the mean alongshore pressure gradient is set up by the surface stress, while the alongshore variations around the mean value are balanced by the Coriolis acceleration.
Fig. 6. Terms in the depth-averaged alongshore momentum equation (2) (in m s-2, averaged over 24 h, multiplied by 106 ) as
Dynamics in the Lagoon's Entrance Channel In order to investigate the dynamics that control the exchange of water between the lagoon and the shelf, the time evolution of terms in equations (1)
and (2) at Rio Grande (H = 6 m, see Fig. 1 for location) are presented in Figure 7. Due to the orientation of the channel, both components U and V make a significant contribution to the exchange.
The local surface stress (Fig. 7b) seems to have little influence on the alongshore depth-averaged momentum balance. The largest term after the spin up is the pressure gradient, which is generated by the elevation in the surface level in the southern part of the central lagoon, and the depression in the level in the coastal region, in response to upwelling favorable winds (Fig. 2). The lagoon’s morphology probably contributes to generate the large pressure gradient, as the cross-sectional area in the estuary decreases toward the ocean. The pressure gradient is also an important contribution to the cross-shore momentum balance (Fig. 7a). The pressure gradient drives a negative ∂V/∂t and a positive ∂U/∂t, i.e., accelerates the flow toward the ocean. The acceleration of the flow drops to nearly zero around day 1.25. After that, the alongshore pressure gradient and the surface stress are balanced by the nonlinear, the Coriolis, and the bottom stress terms (Fig. 7b). While advection is small in the central lagoon (except in the vicinity of the headlands), it is the largest term balancing the alongshore pressure gradient in the entrance channel until day 3.5. The alongshore pressure gradient decreases continuously from day 1 to 3. As water is exported to the ocean, the surface elevation difference between the estuarine region and the ocean decreases, reducing the pressure gradient. In the x-momentum equation, the Coriolis term and the pressure gradient are both negative, and are balanced by bottom stress and, most importantly, by nonlinear terms. A similar simulation, but considering the entire domain to have constant salinity, reveals that the inclusion of stratification greatly increases the importance of the nonlinear terms. In the homogeneous case, the major term balancing the cross-shore pressure gradient is the bottom stress.
After day 3 (Fig. 7), when the wind relaxes, there is an intense drop in the pressure gradient, which is accompanied by a drop in the outward velocities (∂V/∂t > 0, ∂U/∂t < 0). By day 3.7, the pressure gradient is reversed, and water is pumped into the lagoon (see Coriolis term, Fig. 7a,b). As the wind relaxes, the magnitude of the alongshore pressure gradient in the central lagoon also decreases (Fig. 3b), lowering the surface elevation in the southern part of the lagoon. The mean surface elevation of the lagoon decreases as water is exported to the ocean throughout the first 3 days of wind forcing, and it is smaller than the surface elevation at the mouth of the lagoon by day 3.7. This reverts the pressure gradient in the estuarine region, driving a landward flow (Fig. 8). The landward flow weakens with time, as the level of the lagoon rises and the pressure gradient decreases. This is the mechanism responsible for driving northward flow at Arambaré throughout the water column following the relaxation event, as described in the
previous section. This result is not dependent on the inclusion of stratification, as a simulation considering a homogeneous ocean produces a similar effect. Therefore, water can be pumped into the lagoon even in the absence of southwesterly winds.
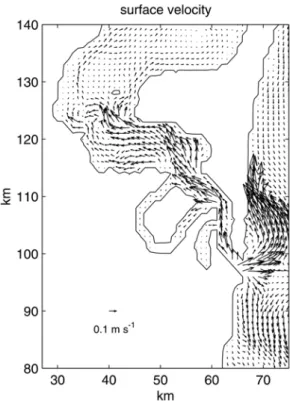
Fig. 8. Surface velocity vectors (m s-1) in the estuarine region on day 4 for the basic case experiment.
The Influence of River Discharge
Freshwater discharge dominates the circulation in the Patos Lagoon during high flood period (Moller et al., 2001). Two experiments were pursued, considering river inflows Q = 2000 m3 s-1 (average discharge experiment) and Q = 8000 m3 s-1 (high discharge experiment), in order to examine how the river discharge modifies the momentum balance in the lagoon.
increases. The river-induced currents (southward) tend to cancel out the return flow generated in response to the alongshore pressure gradient (Moller et al., 2001), decreasing the bottom stress term as compared to the basic case experiment after day 1. For the high discharge case (Fig. 9d), that term even changes sign, as the river-induced currents overcome the return flow. Also evident is a stronger negative Coriolis term
throughout most of the simulation, which helps the weaker alongshore pressure gradient balancing the surface stress. Since U > 0, water is pushed toward the eastern boundary of the lagoon, keeping the cross-shore pressure gradient positive until day 3 for both river discharges (Fig. 9a,c). In these cases, the depth-
Fig. 9. Time series of terms in the depth-averaged cross-shore [(a,c), equation (1)] and alongshore [(b,d), equation (2)] momentum equations (in m s-2 multiplied by 106 ) from location close to Arambaré, for simulation considering Q
Fig. 9c,d. Cont.
averaged velocities at Arambaré are southward during the whole period before the relaxation (see Coriolis term, Fig. 9a,c). The positive cross-shore pressure gradient occurs everywhere along transects A and B for high discharges (not shown), even in the deeper parts, in contrast to the basic case experiment. This
averaged northward flow and negative cross-shore pressure gradient (Fig. 9a), but depth-averaged velocities persist southward before the alongshore pressure gradient reverses if the river inflow is large (Fig. 9c). The behavior after the surface stress vanishes is very different from the situation in which no river discharge was imposed. The generation of seiches in the lagoon in response to the wind relaxation is attenuated with increasing river discharge and, in the high discharge experiment, is not enough to revert the positive alongshore pressure gradient caused
by river inflow raising the level in the northern part of the lagoon. In that case, the pressure gradient is balanced by the bottom stress and the Coriolis term (Fig. 9d). The time variability in the pressure gradient causes alongshore accelerations, modulating the southward flow without ever actually reverting it (Fig. 9a,c).
In the estuarine region, the pressure gradient remains approximately constant between days 1 and 3 for the average discharge experiment (Fig. 10 a,b), as
Fig. 10. Time series of terms in the depth-averaged cross-shore [(a,c), equation (1)] and alongshore [(b,d), equation (2)] momentum equations (in m s-2 multiplied by 106 ) from location close to Rio Grande, for simulation considering Q = 2000 (a,b)
Fig. 10c,d. Cont.
the river inflow prevents the decrease in the mean surface elevation of the lagoon that was observed in the basic case experiment. There is a significant drop in the pressure gradient following the wind relaxation, but it does not change sign. The depth-average velocities U and V are weakly outward (U > 0; V < 0)
around day 4. A river discharge Q = 2000 m3 s-1 is, therefore, sufficient to eliminate the reversal of the pressure gradient following wind relaxations.
of the lagoon rises from day 1 to 3, increasing the pressure gradient in the estuarine region. In fact, there is only a small drop in the pressure gradient (both components) during the relaxation event, but it continues to increase during the remainder of the simulation. By day 10, an equilibrium state is not yet reached, and the major terms balancing the pressure gradient are the bottom stress and nonlinear advection.
S
UMMARY ANDC
ONCLUSIONSA primitive equation model is used to study the dynamic processes that govern the circulation in the Patos Lagoon and the exchanges with the coastal ocean. The description of the response of the lagoon flow to northeasterly winds is consistent with the literature, i.e., southward flow in a surface layer and a return flow close to the bottom, intensification of the velocities along the western margin, elevation of the surface level at Ponta da Feitoria and a depression in the northern portion of the central lagoon. In the estuarine region, an outflow is generated at all depths. So far, only average dynamical balances in the central lagoon during quasi-steady state conditions have been discussed (Moller et al., 1996). This is the first time a three-dimensional model is used to study the time evolution and the alongshore variability of the dynamical response of the lagoon to a wind relaxation event and river discharge. We also extend the region of analysis to include the estuarine area.
Analysis of the terms in the depth-averaged momentum equations shows that, during steady state, the main balance in the x-momentum equation in the deeper parts of the central lagoon is between the pressure gradient and the Coriolis term in a nearly geostrophic balance, in agreement with Moller et al.’s (1996) results. In contrast to their results, we found that the bottom stress makes a significant contribution to the momentum balance nearshore. Close to headlands, the nonlinear terms are also significant and act together with the bottom stress to cause an increase in the cross-shore pressure gradient. These dynamics cause localized minima in the surface elevation field around the headlands. In the alongshore momentum balance, an alongshore pressure gradient is sustained by the surface stress, with a small contribution from the bottom stress term. Alongshore variability in the pressure gradient term is well correlated to variability in the Coriolis term, suggesting that the modulations are in geostrophic balance. The results suggest that wind relaxation events might be important for seiche generation in the central lagoon, as oscillations with period close to the natural period of oscillation of the system are reported.
In the estuarine region, a strong pressure gradient is set up by the combined effect of local and remote winds, and that is the main force driving the flow toward the ocean (Moller et al., 2001). Nonlinear advection terms make a significant contribution, balancing the pressure gradient in the estuarine region along with the bottom stress term. After the wind relaxation, the pressure gradient in the estuarine region reverses, as the mean surface elevation of the lagoon drops significantly due to water being exported to the ocean throughout the first 3 days of simulation. This drives a landward flow for the remainder of the simulation. This is the first time this mechanism, in which water can be pumped into the lagoon even in the absence of southwesterly winds, is described for the region. We believe this mechanism might have important implications for larvae transport.
River discharge changes the momentum balance in the lagoon, increasing the pressure gradient and the outward flow in the entrance channel. In the central lagoon, the major effect of the river inflow is to establish a positive cross-shore pressure gradient, in agreement with the two-dimensional results of Fernandes et al. (2002). Oscillatory motions generated after wind relaxation are attenuated by the river inflow, and are not sufficient to cause the flow to revert. During periods of average discharge, the pressure gradient in the estuarine region remains nearly constant before a significant drop in response to the relaxation event. A river discharge Q = 2000 m3 s-1 is enough to shut down the reversal of the pressure gradient in the estuarine region following wind relaxations. Under high river discharge conditions, the pressure gradient between the estuary and the shelf continues to increase after the wind relaxation, as the level of the lagoon continues to rise due to river inflow.
Finally, it should be stated that tidal forcing has not been considered in this study. The astronomical tides are filtered at the entrance channel (Moller et al., 1996), but might be important in the estuarine region, close to the ocean. Due to nonlinear interactions of the tides, residual velocities could be generated as well. This could contribute to the exchange of water between the lagoon and the ocean. The investigation of the role of tidal forcing in the dynamical balances in the Patos Lagoon estuarine region is subject of future research.
A
CKNOWLEDGMENTS200147/01-3 (RC) and 551058/02-1 (OM)) and by the Inter American Institute for Global Change Research (IAI) through project SACC (CRN-061).
R
EFERENCESBlumberg, A. F. & Mellor, G. L. 1987. A description of a three-dimensional coastal ocean circulation model. In: Nihoul, J. C. J. & Jamart, B. M. eds. Three-Dimensional Models of Marine and Estuarine Dynamics. Elsevier Oceanography Series, 45:55-88.
Castello, J. P. 1985. La ecologia de los consumidores del estuario de la Lagoa dos Patos, Brasil. p. 386–406. In: Yanez-Arancibia, A. ed. Fish Community Ecology in Estuaries and Coastal Lagoons: Towards an Ecosystem Integration. Mexico, UNAM-ICML. 654p.
Closs, D. 1962. Foraminíferos e tecamebas da Lagoa dos Patos (RGS). Boletim da Escola de Geologia, 11:1–51. Delaney, P. 1965. Fisiografia e geologia de superfície da
planície costeira do Rio Grande do Sul. Publicação especial da Escola de Geologia de Porto Alegre, 6:1–105. Fernandes, E. H. L.; Dyer, K. R.; Moller, O. O. &
Niencheski, L. F. H. 2002. The Patos Lagoon hydrodynamics during an El Niño event (1998). Continent. Shelf. Res., 22:1699–1713.
Kjerfve, B. 1986. Comparative oceanography of coastal lagoons, p. 63–81. In: Wolfe, D.A. ed. Estuarine Variability. New York, Academic Press. 509p.
Kjerfve, B. & Magill, K. E. 1989. Geographic and hydrographic characteristics of shallow coastal lagoons. Mar. Geol., 88:187–199.
Malaval, M. B. 1922. Travaux du Port et de la Barre de Rio Grande, Brésil. Paris, Eyrolles Editeurs.
Mellor, G. L. 2003. User's guide for a three-dimensional, primitive equation numerical ocean model. Report: Program in Atmos. and Ocean Sci., Princeton University, Princeton, New Jersey. 53p. Available online at http://www.aos.princeton.edu/WWWPUBLIC/htdocs.pom/ Mellor, G. L. & Yamada, T. 1982. Development of a
turbulence closure model for geophysical fluid problems. Rev. geophys. Res., 20:851–875.
Moller, O. O.; Castaing, P.; Salomon, J. C. & Lazure, P. 2001. The influence of local and non-local forcing effects on the subtidal circulation of Patos Lagoon. Estuaries, 24(2):297–311.
Moller, O. O.; Lorenzzetti, J. A.; Stech, J. L. & Mata, M. M. 1996. The summertime circulation and dynamics of Patos Lagoon. Continent. Shelf. Res., 16:355–351.
Orlanski, I. 1976. A simple boundary condition for unbounded hyperbolic flows. J. comp. Phys., 21:251– 269.
Smagorinsky, J. 1963. General circulation experiments with primitive equations. I. The basic experiment. Mon. Weath. Rev., 91:99–164.
Tomazelli, L. J. 1993. O regime dos ventos e a taxa de migração das dunas eólicas costeiras do Rio Grande do Sul, Brasil. Pesquisas, 20:18–26.
Valle-Levinson, A.; Wong, K-C. & Bosley, K. T. 2001. Observations of the wind-induced exchange at the entrance to Chesapeake Bay. J. mar. Res., 59:391-416.
Sources of Unpublished Material
Moller, O. O. 1996. Hydrodynamique de La Lagune dos Patos. Mésures et modelisation. DSc. Thesis. Université Bordeaux I, France.
![Fig. 3. Time series of terms in the depth-averaged cross-shore [a, equation (1)] and alongshore [b, equation (2)]](https://thumb-eu.123doks.com/thumbv2/123dok_br/19001599.463926/6.892.137.750.122.859/time-series-terms-depth-averaged-equation-alongshore-equation.webp)
![Fig. 7. Time series of terms in the depth-averaged cross-shore [a, equation (1)] and alongshore [b, equation (2)]](https://thumb-eu.123doks.com/thumbv2/123dok_br/19001599.463926/10.892.138.748.188.915/time-series-terms-depth-averaged-equation-alongshore-equation.webp)
![Fig. 9. Time series of terms in the depth-averaged cross-shore [(a,c), equation (1)] and alongshore [(b,d), equation (2)] momentum equations (in m s -2 multiplied by 10 6 ) from location close to Arambaré, for simulation considering Q](https://thumb-eu.123doks.com/thumbv2/123dok_br/19001599.463926/12.892.154.726.235.922/averaged-equation-alongshore-equations-multiplied-arambaré-simulation-considering.webp)
![Fig. 10. Time series of terms in the depth-averaged cross-shore [(a,c), equation (1)] and alongshore [(b,d), equation (2)]](https://thumb-eu.123doks.com/thumbv2/123dok_br/19001599.463926/14.892.154.739.302.932/time-series-terms-depth-averaged-equation-alongshore-equation.webp)
