Article
Printed in Brazil - ©2012 Sociedade Brasileira de Química0103 - 5053 $6.00+0.00
A
*e-mail: [email protected]
Oncocalyxone A: Electrochemical, Spectroscopic Investigation and Studies of Its
Interaction with DNA, Nucleobases and
N-
Acetylcysteine
Cicero de O. Costa,a,b Erivaldo de O. Costa,a,b Fabrícia da R. Ferreira,a,b Luciana da S. Viana,a
Leonardo V. da Silva,a,b Francisco de A. dos Santos Silva,a,b Fabiane C. de Abreu,a
Isis M. Figueiredo,a Waldomiro Pinho Jr.,a,b Edson de S. Bento,a Telma L. G. Lemos,c
Otília D. L. Pessoa,c Benjamin Aguilera-Venegas,d Ester Norambuena,d
Claudio Olea-Azard and Marília O. F. Goulart*,a,b
aInstituto de Química e Biotecnologia, Campus A.C. Simões, Av. Lourival Melo Mota, s/n,
Tabuleiro dos Martins, 57072-970 Maceió-AL, Brazil
bInstituto Nacional de Ciência e Tecnologia (INCT), Bioanalítica
cDepartamento de Química Orgânica e Inorgânica, Universidade Federal do Ceará,
CP 12200, 60021-970 Fortaleza-CE, Brazil
dDepartamento de Química Inorgánica y Analítica, Facultad de Ciencias Químicas y Farmacéuticas,
Universidad de Chile, Casilla 233, Santiago, Chile
A formação de espécies paramagnéticas a partir da oncocalixona A em meio aprótico foi confirmada pela realização de experimentos eletroquímicos in situ em conjunto com ressonância de spin eletrônico (E-ESR). A alta deslocalização do radical gerado no primeiro potencial de redução está claramente evidenciada pelo acoplamento hiperfino do H-9 com a maior constante de acoplamento, além dos acoplamentos nas posições H-3 (próximo à quinona) e H-7 (distante do núcleo quinônico). Em meio prótico, além dos experimentos de dependência com o pH, oncocalixona A mostrou-se DNA-reativa por meio de experimentos eletroquímicos com sensores de DNA. Sua reação com N-acetilcisteína, com caracterização estrutural dos produtos de adição, evidencia sua habilidade como aceptor de Michael. Ambos os aspectos são importantes em termos de atividades biológicas/farmacológicas e indicam os presentes modelos como ferramentas importantes na avaliação de compostos biologicamente ativos.
The formation of paramagnetic species from oncocalyxone A in aprotic medium was confirmed by performing in situ electrochemical-electron spin resonance (E-ESR) experiments. The high delocalization of the radical generated at the first reduction potential is clearly evidenced by the hyperfine coupling of H-9 with the larger coupling constant, besides the couplings at the H-3 (close to quinone) and H-7 (far from the quinone nucleus) positions. In protic medium, together with pH dependence experiments, oncocalyxone A showed to be DNA-reactive through experiments with DNA sensors. Its reaction with N-acetylcysteine, with structural characterization of the addition products, proved its ability as Michael acceptor. Both aspects are important in terms of biological/ pharmacological activities and indicate the present models as important tools in the screening of biologically active compounds.
Keywords: oncocalyxone A, spectroelectrochemical-electron spin resonance, DNA interaction,
N-acetylcysteine, Michael acceptor
Introduction
Oncocalyxone A (rel-8α -hydroxy-5-hydroxymethyl-2 - m e t h o x y - 8 a ,β m e t h y l 7 , 8 , 8 a , 9 t e t r a h y d r o
of platelet activation.3,4,5-8 Oncocalyxone A also shows differential antitumor activity against the murine tumors Ehrlich carcinoma, sarcoma 180 and L1210 leukemia.8
In general, two major mechanisms of quinone cytotoxicity have been proposed: stimulation of oxidative stress and alkylation of cellular nucleophiles, which encompass large range of biomolecules,9 such as DNA and some enzymes, e.g., topoisomerase and protein tyrosine phosphatases, mainly those with thiol groups.10
Oncocalyxone A, a para-benzoquinone with an
extended conjugated dienone scaffold, may possibly function as a reactive Michael acceptor toward nucleophilic sites on proteins, for example, cysteinyl thiol groups, or on DNA.11 In this case, its pro-oxidant activity (enhancer of oxidative stress)12 might increase once thiols are recognized as the main class of biologically important antioxidants, behaving as reducing agents.
The studies of the electrochemical properties of oncocalyxone A, as well as the analysis of its reduction products, either a semiquinone or a hydroquinone, are essential to the understanding of its biological activity and metabolism once it can mimic biological cycles of oxidation and reduction.13 The cyclic voltammetric technique (in aprotic medium) provides a very adequate procedure to evaluate the stability of electrogenerated radical anions, and together with spectroscopic methods, in particular those used to analyze free radicals (e.g. electron spin resonance, ESR), would give important structural information.14 In protic medium, electrochemical studies on DNA and also in the presence of biologically important thiols like N-acetylcysteine (NAC) can be performed15 to test the Michael acceptor nature of this quinone,10,11 which would favour its pro-oxidant nature, with relevance
in antitumor activity.12,16,17 More specifically, the use of NAC is relevant once it has been used as tools for investigating the role of ROS (reactive oxygen species) in numerous biological and pathological processes.16,17 NAC inhibits the activation of c-Jun N-terminal kinase, p38 MAP kinase, redox-sensitive activating protein-1 and nuclear factor kappa B transcription factor activities, regulating expression of numerous genes. NAC can also prevent apoptosis and promote cell survival by activating extracellular signal-regulated kinase pathway, a concept useful for treating certain degenerative diseases. NAC directly modifies the activity of several proteins by its reducing capacity. Despite its non-specificity, ability to modify DNA and multiple molecular modes of action, NAC has therapeutic value for reducing endothelial dysfunction, inflammation, fibrosis, invasion, cartilage erosion, acetaminophen detoxification and transplant prolongation.15
The electrochemical detection of nucleic acid (NA) association with low molecular mass compounds represents an important aspect of studies in drug discovery and environmental processes. DNA biosensors serve as effective screening tools for in vitro tests of NA interactions. Cyclic voltammetry (CV) provides a useful complement to the other biophysical methods of investigation such as UV-Visible spectroscopy and fluorescence studies. When the redox active groups are not amenable to such methods either due to weak absorption bands or because of overlap of electronic transitions with those of DNA molecule, they can be potentially studied via voltammetric techniques.18,19 As such, the present work aims to investigate the spectroelectrochemical-electron spin resonance (E-ESR) behavior of oncocalyxone A (in aprotic medium) and its possible interaction with DNA, NA and NAC (in protic medium) using electrochemical methods. The present data will be compared with reported biological activities.
Experimental
Chemicals and solutions
All used chemicals were of analytical grade. dsDNA (double-stranded DNA) and ssDNA (single-stranded DNA) calf thymus, guanine, adenine, N-acetylcysteine, polyguanylic and polyadenylic acids were obtained from Sigma-Aldrich (Brazil). Oncocalyxone A (Figure 1) was isolated from heartwood of A. oncocalyx collected in June 2005 at Pentecoste County, Ceará State, Brazil. The plant was identified by Professor Edson P. Nunes, and a voucher specimen (No. 18459) is deposited at the Herbarium Prisco Bezerra (Escola de Agronomia do Ceará, EAC) of the Departamento de Biologia, Universidade Federal do Ceará
(Fortaleza City, Ceará State, Brazil). The extract preparation, methods of isolation and chemical characterization were previously described by Pessoa et al.1,2 The structure of this secondary metabolite was unambiguously established by spectrometric techniques such as UV-Vis, infrared, mass spectrometry and a combination of 1D and 2D nuclear magnetic resonance (NMR) methods.1-3
Acetic acid, sodium acetate, monobasic sodium phosphate, dibasic sodium phosphate, absolute ethanol, sodium hydroxide and hydrochloric acid were acquired from Merck (Rio de Janeiro, Brazil). Acetate buffer and other solutions were prepared with water purified in a Milli-Q Millipore system and the pH values (4.5 and 7.0) of the buffer were determined with a pH-meter Quimis Q400A model or a MARCONI MAPA200 series 0113992 pH-meter with a combined glass electrode. All experiments were performed at room temperature (25 + 1oC).
Electrochemical methods
Cyclic voltammetry and differential pulse voltammetry (DPV) experiments were performed with a conventional three-electrode cell in an Autolab PGSTAT-30 potentiostat (Echo Chemie, Utrecht, the Netherlands) coupled to a PC microcomputer, using GPES 4.9 software. The working electrode was a BAS (Bioanalytical Systems, West Lafayette, IN, USA) glassy carbon electrode (GCE) of 3 mm diameter, the counter electrode was a platinum coil, and the reference electrode was Ag|AgCl, Cl−
(0.1 mol L-1), all contained in one-compartment
electrochemical cell with a volumetric capacity of 10 mL, using a volume of 5 mL. A stock solution (10 mmol L-1) of oncocalyxone A was prepared by dissolving 0.75 mg in 250 µL of ethanol + acetate buffer solution (20%). For DPV measurements, the pulse amplitude was 50 mV, the step potential 10 mV and the scan rate 10 mV s-1.
In CV experiments, the scan rate was varied from 10 to 500 mV s-1. Argon was used to degas the solution, and the solution was covered with an argon blanket during the experiments.
The electrolysis of oncocalyxone A was carried out. The current was electronically integrated. Conventional glass cells (50 mL) were used with anode and cathode compartments separated by medium porosity sintered glass. The electrolyte was pre-electrolyzed at −2.0 V until the background current reached a low steady value. The following description is typical for electrolysis procedure and methods for work-up and isolation of products. Oncocalyxone A (1) (0.020 g, 0.066 mmol), dissolved in 33 mL of DMF + TBABF4 (0.1 mol L
−1) was
electrolyzed on a carbon felt cathode at a potential held at
−1.4 V (after the second reduction potential), in the presence of 1 mL of distilled acetic anhydride (17.3 mmol).20 The electrolysis was followed by the change of color (deep red to colorless and by CV on GCE). After consumption of 2 mol electrons mol−1, the cell current reached a residual current (less than 2% from Ii). The addition of water, followed by ether extraction and washing with Na2CO3 (5%) and HCl (10%) led to a complex reactional mixture. The product resulting from reductive acetylation was obtained together with tributylamine, from the Hoffman elimination of the supporting electrolyte. 1H NMR revealed the reduced product with the evidence of a singlet (1H) at 6.56 ppm corresponding to the aromatic hydrogen and two signals at 2.07 (3H) and 2.34 (6H) related to two aromatic and one aliphatic (side chain) acetyl groups produced in the process. The other signals were similar to the ones present in oncocalyxone A.
The oxidation procedure was performed, using 5 mg (0.016 mmol) of oncocalyxone A in phosphate buffer + ethanol (4:1) at an apparent pH 7 (with an ethanol trap), during the electrolysis with the oxidation potential held at 1.4 V. The oxidation peak did not disappear and the cell current did not decrease. The oxidized compound was still electroative, with an oxidation peak at a less positive potential and its structural characterization was not possible.
In all reported experiments, the results obtained with electrodes in the presence of oncocalyxone A were compared with those obtained with reference blank electrodes operated under the same conditions.
Preparation of ssDNA
glass tube in a boiling water bath for 1 h, followed by neutralization with 1 mol L-1 NaOH. The solution was completed using acetate buffer, containing 20% EtOH.21
Interaction of ssDNA with oncocalyxone A
Freshly prepared ssDNA solution was added to the cell and single-scan DPV experiments were conducted in the range 0 to +1.4 V vs. Ag|AgCl, Cl− (0.1 mol L-1), using the following DPV parameters: pulse amplitude of 50 mV, step potential of 10 mV, scan rate of 10 mV s-1 and modulation time of 50 ms. The procedure was earlier described.21 The GC electrode was inserted into a solution containing oncocalyxone A(with different concentrations:
from 10 to 40 mol L-1) and ssDNA, and the DPV
experiment was repeated.21,22 A clean GC electrode was
also employed in DPV experiments with a 40 mol L-1
solution of oncocalyxone A alone, and the current of the peak (oncocalyxone A oxidation) was used for comparison purposes. All results of oncocalyxone A-ssDNA experiments were compared to the negative control (1 mL of EtOH/acetate buffer solution (20%), pH 4.5, without oncocalyxone A).
Interaction of adenine (A) and guanine (G) with oncocalyxone A This investigation was held according to an already described procedure.21 The GC electrode was inserted into a solution of guanine (oxidation peak at +0.745 V vs. Ag|AgCl, Cl− (0.1 mol L-1)) to which oncocalyxone A was added to attain final concentrations of 0.010, 0.020, 0.040, 0.060, 0.080, 0.100 and 0.200 mmol L-1. Following each addition of oncocalyxone A, a new DPV scan was acquired immediately.
The same steps used to prepare a guanine solution were used to prepare an adenine solution.21 One peak corresponding to the oxidation of the base adenine appeared at potential of +0.998 V vs. Ag|AgCl, Cl− (0.1 mol L-1). DPV experiments with adenine were conducted as described for guanine (above).
Interaction of polyadenylic and polyguanylic acids with oncocalyxone A
A freshly prepared solution containing the potassium salt of polyguanylic acid (purchased from Sigma Aldrich, Brazil) (polyG, 0.0010 g) dissolved in 10 mL of acetate buffer was added to the cell and single-scan DPV experiments were conducted in the range 0 to +1.4 V vs. Ag|AgCl, Cl− (0.1 mol L-1), as previously described.21 One peak corresponding to the oxidation of the heterocyclic moiety of the polyG appeared at potential of +0.997 V. The GC electrode was inserted into a solution of polyG to which oncocalyxone A was
added to attain final concentrations of 0.010, 0.020, 0.040, 0.060, 0.080, 0.100 and 0.200 mmol L-1. Following each addition of oncocalyxone A, a new DPV scan was acquired immediately.
Owing to the insufficient solubility of polyadenylic acid (polyA) in acetate buffer, the potassium salt of the analyte (3.0 mg) was dissolved in 1.0 mL of hydrochloric acid (1.0 mol L-1), by heating in a sealed glass tube in a boiling water bath for 30 min. Following digestion, a process that leads to the removal of adenine bases through the cleavage of purine glycoside bonds,the solution was neutralized with 1.0 mL of sodium hydroxide (1.0 mol L-1) and diluted to 10 mL with acetate buffer. One peak corresponding to the oxidation of the heterocyclic moiety of the polyA appeared at potential of +1.27 V. DPV experiments were conducted as described above.
All experimental curves were firstly baseline corrected using the moving average application with a step window of 5 mV included in GPES version 4.9 software. This mathematical treatment improves the visualization and identification of the nucleobases oxidation peaks.22
Interaction of NAC with oncocalyxone A
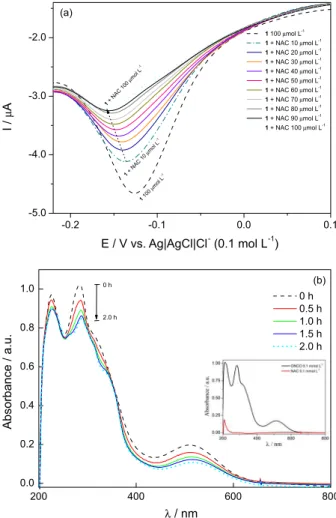
Absorbance spectra of oncocalyxone A (1 × 10⁻⁴ mol L-1) with or without NAC (1 × 10⁻⁴ mol L-1) were determined using the UV-Vis spectrophotometer (MultiSpec-1501, Shimadzu, Japan), at λ = 510 nm. Reaction mixtures were prepared by addition of NAC to acetate buffer, 0.1 mol L-1, pH 7.0 (950 mL) to which oncocalyxone A (in ethanol, 50 mL) was added (final ethanol concentration, 5% v/v). A sample was collected at time 0 and after 30 min, until stabilization of the spectra.
Square wave voltammetry (SWV) was conducted in phosphate buffer 0.1 mol L-1 at pH 7.0, using a frequency of 50 Hz, amplitude of 25 mV, with successive additions of NAC. After each addition, the solution was degassed for 10 min.
1H NMR spectroscopy was also used to follow
the reaction between oncocalyxone A and NAC, as described: in a resonance tube, 5 mg (0.016 mmol) of oncocalyxone A and 4.8 mg (0.03 mmol) of NAC (dissolved in CD3OD) were added and stirred. NMR spectra were recorded on a Bruker 400.20 MHz spectrometer at 25 °C from time 0 (immediately after dissolution) up to 24 h. All chemical shifts are reported in ppm (d) referenced to the chemical shifts of residual solvent resonances (1H).
experiment, an optimized diffusion time of 0.15 s was used. Structural characterization of the reaction compounds was performed without purification based on NMR experiments
including 1H, DEPT (distortionless enhancement by
polarization), COSY (correlation spectroscopy) and HSQC (heteronuclear single quantum correlation).
Electron spin resonance spectroscopy (ESR)
ESR spectra were recorded in the X band (9.85 GHz) using a Bruker ECS 106 spectrometer with a rectangular cavity and 50 kHz field modulation. The hyperfine splitting constants were estimated to be accurate within 0.05 G. The radical obtained from oncocalyxone A was generated by in situ electrolytic reduction at room temperature. ESR spectra of the anion radicals were obtained from the electrolysis solution.
Theoretical calculations
Oncocalyxone A was fully optimized to different level theory to reach the best degree of exactitude and precision in the calculations in order to perform a fine-prediction of the hyperfine splitting pattern. For obtaining the best structure and for finding the minimum energy structures with the highest abundance conformer population in the gas phase,23,24 a conformational search was performed using molecular mechanic methods (MMFF) as implemented in Spartan’ 04. Then, the best conformer was optimized with AM1 semi-empirical method,25 as implemented in Spartan’ 04. The last geometry optimization for each selected conformer was performed by means of density functional theory (DFT) as implemented in the Gaussian 03 package26 since it is well known that computational models based on DFT are particularly suitable for the analysis of magnetic properties for open-shell species.27 Oncocalyxone A radical was analyzed using Becke’s three parameter exact exchange functional (B3)28 combined with gradient-corrected correlation functional of Lee-Yang-Parr (LYP)29 of DFT method (U)B3LYP/6-31g in vacuum and also with conductor like polarizable continuum model (C-PCM) solvent methodology, using DMSO (dimethylsulfoxide) as solvent for testing environment influences on the hyperfine splitting,30,31 in the single-point calculations.
Theoretical calculations were performed using different basis sets of contracted Gaussian functions, namely 6-31G, 6-31+G, 6-31++G, (into the U-HF and U-DFT model), all them upon the respective solvation model. Thus, different basis functions were assessed in order to obtain a better spin density distribution, which is related to the isotropic hfcc (Aiso (N)), correspondent to the Fermi contact term.
All calculations were carried out under the unrestricted formalism, giving <S2> values lower than 0.7615, implicating a spin contamination less than of 2.0%.
Results and Discussion
Electrochemical experiments in aprotic medium
The electrochemical behavior of oncocalyxone A on a GCE was investigated. Figure 2 shows the cyclic voltammograms of oncocalyxone A with the concentration
of 0.1 mmol L-1, in aprotic medium (DMF + TBABF
4 0.1 mol L-1) at a scan rate of 100 mV s-1.
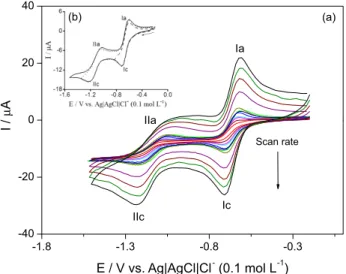
As expected for quinonoid compounds, the overall CV profile of oncocalyxone A is similar to the ones reported for other quinones: two couples of cathodic and anodic peaks, represented by diffusional (EpIc α ν1/2) quasi-reversible couples, with EpIc = –0.719 V / EpIa = –0.602 V and EpIIc = –1.220 V / EpIIa = –1.030 V (Figure 2). The first pair is related to the anion-radical formation (the semiquinone of oncocalyxone A), for which the structure was characterized by E-ESR experiments. The second pair of peaks is broader and ill-defined, as previously observed32,33 for other α-methoxy-para-benzoquinones, due to possible structural rearrangements or comproportionation reactions, not elucidated at the present case.
Due to the reactive nature of the free radicals, the anion radical of oncocalyxone A was prepared in situ by electrochemical reduction in DMSO (similar to DMF) by applying the potential corresponding to the
Figure 2. (a) Cyclic voltammograms (CV) of oncocalyxone A (1), c1 = 0.1 mmol L
-1 in aprotic medium (DMF + TBABF
4 (0.1 mol L-1)) vs.
Ag/AgCl, Cl− (0.1 mol L-1). Scan rates: 10, 20, 30, 35, 50, 70, 75, 100,
200, 300, 400 and 500 mV s-1. Working electrode: glassy carbon. (b)
first monoelectronic wave obtained from the cyclic voltammetric experiments.
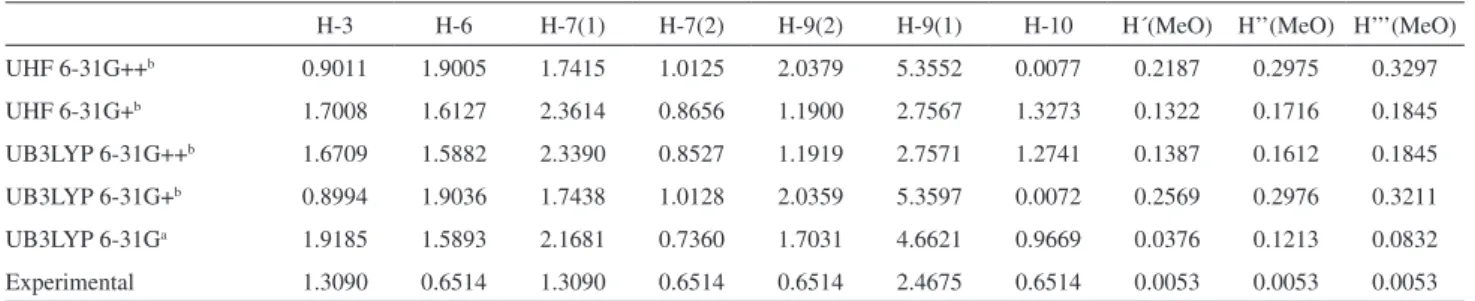
Table 1 shows the theoretical and experimental hyperfine constants at different theory levels. When comparing the theoretical values with the experimental ones of hyperfine coupling constants (hfcc), a clear correlation is observed and the experimental values are finely reproduced by these methods. Thus, the electronic structure studies are an essential tool to aid in the interpretation of ESR data. Consequently, an accurate description of physicochemical parameters such as the hfcc and its “tridimensional perspective” (by mapping the spin density of unpaired electron over the molecule) were obtained (Figure 3).
A good agreement between the experimental and simulated ESR spectra ensures the correct elucidation of the hfcc for this radical (Figure 1b), which according to the assessment of the hyperfine interaction can be described in terms of ten doublets corresponding to the hydrogens in position 3, 6, 7, 9, 10 and three hydrogens from the methoxy moiety (Figure 4, numbering inside Figures 1a and 4c).
Starting from the spin density map of the unpaired electron, it is possible to observe a larger delocalization mainly over the aromatic moiety (ring A). This is extended throughout the carbocyclic system (rings B and C) to reach places near to positions 6 and 7 (relatively far from the
Table 1. Hyperfine coupling constants for oncocalyxone A free radical
H-3 H-6 H-7(1) H-7(2) H-9(2) H-9(1) H-10 H´(MeO) H’’(MeO) H’’’(MeO)
UHF 6-31G++b 0.9011 1.9005 1.7415 1.0125 2.0379 5.3552 0.0077 0.2187 0.2975 0.3297
UHF 6-31G+b 1.7008 1.6127 2.3614 0.8656 1.1900 2.7567 1.3273 0.1322 0.1716 0.1845
UB3LYP 6-31G++b 1.6709 1.5882 2.3390 0.8527 1.1919 2.7571 1.2741 0.1387 0.1612 0.1845
UB3LYP 6-31G+b 0.8994 1.9036 1.7438 1.0128 2.0359 5.3597 0.0072 0.2569 0.2976 0.3211
UB3LYP 6-31Ga 1.9185 1.5893 2.1681 0.7360 1.7031 4.6621 0.9669 0.0376 0.1213 0.0832
Experimental 1.3090 0.6514 1.3090 0.6514 0.6514 2.4675 0.6514 0.0053 0.0053 0.0053
aVacuum single point calculation; bsingle point calculation with C-PCM model.
Figure 3. Spin density of unpaired electron of oncocalyxone A anion radical.
hydroquinone moiety). The high delocalization is clearly evidenced by the hyperfine coupling of H-9 with the larger coupling constant, besides the couplings at the H-3 (ring A) and H-7 (ring C) positions.
Then again, in order to rationalize the experimental hyperfine pattern, theoretical calculations were carried out. The results allow to appropriately assign the hyperfine constants to specific magnetic nuclei. Theoretical estimations give indicia about the spin distribution of the unpaired electron in the molecule. Herein, the accurate description about the hyperfine splitting allows to get a full accurate picture of the hyperfine pattern and the free radical stability. The basis set UB3LYP 6-31G++ (along with the C-PCM solvation model) showed the better agreement with the experimental hyperfine pattern.
Thus, the generation of a free radical from oncocalyxone A was confirmed. In terms of its hyperfine splitting, this radical has shown a wide unpaired electron delocalization through the entire molecule, highlighting the stability of the radical likely by resonant effects.
Electrolysis of quinones, in the absence of electrophiles furnished unstable hydroquinones that are converted back, quite regularly to the starting materials by air oxidation. The same result was obtained with oncocalyxone A. Reductive acetylation, as earlier reported,20,34 was performed with consumption of 2 mol electron mol-1 and led to the corresponding acetylated hydroquinone (Figure 1c) (see Experimental section).
Electrochemical experiments in protic medium
In protic medium (EtOH + phosphate buffer, 20%, pH 7.0), only one couple is observed for oncocalyxone A (Figure 5), with a very large distance between EpIc and EpIa, indicative of a kinetically slow process or an unstable hydroquinone, as before evidenced for simpler quinones in buffered media.35
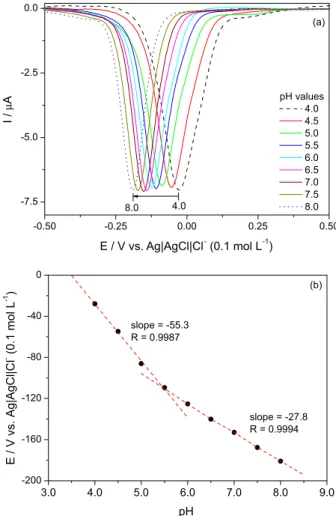
The pH effect (pH range from 4 up to 8) on the reduction peak potential (EpIc) was investigated, showing two regions (Figures 6a and 6b), the first one from 4 to 5.5 and the second from 5.5 to 8. Simple manipulation of the Nernst equation shows that the observed redox potential for an m H+, n e− redox couple will change –m/n (59 mV)/pH, at 25 oC. So, under conditions where quinones undergo a 2 e− (+2 H+ reduction), a plot of EpIc
app vs. pH should give a slope of –59 mV/pH unit up to pH = pKa1 for QH2. At higher pH values, the product will be QH−, meaning that the reaction is now 1 H+ (2 e−) and the slope will decrease to −30 mV/pH.35 That is indeed what occurs with oncocalyxone A, with the first and second slopes equal to −55.3 mV/pH unit and −27.8 mV/pH unit, respectively (Figure 6b).
For the sake of searching the possible interaction between oncocalyxone A and DNA, it was added into a
Figure 5. (a) Cyclic voltammograms (CV) of oncocalyxone A, c1 = 0.1 mmol L-1 in protic medium (phosphate buffer + EtOH, 20%) at
pH 7.0 vs. Ag/AgCl, Cl− (0.1 mol L-1). Scan rates: 10, 20, 30, 35, 50, 70,
75, 100, 200, 300, 400 and 500 mV s-1. Working electrode: glassy carbon.
(b) Inset: CV performed at 50 mV s-1, EpIc = −0.382 V, Ei = −0.70 V.
Figure 6. (a) Differential pulse voltammograms for oncocalyxone A (c = 0.1 mmol L-1) in phosphate buffer 0.1 mol L-1 with different pH values.
ssDNA solution. The interaction between them is depicted in Figure 7. Signals associated with the oxidation of the guanosine (Gua) and adenosine (Ad) in residual bases of ssDNA were very intense. Nevertheless, when increased concentrations of oncocalyxone A were added to the solution of ssDNA, the current intensity of the oxidation peak of Gua decreased in amplitude, while the current signal of Ad has no significant change because of the contribution of the oxidation current of oncocalyxone A on the potential of Ad. The decrease of the oxidation current of guanosine (Gua) (inset of Figure 7) and a small shift on anodic potential from the bases when oncocalyxone A concentration increased are positive indications of interaction between ssDNA and oncocalyxone A (Figure 7).
This behavior can be interpreted by the decrease of the concentration of the nucleobases available for oxidation because of their interaction with oncocalyxone A. Similar behavior is observed when a single base is analyzed instead of ssDNA solution. The oxidation signals of the base guanine (G) (Figure 8) were very intense. When mixed solutions of oncocalyxone A and that base were analyzed by DPV, decreases on the current intensities are observed for guanine (with a current decrease of ca. 48% for G/oncocalyxone A ratio of ½, inset of Figure 8).
Analysis with adenine (A) was also performed, but there is a coincidence between the oxidation peak potentials of adenine (A) and of oncocalyxone A, compromising the analysis. In fact, the electrochemical behavior observed for guanine corroborates the one related to ssDNA analysis,
showing an intense interaction between guanine and oncocalyxone A (Figures 7 and 8). Similarly, the analysis using polyG and polyA were performed, aiming to study the influence of the sugar-phosphate moiety of the nucleotide on the base oxidation. A similar behavior is observed although the peak currents of the bases were not so intense and showed shifts on peak anodic potentials. The decrease of the peak currents observed for polyA is more intense (Figure 9) than when the isolated base is used (Figure 8), with a
Figure 7. Baseline-corrected differential pulse voltammograms (DPV) for ssDNA (– –) (acetate buffer + EtOH, (20%), pH 4.5) in presence of (–) 10, (–) 20, (–) 40, (–) 60, (–) 80, (–) 100, (–) 200 and (–) 400 µmol L-1
of oncocalyxone A. For comparison, DPV of oncocalyxone A in absence of ssDNA was performed with concentration of 40 µmol L-1 (–
·–). Inset: dependence of the anodic peak current (Ip) of guanosine on the
concentration of oncocalyxone A. Working electrode: glassy carbon, reference: Ag/AgCl, Cl– (0.1 mol L-1) and counter electrode: platinum coil.
Figure 8. Baseline-corrected DPV for 100 µmol L-1 of Guanine (G) (– –)
(acetate buffer + EtOH (20%), pH 4.5) in presence of (–) 10, (–) 20, (–) 40, (–) 60, (–) 80, (–) 100 and (–) 200 µmol L-1 of oncocalyxone A. For
comparison oncocalyxone A in absence of guanine was performed with concentration of 40 µmol L-1 (–
·–). Inset: Dependence of the anodic peak current (Ip) of Guanine on the concentration of oncocalyxone A. Working
electrode: glassy carbon, reference: Ag/AgCl, Cl− (0.1 mol L-1) and counter
electrode: platinum coil.
Figure 9. Baseline-corrected differential pulse voltammograms for (– –) polyA (acetate buffer + EtOH (20%), pH 4.5) in presence of (–) 10, (–) 20, (–) 40, (–) 60, (–) 80, (–) 100 and (–) 200 µmol L-1 of oncocalyxone A (1).
For comparison, oncocalyxone A in absence of polyA was analyzed with concentration of (–·–) 40 µmol L-1. Inset: dependence of the anodic peak
current (Ip) of polyA on the concentration of oncocalyxone A. Working
electrode: glassy carbon, reference: Ag/AgCl, Cl− (0.1 mol L-1) and counter
current decrease of ca. 80% (inset of Figure 9), and a slight potential shift of polyA was observed. This analysis is an indicative that even with the presence of the sugar-phosphate moiety, the interaction between oncocalyxone A and polyA is achieved and with a high intensity, what is more representative once the bases in raw DNA are bound in sugar-phosphate backbone. PolyG was analyzed, but the oxidation peak potential of the guanine base on the polyG is shifted, overlapping the one from oncocalyxone Aand, in such a case, being not considered for further analysis.
To have a blank experiment, α-lapachone (Figure 1d) was used as a negative probe, and was analyzed with ssDNA. The same experimental conditions as for oncocalyxone A analysis were used. No significant interaction between
α-lapachone and ssDNA was observed (Figure 10).
The combined results reinforce the positive interaction between oncocalyxone A and ssDNA. As previously reported,3 oncocalyxone A caused DNA damage. It consists of a planar, polycyclic, aromatic ring complex, an essential feature of all DNA intercalating agents. Its hydroxyl groups at C-8 or C-11 may be involved in DNA binding activity through hydrogen bonding, which had been evidenced before through acetylation that led to the reduction of the bioactivity.3
Voltammetric and spectroscopic study of oncocalyxone A-NAC interaction
The adduct formation between oncocalyxone A and NAC, as indicative of its ability to be a Michael acceptor, can be followed by square wave voltammetry and
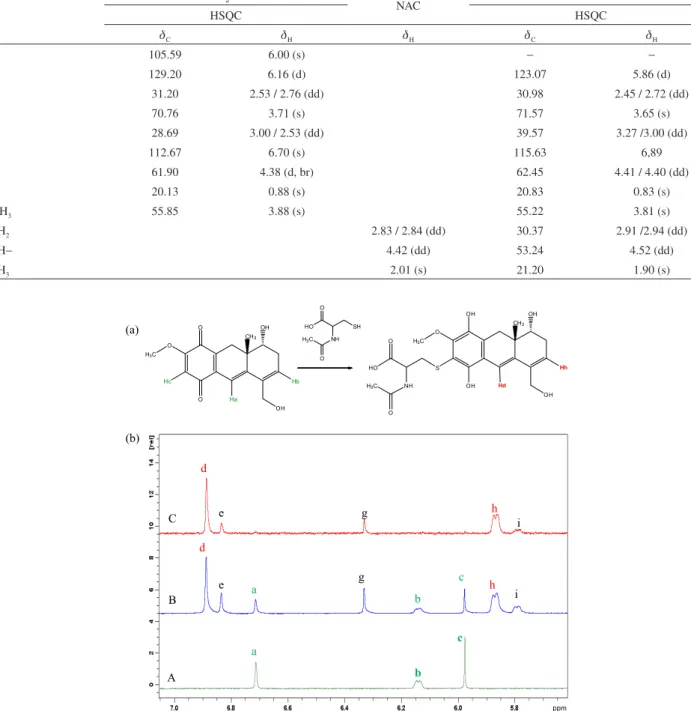
UV-Vis absorption spectroscopy (Figures 11a e 11b, respectively), in which decreases on the intensity of the reduction wave (Figures 11a, b) and of the UV-Vis bands (Figure 11b) are observed. The addition reaction products were analyzed and the major one (not isolated) was characterized by NMR.
The treatment of oncocalyxone A with NAC in CD3OD at room-temperature resulted in adduct formation through a Michael reaction. The reaction was followed
by NMR. Figure 12 shows 1H NMR spectrum of the
oncocalyxone A + NAC (in time = 0) with emphasis on the region of the hydrogens of the double bonds a, b and c (d 6.72, 6.15 and 5.98 ppm, respectively) once these are the possible regions for reaction. After 24 h, all hydrogen signal intensities had decreased and new H signals showed up: d, e, g, h and i (d 6.90, 5.85, 7.35, 5.83 and 5.80 ppm,
Figure 10. Baseline-corrected differential pulse voltammograms to ssDNA (– –) (acetate buffer + EtOH (20%), pH 4.5) in presence of (–) 10, (–) 20, (–) 40, (–) 60, (–) 80, (–) 100, (–) 200 and (–)400 µmol L-1 of
α-lapachone performed as a negative probe. Working electrode: glassy carbon, reference: Ag/AgCl, Cl− (0.1 mol L-1) and counter electrode:
platinum coil. Scan rate: 0.010 V s-1.
Figure 11. (a) Square wave voltammetry of oncocalyxone A, in absence and presence of N-acetylcysteine (NAC) in several concentrations, in phosphate buffer 0.1 mol L-1 at pH 7.0, frequency 50 Hz, amplitude
25 mV. Successive additions of NAC. Inset: graph current vs. NAC concentration and (b) UV-Vis spectra of oncocalyxone A (0.1 mmol L-1)
after addition to NAC (0.1 mmol L-1). Each spectrum was obtained after
Table 2. NMR chemical shifts for 1H and 13C of oncocalyxone A, NAC and adduct (d / ppm, 400.20 MHz, using CD 3OD)
C
Oncocalyxone A
NAC Adduct
HSQC HSQC
dC dH dH dC dH
3 105.59 6.00 (s) − −
6 129.20 6.16 (d) 123.07 5.86 (d)
7 31.20 2.53 / 2.76 (dd) 30.98 2.45 / 2.72 (dd)
8 70.76 3.71 (s) 71.57 3.65 (s)
9 28.69 3.00 / 2.53 (dd) 39.57 3.27 /3.00 (dd)
10 112.67 6.70 (s) 115.63 6,89
11 61.90 4.38 (d, br) 62.45 4.41 / 4.40 (dd)
12 20.13 0.88 (s) 20.83 0.83 (s)
OCH3 55.85 3.88 (s) 55.22 3.81 (s)
−CH2 2.83 / 2.84 (dd) 30.37 2.91 /2.94 (dd)
−CH− 4.42 (dd) 53.24 4.52 (dd)
−CH3 2.01 (s) 21.20 1.90 (s)
Figure 12. (a) Scheme of reaction of oncocalyxone A with NAC, showing the main hydrogens. (b) 1H NMR spectra (400.20 MHz, CD
3OD) for the reaction
mixture of oncocalyxone A with NAC at (A) 0 h, (B) 24 h and (C) DOSY experiment, only the double bond shifts are shown.
respectively) relative to the new hydrogen signals of the adduct. To remove oncocalyxone A double bond signals that did not react (a, b, c), DOSY experiment was performed applying a gradient shield. The new signals were assigned to the formation of two products, the major one with two double bonds e and h and the thiol group of the NAC added to the third double bond (Table 2). After the addition of NAC, the quinone group was reduced to the correspondent hydroquinone. The secondary product (not characterized)
still has three double bonds (e, g, i), which led to assume that the reaction occurred in another functional group of oncocalyxone A. It is possible that the hydroquinone suffers oxidation, furnishing the thiolated quinone.
Conclusions
cells (thiols, for instance) and the induction of DNA damage (mainly by single and double strand breaks) can result in potential cytotoxicity toward normal and tumoral cell lines.36-42 As already described, oxidative stress leading to DNA damage and alkylation of nuclear cellular nucleophiles are the two major mechanisms of quinone cytotoxicity.9,12,16,43 Concerning the results in the present study, a typical electrochemical behavior (in aprotic medium) is observed for oncocalyxone A, represented by diffusional two quasi-reversible reduction systems, with a well-stabilized anion radical as evidenced by ESR analysis. Oncocalyxone A has shown significant DNA activity, represented by the decrease and shift of oxidation peaks of guanosine/guanine and adenosine/adenine. The analysis with polyadenylic acid (polyA) had evidenced a more intense interaction when compared with the single base and this analysis is important because it shows interaction between oncocalyxone A and the nucleotide, especially in presence of sugar-phosphate moiety. This result corroborates earlier obtained oncocalyxone A DNA reactivity through cometa assays.3 Oncocalyxone A contains two electrophilic α,β-unsaturated carbonyl groups, one of them extended, what can explain the reactivity toward NAC and the nucleophilic bases.10 The NMR experiments have proved that oncocalyxone A is a Michael acceptor. Additionally, the hydroxyl groups at C-8 or C-11 of oncocalyxone A (Figure 1) may be involved in DNA binding activity through hydrogen bonding, as previous observed.3
These results (upon comparison with biological/ pharmacological activities)3-5,16,17 show correlation and indicate DNA sensors as well as experiments in the presence of thiols, for instance, NAC, together with structural analysis of the electroreduced species, as important tools in the screening of biologically active compounds.
Acknowledgements
T h e a u t h o r s w i s h t o t h a n k C o o r d e n a ç ã o de Aperfeiçoamento de Pessoal de Nível Superior (CAPES), PROCAD/NF (CAPES), Conselho Nacional de Desenvolvimento Científico e Tecnológico (CNPq/ PROSUL), INCT-Bioanalítica, Programa de Apoio a Núcleos de Excelência/Fundação de Amparo à Pesquisa do Estado de. Alagoas (PRONEX/FAPEAL) for financial support.
References
1. Pessoa, O. D. L.; Lemos, T. L. G.; Silveira, E. R.; Braz-Filho, R.; Nat. Prod. Lett. 1993, 2, 145.
2. Pessoa, O. D. L.; Lemos, T. L. G.; Carvalho, M. G.; Braz-Filho, R.; Phytochem.1995, 6, 1777.
3. Pessoa, O. D. L.; Lemos, T. L. G.; Pessoa, O. D. L.; Moraes, M. O.; Vasconcellos, D.; Costa-Lotufo, L. V.; Leyva, A.; Arkivoc.
2004, VI, 89.
4. Ferreira, M. A. D.; do Nascimento, N. R. F.; de Sousa, C. M.; Pessoa, O. D. L.; Lemos, T. L. G.; Ventura, J. S.; Schattner, M.; Chudzinski-Tavassi, A. M.; Br. J. Pharmacol. 2008, 154, 1216. 5. Costa-Lotufo, L. V.; Ferreira, M. A. D.; Lemos, T. L. G.; Pessoa,
O. D. L.; Viana, G. S. B.; Cunha, G. M. A.; Braz. J. Med. Biol. Res. 2002, 35, 927.
6. Ferreira, M. A. D.; Nunes, O. D. R. H.; Leal, L. K. A. M.; Pessoa, O. D. L.; Lemos, T. L. G.; Viana, G. S. B.; Biol. Pharm. Bull.
2003, 26, 595.
7. Ferreira, M. A. D.; Nunes, O. D. R. H.; Fontenele, J. B.; Pessoa, O. D. L.; Lemos, T. L. G.; Viana, G. S. B.; Phytomedicine2004, 11, 315.
8. Leyva, A.; Pessoa, C.; Boogaerdt, F.; Sokaroski, R.; Lemos, T. L. G.; Wetmore, L. A.; Huruta, R. R.; Moraes, M. O.; Anticancer Res. 2000, 20, 1029.
9. Hillard, E. A.; de Abreu, F. C.; Ferreira, D. C. M.; Jaouen, G.; Goulart, M. O. F.; Amatore, C.; Chem. Commun. 2008, 2612. 10. Brunmark, A.; Cadenas, E.; Free Radical Biol. Med. 1989, 7,
435.
11. Santos, M. M. M.; Moreira, R.; Mini Rev. Med. Chem. 2007, 7, 1040.
12. Fry, F. H.; Jacob, C.; Curr. Pharm. Des. 2006, 12, 4479. 13. Lohmann, W.; Karst, U.; Anal. Bioanal. Chem. 2009, 394,
1341.
14. Hernández, D. M.; de Moura, M. A. B. F.; Valencia, D. P.; González, F. J.; González, I.; de Abreu, F. C.; da Silva Junior, E. N.; Ferreira, V. F.; Pinto, A. V.; Goulart, M. O. F.; Frontana, C.; Org. Biomol. Chem. 2008, 6, 3414.
15. Zafarullah, M.; Li, W. Q.; Sylvester, J.; Ahmad, M.; Cell. Mol. Life Sci. 2003, 60, 6.
16. Cavalcanti, B.; Barros, F. W. A.; Cabral, I.; Ferreira, J.; Magalhães, H.; Júnior, H.; Júnior, E.; de Abreu, F. C.; Costa, C. O.; Goulart, M. O. F.; Moraes, M. O.; Pessoa, C.; Chem. Res. Toxicol. 2011, 24, 1560.
17. Araújo, A. J.; de Souza, A. A.; da Silva Júnior, E. N.; Marinho-Filho, J. D. B.; de Moura, M. A. B. F.; Rocha, D. D.; Vasconcellos, M. C.; Costa, C. O.; Pessoa, C.; De Moraes, M. O.; Ferreira, V. F.; de Abreu, F. C.; Pinto, A. V.; Montenegro, R. C.; Costa-Lotufo, L. V.; Goulart, M. O. F.; Goulart, M. O. F.; Toxicol. in Vitro, 2012, Doi:10.1016/j.tiv.2012.02.003. 18. de Abreu, F. C.; Ferraz, P. A. M.; Goulart, M. O. F.; J. Braz.
Chem. Soc. 2002, 13, 19.
19. Labuda, J.; Oliveira-Brett, A. M.; Evtugyn, G.; Fojta, M.; Mascini, M.; Ozsoz, M.; Palchetti, I.; Palecek, E.; Wang, J; Pure Appl. Chem.2010, 82, 1161.
20. Tonholo, J.; Freitas, L. R. ; Azevedo, D. C. ; Abreu, F. C. ; Zani, C. L. ; Oliveira, A. B.; Goulart, M. O. F.; J. Braz. Chem. Soc.
21. de Abreu, F. C.; De Paula, F. S.; Ferreira, D. C. M.; Nascimento, V. B.; Santos, A. M. C.; Santoro, M. M.; Salas, C. E.; Lopes, J. C. D.; Goulart, M. O. F.; Sensors 2008, 8, 1519.
22. Brett, A. M. O.; Piedade, J. A. P.; Silva, L. A.; Diculescu, V. C.; Anal. Biochem. 2004, 332, 321.
23. Cunningham, M. L.; Zvelebil, M. J. J. M.; Fairlamb, A. H.; Eur. J. Biochem. 1994, 221, 285.
24. Baillet, S.; Horvath, E. B. D.; Maes, L.; Bonnet, B.; Sergheraert, C.; Bioorg. Med. Chem. 1996, 4, 891.
25. Dewar, M. J. S.; Zoebisch, E. G.; Healy, E. F.; Stewart, J. J. P.; J. Am. Chem. Soc. 1985, 107, 3902.
26. Frisch, M. J.; Schlegel, H. B.; Scuseria, G. E.; Robb, M. A.; Cheeseman, J. R., Montgomery Jr., J. A.; Vreven, T.; Kudin, K. N.; Burant, J. C.; Millam, J. M.; Iyengar, S.S.; Tomasi, J.; Barone, V.; Mennucci, B.; Cossi, M.; Scalmani, G.; Rega, N.; Petersson, G. A.; Nakatsuji, H.; Hada, M.; Ehara, M.; Toyota, K.; Fukuda, R.; Hasegawa, J.; Ishida, M.; Nakajima, T.; Honda, Y.; Kitao, O.; Nakai, H.; Klene, M.; Li, X.; Knox, J. E.; Hratchian, H. P.; Cross, J. B.; Bakken, V.; Adamo, C.; Jaramillo, J.; Gomperts, R.; Stratmann, R. E.; Yazyev, O.; Austin, A. J.; Cammi, R.; Pomelli, C.; Ochterski, J. W.; Ayala, P. Y.; Morokuma, K.; Voth, G. A.; Salvador, P.; Dannenberg, J. J.; Zakrzewski, V. G.; Dapprich, S.; Daniels, A. D.; Strain, M. C.; Farkas, O.; Malick, D. K.; Rabuck, A. D.; Raghavachari, K.; Foresman, J. B.; Ortiz, J. V.; Cui, Q.; Baboul, A. G.; Clifford, S.; Cioslowski, J.; Stefanov, B. B.; Liu, G.; Liashenko, A.; Piskorz, P.; Komaromi, I.; Martin, R. L.; Fox, D. J.; Keith, T.; Al-Laham, M. A.; Peng, C. Y.; Nanayakkara, A.; Challacombe, M.; Gill, P. M. W.; Johnson, B.; Chen, W.; Wong, M. W.; Gonzalez C.; Pople, J. A.; Gaussian, Inc., Wallingford CT, 2004.
27. D’Amore, M.; Improta, R.; Barone, V.; J. Phys. Chem. A 2003, 107, 6264.
28. Becke, A. D.; Phys. Rev. A 1988, 38, 3098.
29. Lee, C. T., Yang, W. T.; Parr, R. G.; Phys. Rev. B: Condens. Matter 1988, 37, 785.
30. Barone, V.; Cossi, M.; J. Phys. Chem. A 1998, 102, 1995. 31. Cossi, M.; Barone, V.; Cammi, R.; Tomasi, J.; Chem. Phys.
Letters 1996, 255, 327.
32. Frontana, C.; Frontana-Uribe , B. A.; González, I.; Electrochim. Acta 2003, 48, 3593.
33. Lehmann, M. W.; Evans, D. H.; J. Electroanal. Chem. 2001, 500, 12.
34. Ferraz, P. A. L.; de Abreu, F. C.; Tonholo, J.; Chiari, E.; Pinto, A. V.; Glezer, V.; Goulart, M. O. F.; J. Electroanal. Chem. 2001, 507, 275.
35. Quan, M.; Sanchez, D.; Wasylkiw, M. F.; Smith, D. K.; J. Am. Chem. Soc.2007, 129, 12847.
36. Ferreira, D. C. M.; Goulart, M. O. F.; Moreira, M. S. A.; Pinto, A. V.; Tapsoba, I.; Arbault, S.; Amatore, C.; ChemBioChem
2009, 10, 528.
37. Quan, M.; Sanchez, D.; Wasylkiw, M. F.; Smith, D. K.; J. Am. Chem. Soc. 2007, 129, 12847.
38. Hurley, L. H.; Nat. Rev. Cancer2002, 2, 188.
39. Palchaudhuri, R.; Hergenrother, P. J.; Curr. Opin. Biotechnol.
2007, 18,497.
40. Smith, R.; Canton, C.; Lawrence, N. S.; Livingstone, C.; Davis, J.; New J. Chem. 2006, 30, 1718.
41. White, P. C.; Lawrence, N. S.; Davis, J.; Compton, R. G.; Anal. Chim. Acta 2001, 447, 1.
42. Rosa, R. M.; Moura, D. J.; Silva, A. C. R.; Saffi, J.; Henriques, J. A. P.; Mutation Res., Fundam. Mol. Mech. Mutagen 2007, 631, 44.
43. Bolton, J. L.; Trush, M. A.; Penning, T. M.; Dryhurst, G.; Monks, T. J.; Chem. Res. Toxicol. 2000, 13, 135.
Submitted: March 3, 2012