Printed in Brazil - ©2007 Sociedade Brasileira de Química 0103 - 5053 $6.00+0.00
A
r
ti
c
le
*e-mail: [email protected]
Comparison of Rural and Urban Atmospheric Aldehydes in Londrina, Brazil
Jurandir Pereira Pinto and Maria Cristina Solci*
Departamento de Química, Universidade Estadual de Londrina, 86051-970 Londrina-PR, Brazil
Os níveis ambientais de formaldeído e acetaldeído foram medidos em três locais na cidade de Londrina: na estação central de ônibus urbano, no centro (perfis diurno e noturno) e em área rural, no verão e inverno de 2002. Os aldeídos foram coletados em cartuchos Sep-Pak revestidos com 2,4-DNPH e analisados por CLAE/AFD. Na estação central as razões de mistura de formaldeído e acetaldeído, estiveram, respectivamente, na faixa de 6,17 a 10,43 ppbv e 0,49 a 2,12 ppbv. No centro, durante o verão, os níveis do formaldeído variaram de 2,07 a 5,65 ppbv e do acetaldeído variaram de 1,05 a 5,06 ppbv. Durante o inverno, as concentrações diurnas de formaldeído e acetaldeído foram mais elevadas do que as noturnas. As razões de mistura do formaldeído e acetaldeído variaram de 3,24 a 9,46 ppbv e 2,81 a 10,83 ppbv, respectivamente. Na área rural as razões de mistura de formaldeído e acetaldeído variaram de 0,64 a 1,41 ppbv e 0,10 a 0,87 ppbv, respectivamente. As razões de acetaldeído/formaldeído foram comparadas com valores obtidos em outras cidades brasileiras.
Ambiental levels of formaldehyde and acetaldehyde were measured at three sites in the city of Londrina: at the central bus station, downtown (night and day profiles) and in a rural area, during the summer and winter seasons of 2002. Atmospheric aldehydes were collected using C18 Sep-Pak cartridges coated with 2,4-DNPH and analyzed by HPLC-DAD. At the central bus station, the measured mixing atios for formaldehyde and acetaldehyde ranged, respectively, from 6.17 to 10.43 ppbv and from 0.49 to 2.12 ppbv. Downtown, during the summer, formaldehyde levels ranged from 2.07 to 5.65 ppbv, and acetaldehyde levels ranged from 1.05 to 5.06 ppbv. During the winter, the daytime concentrations for formaldehyde and acetaldehyde were higher than nighttime levels. Formaldehyde and acetaldehyde mixing ratios ranged from 3.24 to 9.46 ppbv and from 2.81 to 10.83 ppbv, respectively. At the rural site, formaldehyde and acetaldehyde mixing ratios ranged from 0.64 to 1.41 ppbv and from 0.10 to 0.87 ppbv, respectively. The acetaldehyde/formaldehyde ratios were compared with values from other Brazilian cities.
Keywords: formaldehyde, acetaldehyde, acetaldehyde/formaldehyde ratios, vehicular
emissions
Introduction
Among the oxygenated volatile organic compounds,
formaldehyde (HCHO) and acetaldehyde (CH3CHO) are
of great importance to atmospheric chemistry. They contribute significantly to the organic component of aerosols1 and, as precursors of formic acid and acetic acid, also to the acidity of the atmosphere.2 Sources of both
aldehydes include mainly direct emissions, in-situ
photochemical production from volatile biogenic and anthropogenic hydrocarbons emitted by several mobile and stationary sources.
In clean or rural areas, the major natural sources of
HCHO and CH3CHO are photooxidation and ozonolysis
of naturally emitted nonmethane hydrocarbons (NMHCs).3 The direct contribution of biogenic emissions
of HCHO and CH3CHO has been reported for several
environments.4-6 Primary sources of aldehydes are
burning processes, chipboard production and chemical industry; important secondary sources are photochemical decomposition processes of hydrocarbons and other organics in the air. The incomplete combustion of oxygenated fuels in engines results in increased
emissions of primary HCHO and CH3CHO, and
The major sinks of HCHO and CH3CHO are the chemical destruction caused by reactions with OH, HO2,
and NO3, and photolysis in case of HCHO and dry
deposition of HCHO and CH3CHO to terrestrial surfaces such as canopy surfaces and to the ground.12
Carbonyl compounds are toxic, and their most observed toxic effects are irritation of the skin, eyes and
nasopharyngeal membranes. In fact, HCHO and CH3CHO
have been recognized as having great impact on human health, because of their potentially carcinogenic and mutagenic properties.13
In Brazil, standard values for formaldehyde and acetaldehyde concentrations have not been established and the measurements of aldehydes are important for several reasons. Brazil has extensive experience with ethanol and ethanol-blended gasoline due to a governmental program initiated in 1975 that stimulates the production and use of ethanol as alternative fuel. Brazil is the only country in the world where ethanol and gasoline-ethanol (22-25% ethanol by volume) blend are used nationwide.
There is a growing interest in the use of alternative energy sources like ethanol and other alcohol fuels with the purpose of reducing the dependence on finite reserves
like petroleum, and CO and hydrocarbon emissions.14
Another reason for the increase in interest is that ethanol is produced from different types of biomass, mainly sugar cane in Brazil, making it a renewable fuel that limits the
discharge of fossil carbon dioxide (CO2) which most
probably contributes to the global climate changes.15 Published aldehyde measurements in the urban atmosphere in Brazil have been limited to the largest Brazilian centers like Rio de Janeiro, São Paulo, Salvador and Porto Alegre7-11,16-19 and data for rural areas are even scarcer.
The importance of the target compounds to air quality is recognized, and therefore, justifies the necessity of aldehyde measurements in other cities in Brazil, where a large increase in traffic density has occurred owing to industrial development and population growth.
In this study, we report environmental levels of carbonyl compounds measured at three locations in the city of Londrina. The investigation was carried out at a closed bus station, at urban and rural areas, during the summer and winter 2002. It’s important to mention that it was the first investigation of carbonyls, beyond metropolitan areas in Brazil.
In order to directly investigate the profile originating from a primary source of mobile traffic, the aldehydes were collected at a location that was exclusively affected by bus traffic. The bus station in Londrina is poorly ventilated and the buses move at low speed and park for
passenger access; because of this, it serves as an appropriate sample location for this purpose. Furthermore, the conditions at the bus station hinder pollutant dispersion and because of the low level of lighting in the station, there is practically no photochemistry. In addition, daily samples were collected to permit comparative studies among the days of the week.
The main source of emissions at the urban site was from the vehicular fleet that includes light-duty vehicles fueled with gasohol (a variable mixture of 78% gasoline and 22% anhydrous ethanol), hydrated ethanol and diesel-fueled heavy-duty vehicles. There are approximately 156,000 light-duty vehicles, of which 29% are light-duty vehicles that use hydrated ethanol, 64% are light-duty vehicles that use a mixture of 80-75% (v/v) gasoline and 20-25% ethanol, and 7% are diesel-powered buses and trucks. The rural area receives minimal impact from local anthropogenic sources, and there are no industrial operations in the vicinity of the site.
The results of the atmospheric trends of aldehyde mixing ratios, ratios and linear relationships between formaldehyde (FA) and acetaldehyde (AA) are reported. The present work is part of the PARALON study (Atmospheric Resources Evaluation Program in Londrina-PR), which is focused on the characterization of emissions from distinct sources in the region.
Experimental
Description of sampling sites
The City of Londrina is located in Paraná State, south of Brazil (lat. 23°18’S; long. 51°09’W) and has an area of 118.5 km² and average altitude of 610 meters above sea level. The climate is sub-tropical and the summer season includes the period from December to March, while the winter season includes the period from June to September. The winter season is relatively short. Rain, which occurs all year, is intensive in the summer season and the annual precipitation varies between 1500 and 1700 mm. The metropolitan area of Londrina has about 663,000 inhabitants of which, 446,822 inhabitants live in urban areas. Three sites were chosen for the aldehyde sampling, on the basis of local differences in the proximity of emission sources.
326 buses transit 1500 times every day from Monday to Saturday, and on Sundays this flux reduces ~45%. Around 150,000 people circulate and about 60 work in this location, where there are commercial stores and offices. The station has a total constructed area of 2875 m2, with frontal and lateral sides in masonry walls (2 m high) and metal netting (3 m high).
The Farm site, is an experimental farm where samples were also collected. This farm is located at the State University of Londrina campus, 5.1 km west of downtown Londrina. This site is a rural and relatively unpopulated area with no significant impact from vehicle emissions. Conditions at both sites afforded the placement of sampling equipment in a secure location with restricted public access.
Sampling of aldehydes
Carbonyl compounds in the air were collected using silica gel cartridges (Sep-Pak C18 Classic, Waters Corp.) impregnated with 0.2% acidified 2,4-dinitrophenyl-hydrazine acetonitrile solution. At the Station daily sampling was carried out for two weeks from January 16 to 29 during the summer of 2002. The samples were collected for 24 hours a day. The air inlet was located 5 m above ground level. The atmospheric air samplings at the Center site were collected during summer (January 29-February 14) and winter (July 13-28, 2002). The sampling system was placed 3.0 meters above ground level and 2.5 meters far from the nearest street. The samplings were carried out with an automatic sequential collector (University of Dortmund, Germany) with 12 channels, where two serial parallel-impregnated cartridges are connected. The system was operated in sequence by an electronic sampler to obtain air samples with time resolution of 12 h. At the Farm and the city center, air samplings were collected simultaneously during winter. The sampling system was placed 3.0 meters above ground level with two serial parallel-impregnated cartridges for 24 h. The average flow rate through the cartridges in both systems was 1.1 mL min-1 giving a 792 L and 1584 L of air sample during 12 and 24 h respectively. The sample flow rate was measured with a ROTA flow meter before and after each sampling period. All samples were collected by connecting two
cartridges in series in order to verify the column-breakthrough at both sites. Samples and field controls were sealed with Teflon® tape, stored in opaque vials, and kept in a refrigerator at 4 °C after being collected. According to Pires and Carvalho,20 ozone interferes in the carbonyl sampling with DNPH cartridges, for
compounds with more than four carbon atoms.Since only
formaldehyde and acetaldehyde were determined in this study an ozone scrubber was not used during the measurements. Meteorological data during each sampling period was obtained from the State Meteorological System (SIMEPAR). The SIMEPAR station is located 5 km far from the University of Londrina campus (UEL) in Londrina. The weather parameters used in the development of this study were temperature, wind speed, cloud cover, relative humidity, precipitation amounts and solar irradiance. The weather conditions during the measurement periods are presented in Table 1.
Analytical methodology
DNPH was purified by recrystalization and the purity was controlled by HPLC. Each cartridge was sealed with Teflon tape, wrapped in a coated aluminum bag and stored in a refrigerator. HPLC grade acetonitrile (3-5 mL) was used to elute the retained derivatives from the cartridges. The sampled hydrazones were eluted from the cartridges with the help of a peristaltic pump at a flow rate of 1.0 mL min-1 for 3.0 to 5.0 min and were stored in amber vials. The injection of the samples was performed immediately after the extraction. Aliquots of the extracts from samples and field controls were analyzed by using a Shimadzu LC-10AD with an isocratic pump and detection by diode array ultraviolet-visible spectroscopy (SHIMADZU SPD-10AV).
The separation was achieved on a NUCLEOSIL C18 column
(250 × 4.5 mm, 5 µm) with guard-column. The mobile
phase was 60:40 (v/v) acetonitrile-water at flow rate of 1.0
mL min-1. Samples were injected by a Rheodyne valve
equipped with a 20 µL loop, at 35 °C. The pure
DNPH-derivatives were synthesized separately for standards from formaldehyde and acetaldehyde by reaction with 2,4-DNPH. The hydrazone standards were prepared by adding 0.25 g of aldehyde (Sigma) to an acidic solution with 0.50 g of 2,4-DNPH. The formed precipitate was washed with
Table 1. General weather conditions in Londrina: average and temperature range, relative humidity and solar radiation during the measurement periods
2002 Temperature/(0C) RH/(%) SolarRadiation/(Cal (cm2 day)-1) Wind speed/(m s-1)
HCl and water, dried and maintained under vacuum. The calibrations were carried out with standard mixtures containing known amounts of solid carbonyl-hydrazones dissolved in HPLC-grade acetonitrile.15 Identification and quantification of carbonyls compounds were based on retention time, UV-visible absorption spectra, and peak areas of the corresponding calibrated carbonyl-DNPH standards in the 1.3-76 µmol L-1 concentration range. The
calibrations were made each time before analyzing the atmospheric aldehyde samples and their correlation coefficient (R2) values were 0.999. The percentage of relative standard deviations (RSD) of each set of measurements for FA was 2.2% and for AA 3.0%. The collection efficiency of the sample cartridge was determined with the use of two cartridges in series and resulted in values for formaldehyde and acetaldehyde, which were higher than 98% in the first cartridge. The ambient air detection limit of formaldehyde and acetaldehyde was calculated taking into consideration the average blank levels in the DNPH cartridges. In order to obtain representative blank values, two batches of cartridge blank and field control (n=16, summer; n=20, winter) were analyzed. The cartridge elution volume was 3 mL. The DNPH cartridge background contents ranged from 1.1-4.8 nmol FA and 1.9-11 nmol AA per cartridge. Other investigations reported similar amounts from cartridge blank levels.20-22 The detection limit of the sampling method was defined as three times the standard deviation in field blanks. The average blank conta-mination found in field blanks corresponds to the nominal sampling volumes of 792 and 1584 L and the results provide the limits of detection (LOD) for FA of 0.07 and 0.13 ppbv, for AA 0.10 and 0.32 ppbv (24 and 12 h sampling, respectively). The accuracy of the method was evaluated by the analysis of duplicate samples. The results showed a relative standard deviation (RSD) of 5.4% for FA and 5.7% for AA.
Results and Discussion
Levels of carbonyl compounds at three sites in Londrina
Stationsite
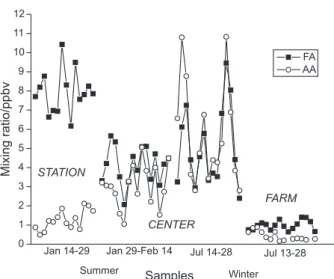
At the central bus station in Londrina, where only diesel-powered vehicles circulate, the FA concentrations are significantly higher than acetaldehyde. The average mixing ratios of ambient formaldehyde and acetaldehyde are presented in Figure 1. The FA levels ranged from 6.17 to 10.43 ppbv with an average of 7.94 ppbv while acetaldehyde presented levels in the interval of 0.49 to 2.12 ppbv and an average of 1.26 ppbv. The formaldehyde concentration was 6 times higher then the acetaldehyde concentration.
Center and Farm sites
A total of 164 samples were collected in Londrina. At the Center site, 70 samples were collected in the summer and 62 samples in the winter; at the Farm site, 32 samples were obtained in the winter season. Gaseous FA and AA were detected in all samples, except at the Farm site. At the urban site-Center, in the summer, the FA mixing ratio ranged from 2.07 to 5.65 ppbv, and AA mixing ratio ranged from 1.05 to 5.06 ppbv. In the winter, the FA mixing ratio ranged from 2.4 to 9.46 ppbv, and AA mixing ratio ranged from 2.81 to 10.83 ppbv. At the rural site-Farm, in the winter, FA levels ranged from 0.64 to 1.41 ppbv, and AA levels ranged from 0.16 to 0.89 ppbv. The summary statistics of the target ambient carbonyl compounds determined in summer and winter measurements at urban and rural sites are shown in Table 2. Compared with measu-rements observed previously in other Brazilian metropolitan areas, the ambient aldehyde mixing ratios were relatively low.8 Nevertheless, a comparison with the aldehyde levels in those sites (Rio de Janeiro, São Paulo, Porto Alegre and Salvador) is not convenient owing to the great differences in the vehicular fleet (fuel composition, number of vehicles) and the meteorological conditions.
Seasonal variation and correlation of carbonyl compounds
The ambient mixing ratio of aldehydes measured in the sites of Londrina, in summer and winter are shown in Figure 1. The seasonal daily variations of FA and AA at each location measured in Londrina follow the same trend. However, the mixing ratio of the aldehydes showed differences at the sites and during the collection period.
In summer, FA was the most abundant aldehyde in ambient air of downtown Londrina. The average mixing ratio of FA was (4.11±0.97) ppbv while AA average Table 2. Twenty four hour mixing ratios (ppbv) of formaldehyde and acetal-dehyde in urban and rural site, summer and winter 2002, Londrina, Brazil
Site Formaldehyde Acetaldehyde
Range (mean±S.D.) Range (mean±S.D.)
Station (summer) 6.17–10.43 0.49–2.12
(7.94±1.13) (1.26±0.52)
Center (summer) 2.07–5.65 1.05–5.06
(4.11±0.97) (3.02±1.10)
Center (winter) 2.40–9.46 2.81–10.83
(5.07±2.09) (5.72±2.66)
Farm (winter) 0.64–1.41 0.16–0.89
(0.98±0.25) (0.43±0.25)
mixing ratio was (3.02±1.10) ppbv. A typical reduction of aldehyde concentration is present on Sundays and holidays confirming vehicle traffic as a source of emissions in downtown Londrina. The levels of FA and AA were highly correlated with a coefficient value of 0.87 (by high correlation, means values above 0.7 at a confidence level of 95%).
In winter, still at the Center site, the average mixing ratio of FA was (5.07±2.09) ppbv and (5.72±2.66) ppbv for AA. Similar reduction in levels of carbonyls is observed on Sundays and rainy days. It is important to note that AA levels at the Center site, in winter, were slightly higher than FA concentrations, and both carbonyls presented higher values in winter than in summer. A good correlation (r=0.83) is found between FA and AA suggesting similar sources or mechanisms of formation of these carbonyl compounds.
At the Farm site, in winter, the result observed was as expected. The FA concentration is higher than AA. The average mixing ratio of FA was (0.98±0.25) ppbv and (0.43±0.25) for AA. The profile was similar but no correlation between them was observed. In non-urban areas where the sources of primary aldehydes are very weak, the direct emissions from vegetation and photochemical processes in the atmosphere may contribute to the aldehyde concentration.
Meteorological conditions and week-end reduction of traffic strongly influence the summer and winter aldehyde concentrations. In fact, a lower concentration of carbonyls was observed on rainy days such as 17, 18 and 23 of July. The levels of carbonyl compounds might depend on the meteorological conditions (temperature, wind speed and solar radiation).23 During the summer, although high levels of photochemical activities is expected to result in
increased levels of some carbonyl compounds, the data shown in Figure 1 demonstrate that it does not apply to the measurements in Londrina.
The dependencies of the aldehyde mixing ratios and the solar irradiance for each sampling site were investigated. In the winter period there was a decrease of about 40% of the solar irradiance compared with the summer. Average mixing ratios of FA and AA at the Center site in winter were about 20% and 50% higher, respectively. Seasonal variations showed that in the summer, carbonyl mixing ratios decreased due to more rapid photolysis and hydroxyl radical reactions, whereas in the winter, these losses were minimized. No significant correlation between the solar irradiance and formaldehyde and acetaldehyde mixing ratios was observed, and there appeared to be no temperature dependence of concentrations. Since peak concen-trations were higher in the winter than in summer, it is expected that direct vehicular emission was competitive with in-situ formation of carbonyls from reactive hydrocarbons.
Diurnal and nocturnal variations of aldehydes at the Center site-winter sampling
For the samples collected in downtown Londrina, where air quality is influenced by vehicle traffic, a decision was made to collect ambient samples at the time period when vehicular emissions had the greatest impact on ambient air quality. The ambient mixing ratio measurements during the day (6:30 am to 6:30 pm) and during the night (6:30 pm to 6:30 am) are presented in Figure 2. The daily atmospheric mixing ratios ranged from 1.3 to 6.3 ppbv (2.97±1.3 ppbv) for FA and 1.55 to 6.61 ppbv (3.12±1.4 ppbv) for AA. The night mixing ratios were from 0.82 to 3.78 ppbv (2.05±1.0 ppbv) for FA and from 0.79 to 6.19 ppbv (2.75±1.7 ppbv) for AA. Average concentrations of the aldehydes are higher during daytime. FA decreased 31% and acetaldehyde 12% from day to night measurements. This fact may be attributed to the decline of the direct emission from vehicular traffic in the city, which occurs more frequently until 7 pm with mainly diesel-fueled vehicles. The decrease observed in the aldehyde concentrations indicated that deposition and nighttime FA and AA
reactions were also ocouring.24 During the day time,
vehicular emission appeared to be the most important source of acetaldehyde, whereas formaldehyde also has a contribution from diesel fuels and is dependent on solar intensity, photochemical process like photolysis and radical reaction probability. It is also possible that the Figure 1. The daily variation of formaldehyde and acetaldehyde observed
at three sampling sites during summer and winter (Londrina, 2002).
0 1 2 3 4 5 6 7 8 9 10 11 12
FARM
CENTER STATION
Winter Summer
Jul 13-28 Jul 14-28
Jan 29-Feb 14 Jan 14-29
Samples
Mixing
ratio/ppbv
vegetation at the center site plays the role of a sink for these compounds.25
The levels of formaldehyde observed during the night are also in the range of the daily mixing ratio indicating no clear differences between day and night profiles. The correlation coefficients obtained for regressions of FA versus AA in the winter measurements yielded high correlations during the day (r= 0.87) and night (r=0.88), indicating that their sources are closely related and these species probably arise from similar processes.8
The correlation observed between solar irradiance and the daily aldehyde mixing ratio obtained from a 12 hour sampling period showed no evident correlations (r = 0.26 for FA and r = 0.21 for AA).
Aldehyde mixing ratios at the Farm site-winter sampling
Winter sampling of aldehydes was collected simultaneously with the Center site in the rural location-Farm. Background mixing ratios of FA and AA are shown in Figure 1. Ambient levels of FA accounted for 70% of the aldehydes analyzed; they ranged from 0.64 to 1.41 ppbv, with an average value being (0.98±0.25) ppbv. AA accounted for 30% and ranged from 0.16 to 0.89 ppbv, with an average of (0.43±0.25) ppbv. These levels are common FA and AA mixing ratios for unpolluted areas, and this is in accordance with published background values.5, 25-28 In Table 3 the results are compared with data from other areas.
Organic compounds which are emitted into the atmosphere are likely to form carbonyl compounds through photo-oxidation. In rural areas the sources of primary aldehydes are low and most of carbonyl compounds would come from the photo-oxidation of organic compounds of biological origin.30
Acetaldehyde/formaldehyde ratios (AA/FA)
The aldehyde concentration ratios are used to compare the results of carbonyl measurements. The AA/FA ratio is considered as the signature of light or heavy vehicles in the sampling place.
The AA/FA ratio of 0.16 at the Station site charac-terizes the high contribution of the combustion of diesel as a potential source of emission of formaldehyde in local surrounding air. No significant influence of the weekend days on the variation of the concentration of aldehydes was observed. The present database was obtained from
Table 3. Mean mixing ratios and/or range of formaldehyde and acetaldehyde measured in rural areas in Brazil and around the world
Site Formaldehyde/(ppbv) Acetaldehyde/(ppbv) Reference
Balbina 1.8 0.40 5
Amazonas, Brazil (0.60-3.5) (0.30-1.0)
Lagoa Verde 1.5 2.1 10
Bahia, Brazil (0.20-4.6) (0.50-5.9)
Cacha-Pregos 1.2 1.2 10
Bahia, Brazil (0.20-2.5) (0.40-2.3)
Londrina 0.98 0.43 This study
Paraná, Brazil (0.64-1.41) (0.16-0.89)
Kuopio (1.1-2.2) 0.6-1.7 25
Finland
Savannah 0.98 0.94 26
Georgia, USA
Lille Valby 1.2 0.80 27
Denmark
Socorro 3.4 1.4 28
New Mexico, USA
Figure 2. Day and night winter measurements of formaldehyde and acetaldehyde at the Center site (Londrina, 2002). Sampling period of 12 hours (6:30 am to 6:30 pm; 6:30 pm to 6:30 am).
14 15 16 17 18 19 20 21 22 23 24 25 26 27 28 13 14 15 16 17 18 19 20 21 22 23 24 25 26 27 28
--0 1 2 3 4 5 6 7
FA AA
night day
FA AA
Center site, July 2002 (Winter)
Mixing
direct emission from an almost unique source, the exhaust of diesel engines at the bus station and provides a real and useful contribution to the assessment of sources by atmospheric aldehydes. Considering the prevailing combustion process, the ratio AA/FA of 0.16 is attributed to direct emission from diesel exhaust and is in good agreement with Andrade et al.10 that describe an AA/FA ratio of 0.17 as a diesel signature.
The AA/FA is also used as a measurement of the importance of the anthropogenic factor to natural sources in the atmosphere. The emissions of acetal-dehyde by the incomplete combustion of ethanol lead to an increase in the AA/FA ratio due to the use of
hydrated ethanol and gasohol-fueled vehicles.19 The
AA/FA ratios based on the measurements in Brazil reported in literature and in this study are listed in Table 4. Figure 3 shows the AA/FA ratios for the sampling carried out in Londrina. At the Center site the concentration rations were 0.73 for the summer measurements, 1.1 for the winter measurements and 0.40 at the Farm site.
The higher AA/FA ratio in winter than in summer suggests the contribution of local anthropogenic hydrocarbons, a slower photochemical decomposition and oxidation of acetaldehyde. The difference between summer and winter ratios depends on the effective solar flux and the vehicular emissions and confirms the primary and secondary sources for the aldehydes. The higher AA/ FA ratio in winter at the Center site could be partly attributed to an increase of the ethanol content in gasohol from 22 to 25% in July 2002. The ratios observed for day and night winter samples were > 1 (AA/FA = 1.07 and 1.3, respectively) and characterize the anthropogenic contribution of the aldehydes in the period. The relatively lower values for AA/FA at the Farm site may reflect the local participation of biogenic reactive hydrocarbons, whose oxidation yields more formaldehyde than acetaldehyde. The influence of other sources of FA such as biomass combustion is possible.
Conclusions
Atmospheric levels of formaldehyde and acetaldehyde were measured at urban and rural areas in the city of Londrina, as part of the PARALON study (Atmospheric Resources Evaluation Program in Londrina-PR), which was focused on the characterization of emissions from distinct sources in the region. The samples were collected at the central bus Station site, downtown (night and day profiles) and in a rural area, during the summer and winter seasons of 2002. Over this period, the average mixing ratio of formaldehyde and acetaldehyde were 7.94 and 1.26 ppbv at the station, 4.6 and 4.4 ppbv at the Center site and 1.0 and 0.4 ppbv at the Farm site, respectively. The background levels observed are similar to levels measured in other rural and semi-rural sites. Compared to other urban locations in Brazil the levels of the aldehydes in Londrina were lower. Higher levels of the aldehydes were observed in winter with lower photochemical activity and here the AA/FA concentrations ratio was higher than in summer measurements. The levels of the aldehydes, mainly acetaldehyde, showed diurnal variations indicating that the photochemical production and removal and direct emissions could be significant processes. Since time-concentration profiles were reduced to one or two periods per day it was difficult to identify the contributions of different sources. However, the comparative data in this study between the distinct sites brings a contribution to the knowledge of aldehyde levels emitted in Brazilian cities. Secondary formation processes appear to be the dominant sources for both aldehydes in the rural area, whereas primary sources are relatively important for the urban atmosphere. The direct Table 4. AA/FA ratios obtained in Brazil since 1990 by other studies and
this study
Site Year AA/FA Note Reference
São Paulo 1986 0.8-3.4 17
São Paulo 1998 1.1 9
São Paulo 1993 2.03 29
Rio de Janeiro 1985 0.3-1.2 16
Rio de Janeiro 1998-2001 0.76-1.61 19
Rio de Janeiro 2000 0.66 11
Salvador 1988 1.61-3.84 17
Salvador 1992 0.37-1.67 10
Londrina 2002 0.73 summer this study
Londrina 2002 1.1 winter this study
Londrina 2002 0.40 rural this study
Figure 3. Acetaldehyde to formaldehyde ratios (AA/FA) for the Station, Center and Farm sites (Londrina, 2002).
0 1 2
Winter Summer
Jul 13-28 Jul 14-28
Jan 20-Feb 14 Jan 16-29
Farm Center
Center
Station
A
cet
al
dehy
de/
For
m
a
lde
hy
de
emissions from vehicles could be considered the main source of acetaldehyde at the Center site in Londrina. Formaldehyde’s origin seems to be from exhaust emissions and from other sources.
In general, the identification of the origin of the aldehydes seems to be a complex issue. The fact that the use of oxygenated blends increases the aldehyde concentrations is only partially correct.
Londrina is a very arboreous city, mainly in the sites where the samplings have been collected. Soon, other contributions for the aldehyde levels like biogenic primary emission and deposition processes must be considered.
Brazilian cars are adapted for varied fuel compositions. The engines of Brazilian automobiles powered by gasoline are developed to accept 20-25% of alcohol mixed with gasoline. Owing to the recent introduction on Brazilian roads of bicombustible automobiles (flex fuel), that use alcohol, gasoline or a mixture of both, in any ratio, certainly new measurements of atmospheric aldehydes is of great interest and the data here presented is important for future comparisons.
The use of ethanol-gasoline blended fuels increases the emission of aldehydes into the atmosphere. Flex fuel engines permit the use of gasoline or alcohol, or any percentage mixture of these fuels, without any intervention from the manufacturer. This procedure inserts a new parameter into research on air pollutants since the real quantities of each type of fuel are unknown.
Aldehydes damage the environment and their effective participation in tropospheric chemistry for the production of secondary pollutants (ozone, PAN, among others) demands new measurements focusing on the uncertainties of the sources.
Acknowledgments
This work has been partially supported by CAPES. The authors are grateful to the DAAD/GTZ, Germany and specially Prof. Dr. Dieter Klockow for the donation of equipments and materials. The University of Londrina supported the publication costs of this article (PRODICI).
References
1. Li, P.; Perreau, A.; Covington, E.; Song, C.H.; Carmichael, G.R.; Grassian, V.H.; J. Geophys. Res. 2001, 106, 5517.
2. Andreae, M.O.; Talbot, R.W.; Andreae, T.W.; Harris, R.C.; J.
Geophys. Res. 1988, 93, 1616.
3. Rottenberger, S.; Kuhn, U.; Wolf, A.; Schebeske, G.; Oliva, S.T.; Tavares, T.M.; Kesselmeier, J.; Ecological Applications
2004, 14, S247.
4. Kesselmeier, J.; Bode, K.; Hofmann, U.; Muller, H.; Schafer, L.; Wolf, A.; Ciccioli, P.; Brancaleoni, E.; Cecinato, A.; Frattoni, M.; Foster, P.; Ferrari, C.; Jacob, V.; Fugit, J.L.; Dutaur, L.; Simon, V.; Torres, L.; Atmos. Environ. 1997, 31, 119. 5. Kesselmeier, J.; Kuhn, U.; Wolf, A.; Andreae, M.O.; Ciccioli,
P.; Brancaleoni, E.; Frattoni, M.; Guenter, A.; Greenberg, J.; Vasconcellos, P.C.; Oliva, S.T.; Tavares, T.M.; Artaxo, P.; Atmos.
Environ. 2000, 34, 4063.
6. Müller, K.; Haferkorn, S.; Grabmer, W.; Wisthlater, A.; Hansel, A.; Kreuzwieser, J.; Cojocariu, C.; Rennenberg, H.; Herrmann, H.; Atmos. Environ. 2006, 40, S81.
7. Possanzini, M.; Di Palo, V.; Petricca, M.; Fratarcangeli, R.; Brocco, D.; Atmos. Environ.1996, 30, 757.
8. Montero, L.; Vasconcellos, P.C.; Souza, S.R.; Pires, M.A.F.; Sanchez-Ccoyllo, O.R.; Andrade, M.F.; Carvalho, L.R.F.;
Environ. Sci. Technol. 2001, 35, 3071.
9. Nguyen, H.T.H.; Takenaka, N.; Bandow, H.; Maeda, Y.; Oliva, S.T.; Botelho, M. L.; Tavares, T.M.; Atmos. Environ. 2001, 35, 3075.
10. De Andrade, J.B.; Andrade, M.V.; Pinheiro, H.L.C.; J. Braz.
Chem. Soc. 1998, 9, 219.
11. Grosjean, D.; Grosjean, E.; Moreira, L.F.R.; Environ. Sci.
Technol. 2002, 36, 1389.
12. Carlier, P.; Hannachi, H.; Mouvier, G.; Atmos. Environ. 1986, 20, 2079.
13. CEPA (California Environmental Protection Agency), Air Resources Board, Stationary Source Division, Sacramento, CA, USA, 1993.
14. Martins, E.M.; Arbilla, G.; Atmos. Environ. 2003, 37, 1715. 15. Magnusson, R.; Nilsson, C.; Environ. Sci. Technol. 2002, 36,
1656
16. Tanner, T R.L.; Miguel, A.H.; Andrade, J.B.; Gaffney, J.S.; Streit, G.E.; Environ. Sci. Technol. 1988, 22, 1026.
17. Grosjean, D.; Miguel, A. H.; Tavares, T. M.; Atmos. Environ.
1990, 24B, 101.
18. De Andrade, J.B.; Pinheiro, H.L.C.; Andrade, M.V.; J. Braz.
Chem. Soc. 1995, 6, 287.
19. Corrêa, S.M.; Martins, E.; Arbilla, G.; Atmos. Environ. 2003, 37, 23.
20. Pires, M.J.R.; Carvalho, L.R.F.; Anal. Chem. Acta 1998, 367, 223.
21. Grosjean, E.; Grosjean, D.; Fraser, M.P.; Cass, G.R.; Environ.
Sci. Technol. 1996, 30, 2687.
22. Báez, A.P.; Padilla, H.; Cervantes, J.; Pereyra, D.; Torres, M.C.; Garcia, R.; Belmont, R.; Atmos. Environ. 2001, 35, 1813. 23. Ho, K.F.; Lee, S.C.; Peter, K.K.; Zou, S.C.; Atmos. Environ.
2002, 36, 1259.
24. Moussa, S. G.; El-Fadel, M.; Saliba, N.A.; Atmos. Environ.
2006, 40, 2459.
26. Macintosh, D.L.; Zimmer-Dauphinee, S.A.; Manning, R.O.; Williams, P.L.; Environ. Monit. Assess. 2000, 63, 409. 27. Christensen, C.S.; Skov, H.; Nielsen, T.; Lohse, C.; Atmos.
Environ. 2000, 34, 287.
28. Villanueva-Fierrro, I.; Popp, C.J.; Martin, R.S.; Atmos. Environ.
2004, 38, 249.
29. Ferrari, C.; Kaluzny, P.; Roche, A.; Jacob, V.; Foster, P.;
Chemosphere 1998, 37, 1587.
30. Miguel, A.H.; Aquino Neto, F.R.; Cardoso, J.N.; Vasconcellos, P.C.; Pereira, A.S.; Marquez, K.S.G.; Environ. Sci. Technol.
1995, 29, 338.
Received: May 9, 2006