Article
0103 - 5053 $6.00+0.00*e-mail: [email protected]
Formaldehyde and Acetaldehyde Concentrations in the Idle and
Taxiway Areas of an Urban Airport
Claudinei S. Guimarães, Luciana S. Varandas and Graciela Arbilla*
Departamento de Físico-Química, Instituto de Química, Universidade Federal do Rio de Janeiro, CT Bloco A, Sala 408, Cidade Universitária, 21949-900 Rio de Janeiro - RJ, Brazil
A im de determinar o impacto das emissões de aldeídos num aeroporto, sobre a qualidade do ar, foram determinadas as concentrações de acetaldeído e formaldeído nas áreas de pouso e decolagem do aeroporto nacional Santos-Dumont no Rio de Janeiro, Brazil. O aeroporto está localizado a aproximadamente 1 km do centro da cidade e, no ano de 2007, teve uma média de 70.000 pousos e decolagens. Foram coletadas 129 amostras no período de março a novembro de 2007. Para o formaldeído foram observadas concentrações no intervalo 2,6 a 10,3 µg m-3 e para
o acetaldeído, no intervalo, 4,3 a 19,7 µg m-3. Durante a manhã, as relações A/F (acetaldeído/
formaldeído, em unidades de massa) se encontraram no intervalo 0,7-1,0. Nos horários da tarde as concentrações de formaldeído foram menores e as de acetaldeído aumentaram. As concentrações de formaldeído e acetaldeído estão no mesmo intervalo que valores previamente obtidos para o centro da cidade e possivelmente não afetem a produção de ozônio a nível local.
To estimate the impact of aldehyde emissions at an airport on the air quality, formaldehyde and acetaldehyde concentrations were measured in the idle and taxiway areas of the Santos-Dumont national airport in Rio de Janeiro. The airport is located about 1 km from downtown Rio de Janeiro and had an average of 70,000 landings and take-offs during 2007. A total of 129 samples were collected in the period from March to November 2007. Formaldehyde concentrations ranged from 2.6 to 10.3 µg m-3, and acetaldehyde concentrations ranged from 4.3 to 19.7 µg m-3. During the
morning, A/F ratios (acetaldehyde/formaldehyde ratios, in mass units) were in the range 0.7-1.0. In the afternoon, formaldehyde concentrations were lower and acetaldehyde concentrations generally increased. Formaldehyde and acetaldehyde concentrations were in the same range than values previously published for downtown and may not affect ozone production in a local scale.
Keywords:aircraft engine emissions, aldehydes, airport air quality
Introduction
The impact of aircraft emissions on air quality has been
investigated in several recent studies. Perl et al.1 estimated
the emissions due to aircraft operations at a mid-sized French airport in 1987, 1990 and 1994 and suggested a perspective of future emissions under different scenarios. These results show that, currently, aircraft emissions may be considered negligible in comparison with those generated by surface transportation sources. However, in the long-term, aviation might be considered a growing air pollution problem.
Literature data show that the critical stages for aircraft emissions are those when the aircraft is waiting on the
ground (the taxi and idle phases). In these phases, aircraft engines do not operate at their optimum conditions and emit
signiicant amounts of carbon monoxide and hydrocarbons.2
Pison and Menut2 presented a analysis modeling of the
aircraft trafic emissions impact on the ozone concentrations over Paris. They used a volatile organic compound (VOC) speciation reported by the European Environmental Agency
(EEA)3 for commercial aircraft, which suggests that ethylene
and formaldehyde are the most abundant pollutants. They concluded that the maximum negative impact of air trafic emissions on ozone concentration occurs during the night, due to fast ozone titration by NO in the surface layer near the airport. The maximum positive impact occurs during the daytime in remote areas and at altitudes where the chemical system is not saturated with NO. A similar conclusion was
Several results conirm that formaldehyde is one of the most dominant hydrocarbons and thus is a valuable
reference species. Recently, Herdon et al.5 detailed the
hydrocarbon species emitted during the idle, taxiway acceleration, approach and take-off phases from in-use commercial aircrafts. Specifically, they reported formaldehyde and acetaldehyde concentrations and compared their acetaldehyde/formaldehyde ratios with the
value previously reported by Spicer et al.6 for a CFM-56
engine.
A detailed report of NOX, CO and non-oxygenated
VOC emissions of aircrafts during idling was published
by Schürmann et al.7 The values were determined at the
Zurich airport during ifteen days in the summer of the year 2004. The authors found a strong dependence upon engine type and some discrepancies with the emission indices for aircrafts reported by the International Civil Aviation Organization (ICAO). Their work suggests the relevance of measuring real emissions in actual aircraft operating conditions.
In Brazil, several authors have discussed the contribution of aviation activities for global environmental problems. In
2003, Simões8 analyzed the air transportation sector in Brazil
in the brooder context of global climate change, building CO2
emission projections of this sector, for the 2003-2023 period and proposing mitigation alternatives for these emissions.
In another work, Ribeiro et al.9 proposed a detailed plan
to reduce emissions at Carlos Jobim international airport (Rio de Janeiro, Brazil) and estimated the emissions due to aircrafts, ground support vehicles and also trafic in the airport surroundings. The subject was also include in the international workshop on environmental impact of airports, held during the biannual conference and exhibit of the clean air initiative for Latin American cities on sustainable
transport, in 2006.10 Literature contributions are mainly
focused in climate changes and greenhouse gases emissions. VOC emissions at airports are due to aircrafts exhaust and fuel handling. Additionally, the trafic exhaust from the ground support vehicles and machinery that serve the aircrafts on the ground between arrival and departure may be considered as emissions sources. These vehicles are mostly powered by diesel, and their main emissions are particulate matter and nitrogen oxides. Aldehyde emissions are signiicantly higher than those from ethanol-fueled
engines.11 Depending on the airport location, vehicular
emissions from the city area may be an important contribution, mainly due to the use of ethanol and ethanol-blended gasoline as in Brazil. Nevertheless, as it will be shown later, in Santos-Dumont airport, pollutant transport from downtown areas is a minor contribution to the overall emissions.
The main goal of this work was to determine formaldehyde and acetaldehyde concentrations in the idle and taxiway areas during routine operation at Santos-Dumont airport in Rio de Janeiro. Samples were collected without interfering or causing inconvenience to the aircrafts or the airport routine. As stated previously, formaldehyde is one of the most abundant hydrocarbons emitted by aircraft engines. Both formaldehyde and acetaldehyde are important precursors of tropospheric ozone. There are concerns regarding the impact of the urban airports increasing activities. Topics such as security, ambient noise and trafic jams due to passenger’s trafic in nearby areas are currently being discussed. There are few studies of the potential impact of VOC exhaust emissions on ozone chemistry within airport environments. Measurements of formaldehyde and acetaldehyde concentrations in the idle and taxiway areas of Santos Dumont airport may help to evaluate if aircraft emissions are a signiicant contribution to concentrations of ozone precursors in a Brazilian urban airport.
Experimental
Sampling-site description
The City of Rio de Janeiro, located on the Atlantic coast of Brazil, has about 6 million inhabitants distributed over an
area of 1,182 km2.12 The climate is tropical, hot and humid,
with local variations due to altitude differences, vegetation and proximity to the Atlantic Ocean and the Guanabara Bay. In 2007, the annual average temperature was 23.8 °C, with higher daily averages during the summer (between 29 and 30 °C). During the sampling period, the higher average temperature obtained was in March (26 °C) and the lower in June (22 °C). Average monthly rainfalls in 2007 varied
between 100 and 1,700 mm2.
In the central area of the city, the main source of pollution is the vehicular leet fueled by gasohol (gasoline with 24% v/v of ethyl alcohol), ethanol, diesel and, in to a lesser extent, natural gas.
The Santos-Dumont airport is a national airport located adjacent to Guanabara Bay and about 1 km away from downtown (latitude 22º 54´S, longitude 43º 10´W, elevation 3 m). In 2007, this airport had an average of 70,000 landings and take-offs, and about 4 million passengers distributed
between 7 air companies.13 The samples were collected on
During the sampling period, the prevailing wind was
a steady 6 m s-1 with a slight angle across the runway.14
The frequencies of wind direction during 2007 are shown in Figure 2. These data are also consistent with those
published for Rio de Janeiro downtown.14 The prevailing
winds are from the North and Northeast in the morning, and from the South and Southeast in the afternoon. The transport of pollutants from the city to the airport (West to East) is a minor contribution to overall pollutants.
A total of 129 samples were collected in the period from March to November of 2007. The sampling system was run from 8:00 am to 4:00 pm, in periods of 2 h. The total number of days of sample collection in each month was as follows: 16 in March, 32 in April, 16 in May, 12 in June, 28 in October and 25 in November.
Materials
Aldehydes were sampled using C18 resin cartridges, Sep-Pak Classic (Waters Corp. Ireland, part No. WAT051910), coated with 2,4-dinitrophenylhydrazine (DNPH). The aldehydes were trapped in these cartridges upon reaction with DNPH to form the corresponding, stable
2,4-dinitrophenylhydrazone derivatives, using a procedure
based on the TO-11A Method from the US EPA.15
The hydrazone standards were prepared by adding a molar excess of the carbonyl compound to the saturated solution of DNPH. The formed precipitate was irst washed
with 2 mol L-1 HCl and then with water. The precipitate
was then allowed to dry under vacuum in amber desiccator for 48 h. A 100 ppm hydrazone solution was prepared by repeated dilutions of 100 mg of hydrozone with acetonitrile. It was then stored in a dark lask in the refrigerator. More
details may be found in Corrêa et al.16
Sampling procedure
The sampling system comprised a pump, a low meter, a cartridge with C18 resin impregnated with DNPH, an ozone scrubber and Tygon tubes. The low rate was controlled at
1 L min-1 for the entire sampling periodand was calibrated
at the beginning of the experiment using an Intelligent Digital Flowmeter (Varian Analytical Instruments).
Analytical method
Aldehydes that were collected in the cartridges were extracted using 4 mL of acetonitrile. The liquid was collected in amber vials and weighed to obtain
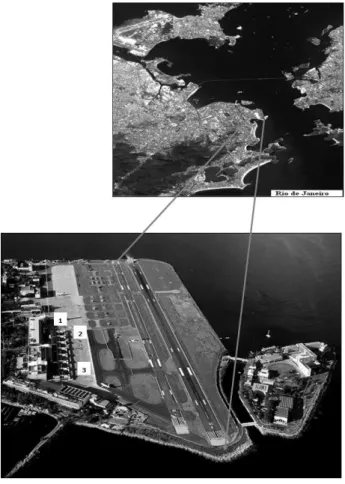
Figure 1. Map of the sampling location and approximate layout of the Santos-Dumont airport. Samplings were performed between the administration buildings and the airplane parking area.
Figure 2. Frequency of wind direction during 2007. Data provided by REDEMET10 and compiled by the meteorological department of the
the solution volume. An authentic standard (TO11/ IP6A Carbonyl DNPH Mix, Supelco, Bellefonte, PA, USA), containing formaldehyde, acetaldehyde, acrolein, acetone, propionaldehyde, crotonaldehyde, butyraldehyde, benzaldehyde, isovaleraldehyde, valeraldehyde,
o-tolualdehyde, m-tolualdehyde, p-tolualdehyde,
hexaldehyde and 2,5-dimethylbenzaldehyde, was used to obtain the calibration curve for each compound in the sample concentration range. In the 7 standard solutions, used to obtain the curves, a minimum correlation coeficient of 0.999 was considered acceptable. The carbonyl-DNPH derivates were analyzed using an HPLC system (Agilent 1100 series, Agilent Technologies, Inc.) with a diode array UV-visible detector and a C18 Nucleosil 100-5 column (4 × 250 mm, 5 µm) (Agilent Technologies, Inc.). The mobile phase was a gradient of water (A) and acetonitrile (B). The gradient program was as follows: 0-3 min, 45% (A); 3-5 min, 43% (A); 5-7 min, 30% (A); 7-20, 30% (A). The low rate of the
eluent was 1.5 mL min-1, the column temperature was 38 °C,
and the volume of sample injected was 10 µL. This set of conditions provided the better chromatographic resolution.
The reproducibility of the results was checked by duplicate injection of samples, and the difference was always below 10%. Laboratory and ield blanks were prepared. The ield blanks were transported and handled in the same way as the samples, but were not connected to the pump. Blank runs were performed before each sample analysis. In all experiments, the blanks represented less than 5% and were subtracted from the sample results. The uncertainties of the results were calculated using data from the calibration
curves, as deined by Chui et al.17 as: formaldehyde 12%,
acetaldehyde 10%. Detection and quantiication limits (LOD and LOQ) were calculated using equations (1) and (2):
LOD = 3.3 σ/S (1)
LOQ = 10 σ/S (2)
where S is the slope of the regression equation and σ is
the standard deviation of the residual from the regression
line.18 The limit of detection obtained for formaldehyde and
acetaldehyde were 8.3 ng m-3 and 5.3 ng m-3, respectively.
The limit of quantiication obtained for formaldehyde and
acetaldehyde were 25.0 ng m-3 and 29.2 ng m-3, respectively.
Results and Discussion
The average concentrations of formaldehyde and acetaldehyde are shown in Table 1 and Figure 3. Concentrations of the higher aldehydes were generally very low and in most of the samples were under the limit of
detection. Formaldehyde and acetaldehyde concentrations determined in this work are in the same range as those published previously for downtown Rio de Janeiro and
other Brazilian cities,19 in addition to other recent
non-published results obtained by our laboratory for these areas. This was an expected result since in a recent emission inventory for the metropolitan area of Rio de Janeiro, the contribution of the airport to VOC emissions was estimated
as 0.3% of ixed sources and 0.04% of mobile sources.20
These facts led to the conclusion that aircraft emissions due to Santos-Dumont airport activities may not affect ozone production in a local scale. The rather low concentrations of aldehydes in the idle and taxiway areas may also be due to the airport localization by the Guanabara Bay, a well-ventilated area with small emissions contributions from other sources. Nevertheless, the concentrations of the other pollutants, mainly NOx and CO, should be monitored to assess the real impact of airport activities on the city and the ozone potential of the VOC-NOx mixture. Also the transportation of pollutants to other areas may be investigated using a numerical model.
Acetaldehyde/formaldehyde ratios (on a mass basis) are also shown in Table 1 and Figure 3. The April results show a non-typical behavior, as discussed below. When April is excluded, the values are in the range of 0.7-1.0 in the morning (8:00-10:00 am), which is rather high in comparison to data obtained at Boston’s Logan international airport for idle and taxiway plumes (various
engines)5 and to the results for a CFM-56 engine.6 As
suggested by Herdon et al.,5 variability between engines
should be addressed. In general, the hydrocarbon emission index can be very different from one engine to another. Anyway, the acetaldehyde/formaldehyde ratio seems to be
similar for different engines at the same conditions.5 The
European Environmental Agency (EEA)3 report an average
acetaldehyde/formaldehyde ratio (mass) of about 0.3 for one commercial aircraft, based on a standard landing and
take-off (LTO) cycle, as deined by the ICAO.21 For
take-off plumes, the mean value is 3.0.5 The ratio reported in
this work, 2.1-3.3 times higher than the expected value for idle and taxiway plumes, may be due to the combined contribution of idle, taxiway and take-off plumes. For Zurich airport some discrepancies with the emission indices for aircraft reported by the ICAO were also found and showed that real-world values may differ from certiicated emission
indices.7 Also, other emission sources should be considered,
including diesel ground support vehicles; however, their contribution have not been estimated for Santos-Dumont airport. For Antonio Carlos Jobim international airport (Rio de Janeiro) this contribution has been calculated as about
airport to transport passengers to and from the aircraft. For diesel vehicles, formaldehyde emissions are expected to be signiicantly higher than acetaldehyde. The acetaldehyde/
formaldehyde ratio reported by de Andrade et al.22 for a
given bus station was about 0.35. Additionally, light-duty vehicles in the parking area and circulating in the vicinity of the airport may contribute to aldehydes emissions. In Brazil, the acetaldehyde/formaldehyde ratios determined in urban areas are generally high due to the use of
ethanol-containing fuels.19 In 2001, Montero et al.11 reported ratios
in the range 1.0-2.0 (mass). Similar values were reported for a commercial mall parking lot and a business building parking lot, which may be considered a light duty vehicle
signature.22 The acetaldehyde emissions of these vehicles
should contribute to increased acetaldehyde/formaldehyde ratios within the airport area.
In the afternoon, formaldehyde concentrations were lower and acetaldehyde concentrations generally increased. Also, acetaldehyde/formaldehyde ratios were 7-10 times higher than the expected values based on ICAO emissions
measurements.3 The reported aldehyde concentrations are
clearly the combined result of aircraft emissions, transport to and from the airport and atmospheric chemistry. This fact may be attributed to several factors. The number of landings and take-offs varies during the day. In the early morning (07:00-10:00 am), aircraft trafic is heavy, with four times more landings and take-offs than in the early afternoon. Consequently, the emissions during the morning are expected to be higher than in the afternoon. Moreover, the lifetime of formaldehyde is much shorter than the lifetime of acetaldehyde. Aldehydes are important constituents of atmospheric chemistry and their reactions
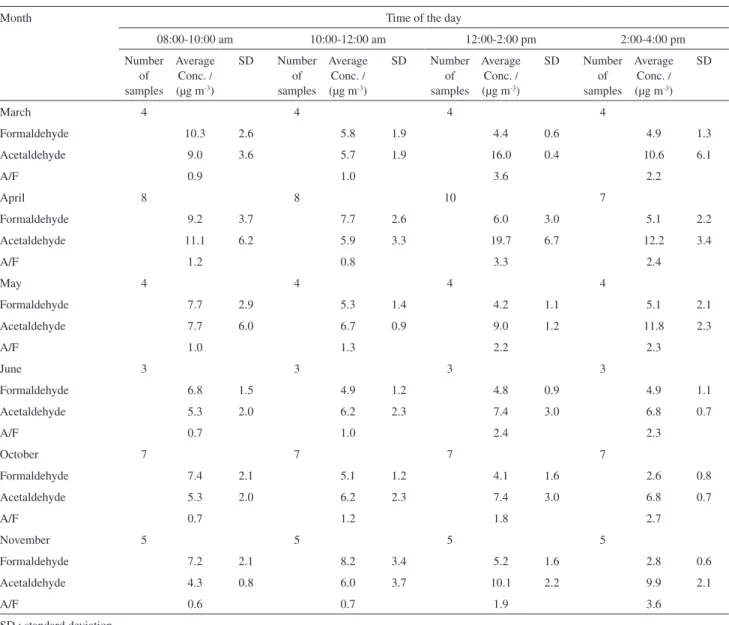
Table 1. Average formaldehyde and acetaldehyde concentrations, standard deviations and acetaldehyde/formaldehyde ratios (in mass units) obtained at the sampling site at the Santos-Dumont airport. Samples were collected during the period March to November 2007
Month Time of the day
08:00-10:00 am 10:00-12:00 am 12:00-2:00 pm 2:00-4:00 pm
Number of samples
Average Conc. / (µg m-3)
SD Number of samples
Average Conc. / (µg m-3)
SD Number of samples
Average Conc. / (µg m-3)
SD Number of samples
Average Conc. / (µg m-3)
SD
March 4 4 4 4
Formaldehyde 10.3 2.6 5.8 1.9 4.4 0.6 4.9 1.3
Acetaldehyde 9.0 3.6 5.7 1.9 16.0 0.4 10.6 6.1
A/F 0.9 1.0 3.6 2.2
April 8 8 10 7
Formaldehyde 9.2 3.7 7.7 2.6 6.0 3.0 5.1 2.2
Acetaldehyde 11.1 6.2 5.9 3.3 19.7 6.7 12.2 3.4
A/F 1.2 0.8 3.3 2.4
May 4 4 4 4
Formaldehyde 7.7 2.9 5.3 1.4 4.2 1.1 5.1 2.1
Acetaldehyde 7.7 6.0 6.7 0.9 9.0 1.2 11.8 2.3
A/F 1.0 1.3 2.2 2.3
June 3 3 3 3
Formaldehyde 6.8 1.5 4.9 1.2 4.8 0.9 4.9 1.1
Acetaldehyde 5.3 2.0 6.2 2.3 7.4 3.0 6.8 0.7
A/F 0.7 1.0 2.4 2.3
October 7 7 7 7
Formaldehyde 7.4 2.1 5.1 1.2 4.1 1.6 2.6 0.8
Acetaldehyde 5.3 2.0 6.2 2.3 7.4 3.0 6.8 0.7
A/F 0.7 1.2 1.8 2.7
November 5 5 5 5
Formaldehyde 7.2 2.1 8.2 3.4 5.2 1.6 2.8 0.6
Acetaldehyde 4.3 0.8 6.0 3.7 10.1 2.2 9.9 2.1
A/F 0.6 0.7 1.9 3.6
have been discussed in detail.19 They are emitted by
anthropogenic sources as a result of incomplete combustion processes and evaporative losses, in addition to emission from trees and other vegetation. They are also formed in the atmosphere from photochemical degradation of other
organic compounds. As discussed by Andrade et al.,19
the main precursors of aldehydes are alkanes and oleins, through their reaction with reactive species, such as OH,
NO3, O3 and HO2. The formed alkyl radicals then react
with NO and O2,leading to aldehydes. Aldehydes undergo
photolysis, reaction with OH radicals and reaction with
NO3 radicals. This last process is of minor importance as
consumption processes for aldehydes. The OH reaction with aldehydes involves H-atom abstraction to produce the
corresponding acyl radical, which rapidly adds O2 to yield
an acyl peroxy radical, which then reacts with NO or NO2,
the latter leading to peroxyacyl nitrates.
According to de Andrade et al.,19 the lifetime of
formaldehyde is about 6.3 h in the summer and 8.1 h in the winter, due to photolysis, while the lifetime of acetaldehyde is about 3.3 days in the summer and 5 days in the winter. The rate coeficient for OH reaction is similar for both compounds. This fact may also contribute to the decrease in formaldehyde concentrations during the day. Acetaldehyde levels increase and remain nearly constant because of the low reactivity of this compound, which favors accumulation and secondary formation through the reaction of other organic compounds emitted by aircrafts. Meteorological data show that, in general, wind speed and pollutant dispersion are higher in the afternoon, favoring the contribution of other emission sources.
A rather different behavior was observed in April, in which higher ratios occurred in the morning (about 1.2). During April, air-traffic controllers went on a national strike and aircraft departures and landings were signiicantly different than under standard conditions. Typically, no more than one airplane is in the idle and taxiway areas. During the strike, several airplanes remained parked, frequently with their engines on for long periods of time. Generally, all lights were delayed. Engine emissions measured by the International Civil Aviation Organization showed that NOx, VOC and CO emissions are different during the idle, approach, climb-out and take-off periods, due to the thrust conditions, which determine the completeness of the combustion process. During low thrust conditions, combustion is incomplete, resulting in higher emissions of CO and VOC. During high thrust levels, the temperature of the engine reaches maximum values and combustion is nearly complete. The concentrations measured in April may be more typical of the queuing time when the engines are in the idle phase. The results shown in Table 1 show a slight increase in the total (formaldehyde + acetaldehyde) and acetaldehyde concentrations during April, mainly in the 8:00-10:00 am period, when the departures and landings were most affected by the strike. No information is known regarding VOC composition during each engine phase; however, differences cannot be neglected. The contribution of land-based vehicular trafic in the vicinity of the airport may also need to be considered. The acetaldehyde emissions by light duty vehicles, fueled with ethanol and ethanol-blended gasoline, were probably higher due to higher number of passengers circulating in the area.
The acetaldehyde/formaldehyde ratios recorded in the mornings were slightly lower than the values obtained in urban areas, where vehicular emissions are the main source
of pollution,19 and show different behavior throughout the
day. In urban areas, this ratio decreases throughout the
day,11 while near the airport higher values were obtained
in the afternoon. This may be due to differences in the photo-oxidation processes that form secondary aldehydes from other volatile organic compounds and to the diurnal pattern of emissions sources.
Conclusions
In this work, the formaldehyde and acetaldehyde levels were determined at a national airport located near a downtown area. Acetaldehyde/formaldehyde ratios were measured in a range of 0.7-1.0 during the early morning, when aircraft´s trafic is heavy and photochemical processes may be less important. After midday, acetaldehyde concentrations increased, relecting secondary production
via photo-oxidation of volatile organic compounds. The
acetaldehyde/formaldehyde ratios recorded in the mornings were slightly lower than the values obtained in urban areas, where vehicular emissions are the main source of pollution and show different behaviors throughout the day. In urban areas, this ratio decreases throughout the day, while near the airport higher values were obtained in the afternoon. This may be due to differences in the photo-oxidation processes that form secondary aldehydes from other volatile organic compounds and to the diurnal pattern of emissions sources. The contribution of other sources, including ground support-vehicles, which are fueled by diesel, and light duty vehicles circulating in the neighborhood areas, may also need to be considered. Nevertheless, formaldehyde and acetaldehyde airport concentrations are in the same range than values determined in the urban area and their contribution to the increase of ozone levels may be negligible. This is, to our knowledge, the irst report of aldehyde levels at a South American airport. New data should be obtained with a simultaneous recording of meteorological parameters.
In summary, formaldehyde/acetaldehyde ratios seem to be slightly affected by aircraft emissions, while total concentrations are not very different than those determined in downtown. As a consequence, the airport activities would have probably a negligible effect on the urban atmosphere composition.
Acknowledgments
References
1. Perl, A.; Patterson, J.; Perez, M.; Transportation Research Part D: Transport and Environment 1997, 2, 89.
2. Pison, I.; Menut, L.; Atmos. Environ.2004, 38, 971.
3. EEA (European Environmental Agency), Emission Inventory Guidebook, Air Traffic, SNAP Codes 080501-080504,
Kopenhagen, Denmark, 2001; http://reports.eea.eu.int/ EMEPCORINAIR4/en/B85vs2.4.pdf, accessed in February 2007.
4. Moussiopoulos, N.; Sahm, P.; Karatzas, K.; Papalexiou, S.; Karagiannidis, A.; Atmos. Environ.1997, 31, 1497.
5. Herdon, S. C.; Rogers, T.; Dunlea, E. J.; Jayne, J. T.; Miake-Lye, R.; Knighten, B.; Environ. Sci. Technol. 2006, 40, 4406. 6. Spicer, C. W.; Holdren, M. W.; Riggin, R. M.; Lyon, T. F.;
Annales Geophysicae1994, 12, 944.
7. Schurmann, G.; Schafer, K.; Jahn, C.; Hoffmann, H.; Bauerfeind, M.; Fleuti, E.; Rappengluck, B.; Atmos. Environ.
2007, 41, 103.
8. Simões, A. F.; Schaeffer, R.; Energy Convers Manage2005, 46, 501.
9. Ribeiro, S. K.; Real, M. V.; D’Agosto, M. A.; A contribuição aeroportuária na poluição atmosférica local: o caso do
aeroporto internacional do Rio de Janeiro. In Anais do XV Congresso de Pesquisa e Ensino em Transportes, Campinas, 2001; http://www.ivig.coppe.ufrj.br/doc/pdf, accessed in June 2008.
10. http://www.cleanairnet.or/lac_en/1415/channel.htm, accessed in May 2009.
11. Montero, L.; Vasconcellos, P. C.; Souza, S. R.; Pires, M. A. F.; Sanchez-Ccoyllo, O. R.; Andrade, M. F.; Carvalho, L. R. F.; Environ. Sci. Tecnol.2001, 35, 3071.
12. IBGE (Instituto Brasileiro de Estatística e Geograia), IBGE, Cidades, http://www.ibge.gov.br/cidades, accessed in June 2008.
13. INFRAERO (Empresa Brasileira de Infra-Estrutura Aeroportuária), Infraero Aeroportos, Movimento dos Aeroportos; http//www.infraero.gov.br, accessed in June 2008. 14. REDEMET (Rede de Meteorologia do Comando da
Aeronáutica), Produtos Meteorológicos; http://www.redemet. aer.mil.br/produtos.php?ID_REDEMET=4e3cbfb555d9ec7ed 6865af49c48ef89, accessed in November 2007.
15. US-EPA, United States Environmental Protection Agency, Compendium method TO-11: Method for the determination of formaldehyde in ambient air using adsorbent cartridge followed by high performance liquid chromatography (HPLC) In Compendium of Methods for the Determination of Toxic Organic Compounds in Ambient Air, Report No. EPA/600/4-89/018, US-EPA, Research Triangle Park, NC, 1998. 16. Corrêa, S. M.; Martins, E. M.; Arbilla, G.; Atmos. Environ.
2003, 37, 23.
17. Chui, Q. S. H.; Zucchini, R. R.; Lichtig, J.; Quim. Nova 2001, 24, 374.
18. Ribani, M.; Bottoli, C. B. G.; Collins, C. H.; Jardim, I. C. S. F.; Melo, L. F. C.; Quim. Nova2004, 27, 771.
19. de Andrade, J. B.; Andrade, M. V.; Pinheiro, H. L. C.; Pereira, P. A.; Quim. Nova2002, 25, 1117.
20. Ecosoft Report, 2009; unpublished results, personal communication.
21. ICAO (International Civil Aviation Organization. Aircraft Engine Emissions); http://www.caa.co.uk/docs/702/ introduction-05102004.pdf, accessed in June 2007.
22. de Andrade, J. B.; Andrade, M. V.; Pinheiro, H. L. C.; J. Braz. Chem. Soc.1998, 9, 219.
Received: March 2, 2009