Artigo Original
Ben Barsties1
Rudi Verfaillie2
Nelson Roy3
Youri Maryn4
Keywords
Body mass index Adipose tissue Voice quality Larynx Air Analysis
Descritores
Índice de massa corporal Tecido adiposo Qualidade da voz Laringe Análise do Ar
Correspondence address:
Ben Barsties
HU University of Applied Sciences Utrecht, Bolognalaan 101, PO Box 85182,3508 AD Utrecht, The Netherlands.
E-mail: [email protected]
Received: 02/20/2013
Accepted: 08/02/2013
Study carried out at Zuyd University, Heerlen, The Netherlands.
(1) School of Health Care, HU University of Applied Sciences Utrecht, Utrecht,The Netherlands. (2) Department of Speech-Language Pathology and Audiology, Zuyd University, Heerlen, The Netherlands. (3) Department of Communication Sciences and Disorders, The University of Utah, Salt Lake City, Utah, USA. (4) Department of Otorhinolaryngology, Head & Neck Surgery, Speech-Language Pathology and Audiology, Sint-Jan General Hospital, Bruges, Belgium.
Conlict of interests: nothing to declare.
quality, phonatory range, and aerodynamics in females?
O índice de massa corporal e o volume de gordura inluenciam
a qualidade vocal, extensão fonatória e
aerodinâmica em mulheres?
ABSTRACT
Purpose: To analyze the impact of body weight and body fat volume on selected parameters of vocal quality, phonatory range, and aerodynamics in females. Methods: Based on measurements of body mass index in combination with body fat volume, 29 normophonic female subjects were classiied as normal weight, underweight, and obese. Voice quality was investigated via auditory-perceptual ratings of breathiness, roughness, and overall dysphonia severity, via various acoustic measures and a multiparametric index. Phonatory range performance was examined using selected measures of the voice range proile and speech range proile. Measures of vocally relevant aerodynamics included vital capacity (i.e., VC), expected VC, phonation quotient, and maximum phonation time (i.e., MPT). Results: Signiicant differences between the three weight groups were found across several measures of intensity, VC, MPT, and shimmer. As compared to the other groups, signiicantly higher values of maximum and minimum intensity levels, as well as sound pressure level during habitual running speech were observed for the obese group (all p-values<0.05); whereas, the underweight group had signiicantly lower values for VC and ratio of expected to measured VC (p-values<0.01). Furthermore, underweight subjects differed signiicantly as compared to normal weight subjects with lower MPT (p=0.025) and higher lowest-F0 (p=0.035). Finally the obese group showed signiicantly lower shimmer values than the normal weight
subjects (p<0.05). Conclusion: Body weight and body fat volume appear to inluence select objective measures of voice quality, vocal aerodynamics, and phonatory range performance.
RESUMO
Objetivo: Analisar o impacto do peso corporal e do volume de gordura corporal sobre parâmetros selecionados de qualidade vocal, tessitura fonatória e aerodinâmica em indivíduos do sexo feminino. Métodos: Com base em medidas de índice de massa corporal e volume de gordura corporal, 29 indivíduos do sexo feminino, de aparelhos fônicos normais, foram distribuídos em grupos de peso normal, abaixo da média e obesos. A qualidade vocal foi investigada por meio de classiicações auditório-perceptivas de soprosidade, rugosidade e severidade de disfonia por meio de várias medidas acústicas e índice multiparamétrico. O desempenho da tessitura fonatória foi examinado por meio do uso de medidas selecionadas do peril de extensão vocal e peril de extensão discursiva. As medidas de aerodinâmica vocalmente relevantes incluíram capacidade vital (CV), CV esperada, coeiciente fonatório e tempo de fonação máximo (TFM). Resultados: Diferenças signiicativas entre os três grupos foram encontradas em relação a várias medidas de intensidade, CV, TFM e shimmer. Em comparação com os outros grupos, valores signiicativamente maiores de níveis de intensidade máxima e mínima e nível de pressão sonora durante discurso habitual foram observados no grupo obeso (todos os valores de p<0,05); já o grupo abaixo do peso apresentou valores signiicativamente menores para CV e para a proporção de CV esperada em relação à CV medida (valores de p<0,01). Além disso, indivíduos abaixo do peso diferiram signiicativamente quando comparados a indivíduos de peso normal com TFM menor (p=0,025) e F0 menor
INTRODUCTION
Many factors pertaining to the individual — behaviors, habits, personality, traits, health, genetics, body status, drug use, etc. — can lead to or be affected by speciic voice disorders(1).
Therefore, it is useful for the voice clinician to understand these interdependencies. Speciic factors that may be potentially related to voice production/physiology are body weight and body fat volume(1-4). However, the voice literature regarding
the impact of body weight on selected parameters of vocal physiology and phonation is sparse.
To our knowledge, there are only two reports exploring the direct relationship between voice and body weight. First, Da Cunha et al.(2) investigated the difference in various
metrics of voice quality and maximum phonation time between non-obese and morbidly obese (i.e., OB) subjects. Their results showed signiicant differences between the two groups, with the OB group described as vocally disadvantaged. Second, Solomon et al.(3) analyzed the voices of morbidly OB subjects
before and after weight reduction in comparison with a control group of non-OB subjects. They found signiicant changes in perceived vocal pitch and strain and in phonation threshold pressure at comfortable and high pitches following weight loss, but no between-group differences were identiied. Additional research has examined more “indirect” associations between voice and body weight pertaining to factors such as: voice characteristics in cases of bulimia(5) or fasting by women(6).
A number of hypotheses have been offered to explain the relationship between body weight and voice production. According to Sataloff(1) and Sapienza and Ruddy(4), the
con-nection between obesity and voice lies in the interference of excessive body weight on abdominal breath support for voice production. In extreme cases, obesity can even affect resonance due to a signiicantly reduced pharyngeal lumen(4).
Furthermore, it has been asserted that professional voice users who are extremely overweight should avoid rapid loss of weight which may inluence changes in vocal quality and endurance(1). In contrast, being underweight (i.e., UW) is
assumed to affect voice via poor blood circulation, poor physical condition, psychological distress, and sometimes decreased muscle tension/tone(4).
This preliminary investigation aimed to explore the differ-ences in various measures of voice quality, phonatory range, and vocal aerodynamics across three different body weight groups (i.e., normal weight (NW), UW, and OB) in female subjects. A multidimensional assessment of phonatory function was undertaken as recommended by the European Laryngological Society(7) (i.e., auditory-perceptual, acoustic, and
aerody-namic assessment).
To minimize the impact of potential confounding factors on the results (i.e., factors known to inluence voice production related to diseases, habits, occupation, and medication use in young adults), strict exclusion/inclusion criteria were employed to address the following research question: Is there evidence that selected measures of vocal quality, aerodynamics, and phonatory performance differ across three weight categories (i.e., NW, UW, and OB) in females? For this initial preliminary
investigation, females were selected because they report a higher prevalence of voice disorders and more often seek medical attention for those disorders(8).
METHODS
Subjects
From 91 females that were initially asked to participate, 62 did not participate for the following reasons: 55 subjects were excluded based on the inclusion/exclusion criteria, four sub-jects never showed up for the measurement session, and three subjects did not meet the weight criteria described below. Thus, 29 participants were identiied who met the inclusion/exclusion. They ranged in age from 17 to 31 years (mean age=21.4 years, SD=4.2 years). The 29 participants were divided into three weight groups: nine UW, 13 NW, and seven OB using the classiication approach described below.
We aimed to identify young “normophonic” German women using the following strict exclusion criteria: no high vocally demanding profession according to the classiication of Vilkman(9), no elite vocal performer or professional voice user,
no smoking habits in the past year, no alcohol consumption above 25 g per day, no athletic activity more than three times per week (i.e., with the intent to substantially increase physi-cal itness and/or health), no trained voices (ex-trained voices after 2 years with no vocal training in excess of two times per week), no wind-instrument players (ex wind-instrument players after 2 years with no more training than two times per week), no history or family history of voice disorders, no severe or moderate allergic diseases of the upper respiratory tract, no asthma, no relux (i.e., as measured through the relux symptom index(10)), no hyperthyroidism, no other chronic diseases with
an impact on voice, no use of Citalopram, Amitriptyline, or Prozac (antidepressive), no use of ACE-inhibitor or beta-blocker, no use of sex hormone medication such as anabolic steroids or andro-gens,no use of oral contraceptives with estrogen concentration higher than 0.05 mg or Norethisteron, no use of glucocorticoid, no use of corticosteroids,and no use of diuretics. On the day of measurement all subjects had to be free of inluenza or cold symptoms, were recorded between 9.00 a.m. and 4:00 p.m., had no caffeine in the past 4 hours, had no alcohol consumption in the past 24 hours, and were not pregnant. The purpose of the strict exclusion criteria above was to avoid potential confounds by eliminating factors (aside from weight) that could potentially inluence voice production.
This study consisted of a prospective and non-interventional analysis of recordings and measurements. We followed the re-quirements of the declaration of Helsinki — Ethical Principles for Medical Research Involving Human Subjects — and every partici-pant had signed a statement of agreement and data privacy policy.
Measures of body weight and body fat volume
A well-established method to evaluate someone’s body weight is the body mass index (i.e., BMI): mass (kg)/(height (m))2. According
with UW, BMI from 18.50 to 24.99kg/m2 is compatible with NW,
BMI from 25.00 to 29.99kg/m2 is considered overweight, and
BMI≥30.00kg/m2 corresponds with obesity(11). The BMI and body
fat volume relate to each other(12). To increase accurate
differentia-tion between infranormal, normal, and supranormal weight levels, age, gender, and body fat proportion were accounted for using the classiication based on the results of Meeuwsen, Horgan and Elia(12).
In this study, the body fat proportion was anthropometrically determined, because of its superior reliability and validity in comparison to other methods(13-16). The body fat volume was
quantiied with the RH15 9LB Harpender Skinfold Caliper (Baty International, West Sussex, UK) using the equation of Jackson and Pollock(13) to measure the body density, and
sub-sequently this was converted into percentage adipose tissue with the equation of Siri(14). An adapted version of Siri’s equation(15)
was administered in special UW cases. Additionally, the age- and gender-dependent method of McArdle, Katch and Katch(16)
to measure girth of different body sites was applied. To specify the body fat volume, these circumferences were subsequently converted into constant values according to the conversion table of McArdle, Katch and Katch(16).
Finally, the average of the skinfold (i.e., body fat SF) and girth circumference measures (i.e., body fat GM) was computed post-hoc to establish the total body fat (i.e., body fat total). This parameter and the BMI parameter inally determined the group classiication of UW, NW, and OB.
Voice recordings
Depending on the set of measures (i.e., measures of vocal range or measures of voice quality) different data acquisition systems and computer programs were applied to record and analyze the voice samples. All voices were recorded at 44,100 samples per second, saved in wav-format, and analyzed using the following computer programs.
First, voice range proile measures were acquired using the Voice Proiler® 4.2 (Peter Pabon, Alphatron, Rotterdam, The Netherlands).
This system consists of a dual-microphone headset (i.e., two rela-tively close and far microphones to assure continuously calibrated sound recordings), a portable ampliier, and a Soundblaster Extigy audio card.
Second, time-domain and frequency-domain measures of voice quality were obtained using the program Praat (Paul Boersma & David Weenink, Institute of Phonetic Sciences, Amsterdam, The Netherlands)(17). Quefrency-domain measures
of voice quality were acquired with the program Speech Tool (James Hillenbrand, Western Michigan University, Kalamazoo, MI, USA)(18).
Acoustic measures of phonatory range
The Voice Proiler® was used to establish/acquire several
features of the voice range proile during various [a:] produc-tions: softest intensity (i.e., I-min in dB), loudest intensity (i.e., I-max in dB), lowest F0 (i.e., F0-low in Hz), highest F0
(i.e., F0-high in Hz), F0-range (in semitones), and intensity
range (i.e., I-range in dB). Furthermore, the mode of F0 and
the mean of sound pressure level (i.e., SPL) during a minimum of 60 seconds of running speech were acquired as measures of habitual/comfortable speaking fundamental frequency (i.e., SFF) and SPL, respectively.
Auditory-perceptual and acoustic measures of voice quality
First, to acquire auditory-perceptual evaluations of voice quality, two experienced speech-language pathologists (i.e., with 9 and 25.5 years of experience in clinical assessment) who were blinded to weight category listened to all 29 continuous speech samples of the German text “Der Nordwind und die Sonne [The Northwind and the Sun]”, and rated overall hoarseness (i.e, H), roughness (i.e., R), and breathiness (i.e., B) using a four-point equal-appearing interval scale (i.e., 0=normal, 1=slightly disordered, 2=moderately disordered, 3 = severely disordered)(7). The inter-rater
reliability between the two raters was assessed with percent exact agreement and was 82% for H, 62% for R, and 85% for B.
Second, various acoustic analysis methods were applied to yield objective data regarding voice quality. The central 3-sec-ond segment of a sustained vowel [a:] production was extracted. Seven acoustic parameters were computed using the computer programs Praat(17) to quantify voice quality acoustically in both
the time-domain and the frequency-domain: jitter (local), jitter (rap), jitter (ppq5), shimmer (local), shimmer (local, dB), shim-mer (apq11), and mean harmonics-to-noise ratio (i.e., HNR). Two additional acoustic measures of voice quality in the quefrency-domain were determined using the program Speech Tool(18):
cepstral peak prominence (i.e., CPP) and smoothed cepstral peak prominence (i.e., CPPs).
To minimize potential confounding effects of frequency on validity of the acoustic parameters for the sustained vowel productions, subjects were asked to match the F0 of their [a:]
with a note on SFF. Furthermore, post-hoc comparisons of the mean-loudness of the 3-second sustained vowel produc-tions showed no signiicant differences between the three weight groups (UW=72.30±7.18 dB; NW=69.80±4.80 dB; and OB=71.31±2.58 dB) thus conirming the validity of the acoustic analysis that followed (p-values>0.05).
Third, a multivariate index of overall dysphonia severity was administered as well. The Acoustic Voice Quality Index(19) (i.e.,
AVQI) is a six-factor model to measure dysphonia severity in concatenated connected speech and sustained vowel segments and employs two computer programs Praat(17) and Speech Tool(18) for
analysis. Although originally developed for Dutch speakers, the AVQI has also been validated and found reliable in German adults(20).
Vocal aerodynamic measures
First, vital capacity (i.e., VC or the maximum amount of air in mL that can be exhaled after a maximum inhalation) was measured according to the spirometric method of Riester (Jungingen, Germany). Because VC depends on age, gender, and height, the formula of Baldwin, de Cournand and Richards Jr.(21) was administered to convert the measured VC (i.e., VC
M in
between VCM and VCE (i.e., VCM−E in mL) was calculated as a
relative measure of VC.
Second, maximum phonation time (i.e., MPT in seconds) was measured as the longest of three sustained phonations on a comfortably produced vowel [a:]. Simultaneously displayed oscillogram and narrow-band spectrograms in the program Praat(17) were used to record/measure the beginning and end
of phonation as precisely as possible.
Third, phonation quotient (i.e., PQ in mL/s) was calculated as the ratio between VCM and MPT(7).
Statistical methods
All statistical analyses were completed using SPSS for Windows version 15.0 (SPSS Inc., Chicago, IL, USA). To test the signiicance of differences between the three weight groups, the Mann-Whitney U-test was administered on all voice parameters. This non-paramet-ric statistic was chosen because of the relatively low study power (i.e., a low number of participants per weight group)(22).All results
were considered statistically signiicant at p≤0.05.
RESULTS
Subjects
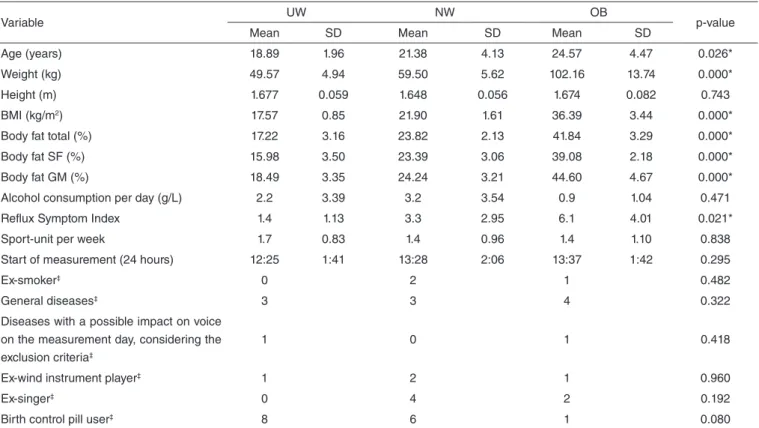
Data on age, height, weight, BMI, relative body fat volume, vocally relevant habits, and other issues related to voice pro-duction for the the three weight groups are summarized in Table 1. Except for their height, the three weight groups differed
signiicantly on the variables age, weight, BMI, and relative adiposity. With a mean of 25 years, the OB subjects were older than the NW (mean age of 21 years) and the UW (mean age of 19 years). Regarding the vocally relevant habits/conditions, only the Relux Symptom Index (i.e., RSI) data differed signiicantly (p=0.021) across these groups: the OB group showed the highest RSI value (mean=6.1) and the UW group showed the lowest RSI values (mean=1.4). Hayfever in spring, neurodermatitis, house dust allergy, hypothyriodism, and gastric ulcer were mentioned as general diseases. However, all these diseases occurred only intermittently, in a particular season of the year or were controlled with medications. These normophonic subjects reported no impact of these conditions on their voices during the period of this study.
Acoustic measures of phonatory range
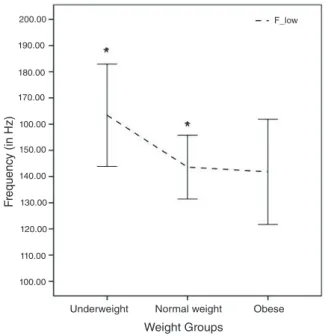
For the majority of the vocal performance measures, no sta-tistically signiicant difference was found among the three weight groups, as presented in Table 2. Only for I-min, I-max, and SPL, the OB group was signiicantly higher than the NW group (p=0.009, p=0.039, and p=0.032, respectively) and the UW group (p=0.016, p=0.014, and p=0.017, respectively), as illustrated in Figure 1. Furthermore, the F0-low in UW was signiicantly higher as
com-pared to the NW group (p=0.035), as shown in Figure 2.
Auditory-perceptual and acoustic measures of voice quality
Most of the auditory-perceptual measures of voice quality revealed no signiicant differences between the three weight
Table 1. Descriptive data of the extra-experimental factors and significance levels of the differences between the three weight groups; ‡ only numbers of subjects shown; p-value was measured with non-parametric Kruskal-Wallis statistic
Variable UW NW OB p-value
Mean SD Mean SD Mean SD
Age (years) 18.89 1.96 21.38 4.13 24.57 4.47 0.026*
Weight (kg) 49.57 4.94 59.50 5.62 102.16 13.74 0.000*
Height (m) 1.677 0.059 1.648 0.056 1.674 0.082 0.743
BMI (kg/m2) 17.57 0.85 21.90 1.61 36.39 3.44 0.000*
Body fat total (%) 17.22 3.16 23.82 2.13 41.84 3.29 0.000*
Body fat SF (%) 15.98 3.50 23.39 3.06 39.08 2.18 0.000*
Body fat GM (%) 18.49 3.35 24.24 3.21 44.60 4.67 0.000*
Alcohol consumption per day (g/L) 2.2 3.39 3.2 3.54 0.9 1.04 0.471
Reflux Symptom Index 1.4 1.13 3.3 2.95 6.1 4.01 0.021*
Sport-unit per week 1.7 0.83 1.4 0.96 1.4 1.10 0.838
Start of measurement (24 hours) 12:25 1:41 13:28 2:06 13:37 1:42 0.295
Ex-smoker‡ 0 2 1 0.482
General diseases‡ 3 3 4 0.322
Diseases with a possible impact on voice on the measurement day, considering the exclusion criteria‡
1 0 1 0.418
Ex-wind instrument player‡ 1 2 1 0.960
Ex-singer‡ 0 4 2 0.192
Birth control pill user‡ 8 6 1 0.080
*Significant differences (p<0.05) between the three weight groups
Table 2. Objective and auditory-perceptual voice quality, voice performance, and aerodynamic measurements of the different weight groups
Measures UW NW OB
AVQI 2.54 (0.57) 2.48 (0.82) 2.21 (0.39)
Jitter (local) 0.451 (0.230) 0.447 (0.223) 0.345 (0.140)
Jitter (rap) 0.277 (0.157) 0.264 (0.136) 0.205 (0.093)
Jitter (ppq5) 0.242 (0.097) 0.260 (0.127) 0.194 (0.067)
Shimmer (local) 1.953 (0.720) 2.410 (1.160)c 1.536 (0.395)b
Shimmer (local, dB) 0.170 (0.063) 0.210 (0.101)c 0.134 (0.034)b
Shimmer (apq11) 1.387 (0.416) 1.718 (0.705)c 1.143 (0.271)b
HNR (dB) 25.104 (4.055) 24.564 (3.126) 26.302 (3.205)
CPP (dB) 18.24 (3.50) 18.47 (2.07) 18.01 (2.85)
CPPs (dB) 8.00 (1.76) 8.22 (1.05) 8.46 (0.69)
H of RBH 0.22 (0.44) 0.12 (0.22) 0.21 (0.39)
R of RBH 0.44 (0.46) 0.62 (0.36) 0.50 (0.41)
B of RBH 0.17 (0.35) 0.12 (0.22) 0.00 (0.00)
I-range (dB) 59.00 (5.13) 59.41 (4.84) 58.88 (5.62)
SPL (dB) 66.16 (3.19)c 67.63 (2.88)c 70.55 (3.08)a,b
I-max (dB) 105.51 (3.09)c 105.32 (3.10)c 110.34 (3.26)a,b
I-min (dB) 46.93 (3.44)c 46.89 (3.47)g 52.25 (3.46)a,f
F0-range in semitones 36.26 (4.72) 36.25 (7.16) 38.76 (2.62)
SFF (Hz) 218.78 (17.51) 205.62 (24.38) 207.86 (21.54)
F0-high (Hz) 1330.81 (237.22) 1237.46 (415.43) 1323.91 (145.74)
F0-low (Hz) 163.41 (25.42)b 143.60 (20.16)a 141.79 (21.75)
VCM (mL) 2695.56 (295.36)
d 3296.92 (376.02)e 3572.14 (613.92)e
VCM−E (mL) -631.00 (235.68)
d +71.38 (305.13)e +346.14 (471.85)e
PQ (mL/s) 166.33 (47.14) 158.08 (32.15) 208.29 (60.65)
MPT (sec) 17.16 (4.01)b 21.61 (4.92)a 17.83 (3.23)
Caption: UW = underweight subjects; NW = normal weight subjects; OB = obese subjects; p-values = comparisons between underweight, normal weight, and obese subjects:
ap<0.05 versus underweight subjects; bp<0.05 versus normal weight subjects; cp<0.05 versus obese subjects; dp<0.01 versus normal weight and obese subjects; ep<0.01 versus
underweight subjects; f p<0.01 versus. normal weight subjects; gp<0.01 versus obese subjects.
Figure 1. Mean and 95% confidence intervals of I-low, habitual intensity (i.e., SPL), and I-max across the three weight groups
*
*
Weight Groups
Underweight Normal weight Obese
F
requenc
y (in Hz)
200.00
190.00
180.00
170.00
100.00
150.00
140.00
130.00
120.00
110.00
100.00
F_low I_max
SPL
I_low
*
*
*
Weight Groups
Underweight Normal weight Obese
Int
ensit
y (in dB)
120.00 115.00 110.00 105.00 100.00 95.00 90.00 85.00 80.00 75.00 70.00 65.00 60.00 55.00 50.00 45.00 40.00
Figure 2. Mean and 95% confidence intervals of F0-low (i.e., minimum fundamental frequency) across the three weight groups
groups. In general, the OB group scored better on the majority of the voice quality measures, except on the CPP and the percep-tion of H and R (see Table 2). However, the only signiicant differences were found for the acoustic measures shimmer (local), shimmer (local dB), and shimmer (apq11) (p=0.013, p=0.013, and p=0.016, respectively), with the OB group scoring signiicantly lower than the NW group (see Figure 3).
Vocal aerodynamic measures
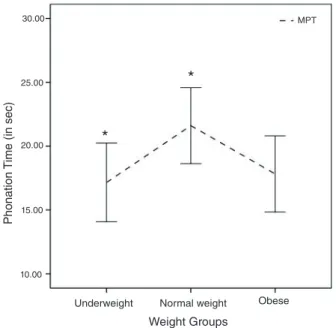
Figure 4 and the data in Table 2 show that the UW subjects differed signiicantly from the NW subjects with lower VCM
Figure 3. Barplots illustrating mean shimmer values ±1 standard error (left: shimmer (local) and shimmer (apq11); right: shimmer (local dB)) across the three weight groups.
Figure 4. Mean and 95% confidence intervals for measured and expected Vital Capacity across the three weight groups
Figure 5. Mean and 95% confidence intervals of Maximum Phonation Time data across the three weight groups
and VCM−E from the NW subjects (p=0.003 and p=0.000,
respectively) and the OB subjects (p=0.005 and p=0.001, re-spectively). Furthermore, the data indicated signiicantly higher MPT values in NW as compared to UW subjects (p=0.025), as shown in Figure 5.
DISCUSSION
In this preliminary study, we explored whether voice produc-tion and quality is inluenced by body weight and adipose tissue proportion by analyzing various aspects of phonatory function across three weight groups in female subjects. Special attention
*
*
Phonation
T
ime (in sec)
30.00
25.00
20.00
15.00
10.00
MPT
Weight Groups
Underweight Normal weight Obese
VC_m VC_m_e
*
*
Weight Groups
Underweight Normal weight Obese
Vit
al C
apacit
y (in mL)
5000.00
4000.00
3000.00
2000.00
1000.00
0.00
-1000.00
Weight Groups
Underweight Normal weight Obese * *
*
*
0.00 1.00 2.00
1.50 2.50 3.00
0.50
Amplitude P
er
turbation (in %)
Shimmer_local Shimmer_apq11
Weight Groups
Underweight Normal weight Obese
*
*
0.00 0.02 0.04 0.06 0.08 0.10 0.12 0.14 0.16 0.18 0.20 0.22 0.24 0.25 0.28 0.30
Amplitude P
er
turbation (in dB)
Shimmer_local_dB
*Differences (p<0.05) between the obese and normal weight groups.
*Significant differences (p<0.01) between the underweight group and the other subjects.
was paid to a number of exclusion/inclusion criteria before enroll-ing the female subjects in this study. Post-hoc statistical analysis conirmed that, on average, the subject groups were highly comparable in terms of the following extra-experimental vari-ables: height and vocally relevant habits and diseases. However, signiicant differences between the three weight groups were identiied for age and relux scores. The signiicant difference for age was judged to be inconsequential because laryngeal morphology remains relatively invariant between 17 and 31 years(1),
and all the participants fell within that range. The three weight groups also differed signiicantly in the RSI data, with the OB subjects scoring highest and the UW subjects lowest on laryngeal-pharyngeal relux symptoms. Elevated RSI values in OB subjects is not uncommon in comparsion to lower weight groups(23). However, like the age factor, the impact of these
RSI indings on the experimental and voice-related data, was likely negligible because all RSI data were below the clinically signiicant threshold of RSI=13, that is, one of this study’s inclusion criteria(10).
Of the 25 experimental variables related to voice quality, vocal performance, and phonatory aerodynamics only 10 differed signiicantly among the three weight groups. Thus, the majority of the results suggested that body weight and body fat volume do not significantly influence voice quality (as measured perceptually and acoustically). However, the following param-eters were observed to differ signiicantly among the groups: shimmer (local), shimmer (local, dB), shimmer (apq11), SPL, I-min, I-max, F0-low, VCM, MPT, and VCM−E. In the sections
that follow we discuss each of the indings and their potential signiicance as these variables appear to be inluenced by body weight and adiposity.
In our study, shimmer values were signiicantly lower for the OB group as compared to the UW group. Why this might be the case is unclear. Shimmer has been found to vary signiicantly with various physiological features and physical conditions(24,25),
and thus indirectly (i.e., via physiological/physical status) may be sensitive to body weight. Furthermore, shimmer (as well as jitter) is inversely related to SPL, gender, and F0, and we
wondered whether lower shimmer values may merely relect differences in SPL and F0 between the OB and NW, and UW
subjects during sustained vowel productions(26). However, the
SPL and F0 data from the vowel used to analyze the pertubation
measures did not differ signiicantly across the three weight groups, and thus the differences in shimmer cannot be attributed exclusively to variability in SPL, F0, and/or gender. Therefore,
these differences are not an artifact of measurement conditions. Instead, it seems that future attempts to establish normative values for shimmer may need to consider weight differences as a possible factor contributing to measurement variability.
Although no differences in intensity were observed for the sustained vowel productions used in the acoustic analysis of shimmer, it is interesting to note that OB subjects when compared to the other subjects, showed signiicantly higher I-min, I-max, and habitual SPL in continuous speech data. Thus, it appears that OB subjects phonate at higher habitual intensity levels, and can produce higher maximal voice in-tensity, but are unable to phonate as quietly as the other subjects.
OB subjects have greater diaphragmatic motion and weight, and therefore have higher respiratory muscle strength(27). Consequently
more respiratory airlow power is available, potentially resulting in higher subglottal pressure in phonatory airlow parameters by OB subjects as evidenced in the study of Solomon et al.(3). Raising
subglottal air pressure generally translates to increased vocal intensity through more air which is pushed through the glot-tis thus expanding the glottal low wave(1). Why OB subjects
vocalized in continuous speech at increased intensity levels is not entirely clear. However, one possible reason underlying the inability of the OB subjects to produce quiet voice may be related to increased resistance through added mass to the vocal folds or surrounding tissues(3). For instance, it is possible that
a reduced diameter of the pharyngeal lumen as seen in many OB individuals (related to redundant intraluminal adipose tissue) contributes to increased supralaryngeal resistance. Thus, increased subglottal pressure is needed to overcome the attenuating/damping effects of increased pharyngeal resistance. The effect of increased pharyngeal resistance potentially reduces the ability of an OB person to produce soft phonation. That is, the minimum amount of pres-sure required to produce voice is elevated because of the increased resistance encountered downstream. These effects may help to explain the higher vocal intensities in OB subjects, and reduced ability to produce soft phonation.
On the basis of our results, the hypothesis that being UW leads to increased F0 via possible vocal fold mass reduction is
not supported and conirms the assertion of Titze(28) that vocal
fold length, biomechanical stress, and laryngeal muscle activity are the principle variables responsible for changing F0. Except
for the relatively small difference of 20 Hz in F0-low between
the UW and NW subjects, no F0-related data differed
signii-cantly between the three weight groups.
Turning our attention to aerodynamic measures, the VCM
was signiicantly lower in the UW subjects than in the other subjects. Also the MPT, although never falling below the nor-mative threshold of 10 seconds(7), was signiicantly shorter
in the UW participants. Comparison of NW and OB females yielded no strong differences, and although the VCM was higher
in the OB subjects, their MPT’s were clearly shorter than in the NW subjects. The signiicant differences in lung capacity of UW as compared to NW and OB might be explained by the effect of signiicantly less movement, weight, and strength of the diaphragm in UW persons(27) and hence worse performance
during pulmonary testing(29). This hypothesis to explain the
results seems bolstered when one considers the equivalent re-spiratory status, health, physical condition, and non-signiicant differences in height and athletic involvement between the three weight groups.
The significantly higher MPT observed for the NW as compared to the UW subjects appears to not be solely related to the differences in their VCM performances (i.e.,
approximately 600 mL less VCM in UW as compared to NW
subjects). Solomon, Garlitz and Milbrath(30) reported a weak
correlation between VCM and MPT, but a stronger correlation
However, the OB group displayed much higher VCM as
com-pared to the UW. Thus, the aerodynamic indings of this study combined with the results of Solomon et al.(3) and Solomon,
Garlitz and Milbrath(30) suggest that weight may inluence
laryngeal airway resistance and subsequently MPT and VC.
Limitations
While the results from this preliminary, cross-sectional investi-gation are intriguing and allow us to describe associations between variables, we cannot establish causal relationships between BMI and fat volume and vocal quality. In addition to this speciic limita-tion, a number of additional limitations should be acknowledged.
The irst limitation pertains to the relatively small number of participants in each weight group leading to reduced power and dificulty establishing causality between body weight and voice-related data. Future research on this topic should there-fore include a much larger sample of females. Furthermore, the inluence of body weight and adiposity on phonation should also be investigated in males.
A second limitation is the absence of laryngeal imaging (i.e., laryngoscopic, laryngostroboscopic, videokymography, and high-speed digital imaging). In the absence of such imag-ing it is impossible to know the true status/health of the vocal folds and surrounding structures. Thus, the indings would have been strengthened by additional information regarding laryngeal/vocal structure and physiology. Future studies should include endoscopic methods to place these results in context.
A third limitation is the absence of self-evaluation data, for example, from the Voice Handicap Index, the Voice Activity and Participation Proile, or the Voice-Related Quality of Life. In this study, subjects were determined to be vocally healthy/ normophonic based on a number of criteria. However, it would be interesting to focus on the subjects’ own experiences and to assess whether the outcome on voice-related quality-of-life questionnaires differs across the three weight groups such as in a dysphonic population.
A fourth limitation is related to the hypothesis regarding the potential inluence of oral–pharyngeal lumen variation on laryngeal-vocal functioning. The methods employed in this study do not permit a true test of this hypothesis. Future research could perhaps use imaging techniques or acoustic methods (i.e., formant analysis) to assess if there is evidence to suggest differences in OB subject’s vocal tract dimensions as compared to subjects of NW.
CONCLUSION
These limitations notwithstanding, the results of this preliminary study of vocally normal females suggest that body weight and fat content do not signiicantly alter most parameters of voice quality, vocal performance, and aero-dynamics. However, several interesting patterns emerged with body weight (especially with a focus on fat content) inluencing specifc aspects related to amplitude pertubation, intensity, F0, VC, and MPT.
ACKNOWLEDGMENTS
Special thanks to Ludo van Etten and Dennis Odekerken (Department of Biometrics, Zuyd University, Heerlen, The Netherlands) for their support, knowledge, and instrumentation to acquire biometrical measurements. Very special thanks to Nena Schiffers, ofice director of the Selection Fitness Studio, Herzogenrath, Germany, for assistance in recruiting subjects for this study.
*BB was responsible for collecting and tabulating data; RV and YM collaborated with the collection and tabulation, and supervised the data collection; All authors accompanied the collection and collaborated with the data analysis; All authors was responsible for the design and study design and general orientation of stages of execution and manuscript preparation.
REFERENCES
1. Sataloff RT. Professional voice: the science and art of clinical care. 3rd ed.
San Diego, CA: Plural Publishing; 2005.
2. Da Cunha MG, Passerotti GH, Weber R, Zilberstein B, Cecconello I. Voice feature characteristic in morbid obese population. Obes Surg. 2011; 21(3):340-44.
3. Solomon NP, Helou LB, Dietrich-Burns K, Stojadinovic A. Do obesity and weight loss affect vocal function? Semin Speech Lang. 2011; 32(1):31-42.
4. Sapienza C, Ruddy BH. Voice disorders: a textbook. San Diego, CA: Plural Publishing; 2009.
5. Ferreira CP, Gama AC, Santos MA, Maia MO. Laryngeal and vocal analysis in bulimic patients. Braz J Otorhinolaryngol. 2010;76(4):469-77. 6. Hamdan AL, Sibai A, Rameh C. Effect of fasting on voice in women. J
Voice. 2007;21(4):495-501.
7. Dejonckere PH, Bradley P, Clemente P, Cornut G, Crevier-Buchman L, Friedrich G, Van De Heyning P, Remacle M, Woisard V; Committee on Phoniatrics of the European Laryngological Society (ELS). A basic protocol for functional assessment of voice pathology, especially for investigating the eficacy of (phonosurgical) treatments and evaluating new assessment techniques. Guideline elaborated by the Committee on Phoniatrics of the European Laryngological Society (ELS). Eur Arch Otorhinolaryngol. 2001;258(2):77-82.
8. Cohen SM, Kim J, Roy N, Asche C, Courey M. Prevalence and causes of dysphonia in a large treatment-seeking population. Laryngoscope. 2012;122(2):343-8.
9. Vilkman E. Voice problems at work: a challenge for occupational safety and health arrangement. Folia Phoniatr Logop. 2000;52(1-3):120-5. 10. Belfasky PC, Postma N, Koufman JA. Validiy and reliability of the Relux
Symptom Index (RSI). J Voice. 2002;16(2):274-7.
11. WHO. Physical status: the use and interpretation of anthropometry. Report of a WHO Expert Committee. WHO Technical Report Series 854. Geneva: World Health Organization; 1995.
12. Meeuwsen S, Horgan GW, Elia M. The relationship between BMI and percent body fat, measured by bioelectrical impedance, in a large adult sample is curvilinear and inluenced by age and sex. Clin Nutr. 2010;29(5):560-6.
13. Jackson AS, Pollock ML. Practical assessment of body composition. Physician Sportsmed. 1985;13:76-90.
14. Siri WE. The gross composition of the body. Adv Biol Med Phys. 1956;4:239-80.
15. Heyward V, Wagner D. Applied body composition assessment. 2nd ed. Champaign, IL: Human Kinetics; 2004.
16. McArdle WD, Katch FI, Katch VL. Exercise physiology, International Edition: nutrition, energy, and human performance. 7th ed. Lippincott
17. Boersma P, Weenink D. Praat: Doing phonetics by computer, Version 5.1.35 [computer program]. Amsterdam, The Netherlands: Institute of Phonetic Sciences. [cited 2011 Sep 25]. Available from: http://www.praat.org 18. Hillenbrand J. Speech Tool, Version 1.65 [computer program]. [cited
2011 Sep 25]. Available from: http://homepages.wmich.edu/~hillenbr/. 19. Maryn Y, Corthals P, Van Cauwenberge P, Roy N, De Bodt M. Toward
improved ecological validity in the acoustic measurement of overall voice quality: combining continuous speech and sustained vowels. J Voice. 2010;24:540-55.
20. Barsties B, Maryn Y. Der Acoustic Voice Quality Index in Deutsch: Ein Messverfahren zur allgemeinen Stimmqualität. HNO. 2012;60:715-20. 21. Baldwin E, de Cournand FA, Richards DW Jr. Pulmonary insuficiency;
physiological classiication, clinical methods of analysis, standard values in normal subjects. Medicine. 1948;27:243-78.
22. Portney LG, Watkins MP. Foundations of clinical research: applications to practice. 2nd ed. Prentice Hall Inc, Upper Saddle River, New Jersey; 2000.
23. Saruç M, Aksoy EA, Vardereli E, Karaaslan M, Ciçek B, Ince U, et al. Risk factors for laryngopharyngeal relux. Eur Arch Otorhinolaryngol. 2012;269(4):1189-94.
24. Ringel RL, Chodzko-Zajko WJ. Vocal indices of biological age. J Voice. 1987;1(1):31-7.
25. Chodzko-Zajko WJ, Ringel RL. Physiological itness measures and sensory and motor performance in aging. Exp Gerontol. 1987;22(5):317-28. 26. Brockmann M, Drinnan MJ, Storck C, Carding PN. Reliable jitter and
shimmer measurements in voice clinics: the relevance of vowel, gender, vocal intensity, and fundamental frequency effects in a typical clinical task. J Voice. 2011;25(1):44-53.
27. Kantarci F, Mihmanli I, Demirel MK, Harmanci K, Akman C, Aydogan F, et al. Normal diaphragmatic motion and the effects of body composition: determination with M-mode sonography. J Ultrasound Med. 2004;23(2):255-60.
28. Titze IR. Vocal fold mass is not a useful quantity for describing F0 in vocalization. J Speech Lang Hear Res. 2011;54(2):520-2.
29. Lan CC, Su CP, Chou LL, Yang MC, Lim CS, Wu YK. Association of body mass index with exercise cardiopulmonary responses in lung function-matched patients with chronic obstructive pulmonary disease. Heart Lung. 2012;41(4):374-81.