AR
TICLE
1 Centro Estadual de Vigilância em Saúde, Secretaria de Estado da Saúde do Rio Grande do Sul. R. Domingos Crescencio 132/305, Santana. 90050-900 Porto Alegre RS Brasil. renata. mondini@ yahoo.com.br
Identification of priority Health Regions in the State of Rio
Grande do Sul, Brazil, for Health Surveillance actions
Abstract This paper aimed to identify the pri-ority Health Regions of Rio Grande do Sul (RS) to implement Health Surveillance strengthening actions. This is a descriptive study with data from time series of 11 (eleven) Health Surveillance in-dicators of the Ministry of Health’s 2016 Guide-lines, Objectives, Targets and Indicators Journal agreed by the Bipartite Interagency Committee/ RS. The selected indicators are synthesized to pro-duce a Composite Health Surveillance Assessment Indicator (ICAVES) for each of the 30 Health Re-gions of the state, creating values ranging from zero (worst) to 1 (best), using the Human De-velopment Index (HDI) construction calculation method. The lowest rates of the composite indica-tor are found in the Health Regions “20-Rota da Produção” and “19-Região do Botucaraí”. These two Health Regions are priorities for the strength-ening of collective Health Surveillance actions and the management of health risks and diseases, considering horizontal equity as guideline of the Unified Health System.
Key words Public Health Surveillance, Regional health planning, Health status indicators, Health priorities, Health equity
Renata Petzhold Mondini 1
Ivone Andreatta Menegolla 1
M
ondini RP Introduction
In 2012, in Rio Grande do Sul, the Unified Health System (SUS) regionalization process established thirty (30) Health Regions with a view to inte-grating the organization, planning and execution
of actions and health services1. Thus,
manage-ment planning in Rio Grande do Sul is based on
the territory organization by Health Regions1-3.
Ministry of Health’s (MS) 2016 Guidelines, Objectives, Targets and Indicators Journal is one of SUS management tools used for health plan-ning, aiming to guide the national process of in-terfederative agreement. The document shows the qualification cards of 29 health indicators es-tablished for the year 2016, divided into univer-sal of common and compulsory agreement, and specific, of compulsory agreement according to
territory specifics4.
The Ministry of Health recommends, for each of the 29 indicators, national benchmarks for the agreement of objectives. Among them, in 2016, the Bipartite Interagency Committee of Rio Grande do Sul (CIB/RS) agreed eleven Health
Surveillance indicators5. Thus, technicians from
the State Health Surveillance Center (CEVS) published the time series of the eleven indicators, of which five had their objectives agreed with val-ues below the benchmark recommended by the
MS, and one with value above benchmark5,6.
The health indicators seen together and reg-ularly in a dynamic system provide the basis for the epidemiological evaluation of the health sit-uation and, consequently, for the priority
inter-ventions in the health reality of the territories7.
Based on the Human Development Index (HDI)
calculation, Silva Junior8 constructed a
Com-posite Health Surveillance Assessment Indicator (ICAVES) that synthesizes a given list of indica-tors in a single value.
In the context of the heterogeneous organi-zation of the health system between the regions, this study aims to evaluate the performance of Health Surveillance in Rio Grande do Sul and its Health Regions, based on the 11 (eleven) Health Surveillance indicators agreed in the CIB/RS for 2016. Thus, it seeks to identify the most vulner-able Health Regions that require greater insti-tutional support, aiming to promote equity in health3,9-11.
Methodology
This is an applied, descriptive and quantita-tive approach carried out with secondary data available on the website of the State Health
Sec-retariat of Rio Grande do Sul6,12. The study was
constructed with the time series of 11 (eleven ) Health Surveillance indicators by Health Region contained in the 2016 Guidelines, Objectives, Targets and Indicators Journal of the Ministry of Health agreed by the Bipartite Interagency
Committee/RS for 20164,5. This list includes
envi-ronmental, epidemiological, health and Worker’s
Surveillance indicators4.
The time series cover a period of 7 years (2009-2015), however, four indicators have shorter time series. Three criteria were used to select the indicators, namely: included in the 2016 Guidelines, Objectives, Targets and Indica-tors Journal; agreed by the Bipartite Interagen-cy Committee/RS for 2016; and Health Surveil-lance-related.
Chart 1 shows the selected indicators, the surveillance sector to which they belong, data sources and the periods used to calculate time series.
A Composite Health Surveillance Assessment Indicator (ICAVES) was constructed from the se-lection of the indicators, which synthesizes in a single value – Partial Index – the Health Surveil-lance performance for the state of Rio Grande de
Sul and for its 30 Health Regions6.
The methodology for the construction of the ICAVES described in literature is based on the Human Development Index (HDI), since it is a widely used composite indicator that synthesizes
in a single index6 the partial indices of
longevi-ty, education and income that vary between zero (worst) and 1 (best).
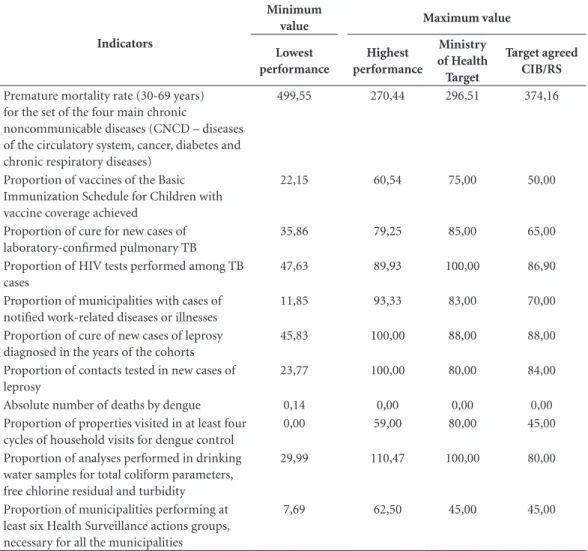
Initially, in order to build the ICAVES, it was necessary to establish parameters, according to the State’s reality, for the values of variables used in the calculation formula of the Partial Index, namely: observed value, minimum value and maximum value. The Partial Index is the ratio of the observed value minus the minimum value and maximum value minus the minimum value.
e C
ole
tiv
a,
22(10):3429-3437,
2017
means – making a total of 330 means (30 Health Regions x 11 Indicators).
The value assigned to the “minimum value” variable is the mean of the time series of the Health Region with lower performance in each indicator.
As for the “maximum value” variable, three parameters were adopted, namely: (1) Target rec-ommended by the Ministry of Health to agree the 2016 indicator, (2) Target agreed in the CIB/ RS for the 2016 indicator and (3) mean of the Health Region with the highest performance in the indicator. Table 1 shows the values used for the “minimum value” and “maximum value” variables in the three parameters.
The purpose of using three parameters is to verify the differences and similarities between re-sults and avoid parameter bias.
The next step is the calculation of the Com-posite Health Surveillance Assessment Indicator (ICAVES) index, which consists of the mean of the 11 partial indices of each Health Region. Thus, each of the 30 Health Regions has a single index.
The calculation of the partial indexes and ICAVES was performed for the three parameters defined for the maximum value variable: (1)
Tar-get recommended by the Ministry of Health to agree the 2016 indicator, (2) Target agreed in the CIB/RS for the 2016 indicator and (3) the mean of the Health Region with the highest perfor-mance in the indicator. Thus, state ICAVES was calculated through the mean of the indexes of the 30 Health Regions.
Results
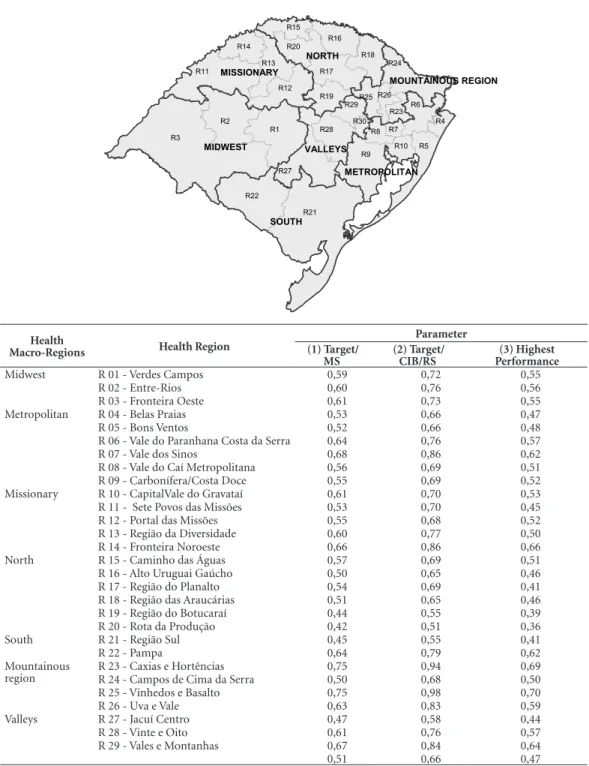
Rio Grande do Sul is divided into 30 Health Re-gions comprised in seven Health Macro-ReRe-gions. Health Regions 19 (Região do Botucaraí) and 20 (Rota da Produção) showed the lowest ICAVES in the three Parameters used in the calculation: (1) National Parameter, (2) Agreement in CIB/ RS and (3) Best mean of the thirty time series cal-culated for each indicator. These two Health Re-gions are located in the Northern Macro-Region. The Rota da Produção has the lowest ICAVES: (1) 0.42, (2) 0.51 (3) 0.36. The Região do Botu-caraí shows the following results: (1) 0.44, (2) 0.55 (3) 0.39. ICAVES for Rio Grande do Sul for Parameters 1, 2 e 3 is, respectively, 0.57, 0.72 and 0.52. Table 2 shows a map of the State and results of ICAVES.
Chart 1. Selection of Health Surveillance indicators agreed in the CIB/RS, data source used to calculate the historical series.
Surveillance, Indicator, Source, Time series / Period - Years
Epidemiological – Premature mortality rate (30-69 years) for the set of the four main chronic noncommunicable diseases (CNCD – disease of the circulatory system, cancer, diabetes and chronic respiratory diseases)
Epidemiological – Proportion of vaccines of the Basic Immunization Schedule for Children with vaccine coverage achieved
Epidemiological – Proportion of cure for new cases of laboratory-confirmed pulmonary TB Epidemiological – Proportion of HIV tests performed among TB cases
Worker’s health – Proportion of municipalities with cases of notified work-related diseases or illnesses Epidemiological – Proportion of cure of new cases of leprosy diagnosed in the years of the cohorts Epidemiological – Proportion of contacts tested in new cases of leprosy
Epidemiological – Absolute number of deaths by dengue
Environmental – Proportion of properties visited in at least four cycles of household visits for dengue control Environmental – Proportion of analyses performed in drinking water samples for total coliform parameters, free chlorine residual and turbidity
Health – Proportion of municipalities performing at least six Health Surveillance actions groups, necessary for all the municipalities
M
ondini RP
Graphic 1 shows the results in a bar chart with increasing values of ICAVES, signaling the location of the first, second and third quartiles (Q1, Q2 and Q3). Health Regions 19 and 20 are below the first quartile in all three parameters, suggesting that these should be prioritized to strengthen Health Surveillance actions.
Discussion
The SUS Planning System (PlanejaSUS) con-siders the State Health Plan, in each sphere, the main management tool, and is the basis for the definition and implementation of health actions
and services14,15. Thus, this study sought to be
compatible with the 2016-2019 State Health Plan
Table 1. Values established for the variable: minimum and maximum value.
Indicators
Minimum
value Maximum value
Lowest performance
Highest performance
Ministry of Health Target
Target agreed CIB/RS
Premature mortality rate (30-69 years) for the set of the four main chronic
noncommunicable diseases (CNCD – diseases of the circulatory system, cancer, diabetes and chronic respiratory diseases)
499,55 270,44 296,51 374,16
Proportion of vaccines of the Basic Immunization Schedule for Children with vaccine coverage achieved
22,15 60,54 75,00 50,00
Proportion of cure for new cases of laboratory-confirmed pulmonary TB
35,86 79,25 85,00 65,00
Proportion of HIV tests performed among TB cases
47,63 89,93 100,00 86,90
Proportion of municipalities with cases of notified work-related diseases or illnesses
11,85 93,33 83,00 70,00
Proportion of cure of new cases of leprosy diagnosed in the years of the cohorts
45,83 100,00 88,00 88,00
Proportion of contacts tested in new cases of leprosy
23,77 100,00 80,00 84,00
Absolute number of deaths by dengue 0,14 0,00 0,00 0,00
Proportion of properties visited in at least four cycles of household visits for dengue control
0,00 59,00 80,00 45,00
Proportion of analyses performed in drinking water samples for total coliform parameters, free chlorine residual and turbidity
29,99 110,47 100,00 80,00
Proportion of municipalities performing at least six Health Surveillance actions groups, necessary for all the municipalities
7,69 62,50 45,00 45,00
Note: Some issues observed throughout the course of the study deserve to be described:
1. The national reference parameter for the agreement of the indicator’s target: premature mortality rate (from 30 to 69 years) for the set of the four main noncommunicable chronic diseases (CNCD - diseases of the circulatory system, cancer, diabetes and chronic respiratory diseases) is the reduction of 2% compared to the previous year. Thus, the World Health Organization’s recommended rate for the Americas for 2019 (280/100,000 inhabitants) was used as the maximum value in Parameter (1), applying a 2% reduction per year to estimate the value for 2016 (296.51/100,000 inhabitants).13
e C
ole
tiv
a,
22(10):3429-3437,
2017
(PES) of Rio Grande do Sul, since its first guide-line (Qualification of the Health Care Network consolidating health regionalization) addresses regionalization and includes the following ob-jective: “To strengthen collective Health
Surveil-lance actions and health risk and disease
man-agement”2.
To strengthen Health Surveillance actions, it is necessary to identify priority areas to ensure equity. Thus, the evaluation of a set of indicators
Health
Macro-Regions Health Region
Parameter (1) Target/
MS
(2) Target/ CIB/RS
(3) Highest Performance
Midwest R 01 - Verdes Campos 0,59 0,72 0,55
R 02 - Entre-Rios 0,60 0,76 0,56
R 03 - Fronteira Oeste 0,61 0,73 0,55
Metropolitan R 04 - Belas Praias 0,53 0,66 0,47
R 05 - Bons Ventos 0,52 0,66 0,48
R 06 - Vale do Paranhana Costa da Serra 0,64 0,76 0,57
R 07 - Vale dos Sinos 0,68 0,86 0,62
R 08 - Vale do Caí Metropolitana 0,56 0,69 0,51
R 09 - Carbonífera/Costa Doce 0,55 0,69 0,52
Missionary R 10 - CapitalVale do Gravataí 0,61 0,70 0,53
R 11 - Sete Povos das Missões 0,53 0,70 0,45
R 12 - Portal das Missões 0,55 0,68 0,52
R 13 - Região da Diversidade 0,60 0,77 0,50
R 14 - Fronteira Noroeste 0,66 0,86 0,66
North R 15 - Caminho das Águas 0,57 0,69 0,51
R 16 - Alto Uruguai Gaúcho 0,50 0,65 0,46
R 17 - Região do Planalto 0,54 0,69 0,41
R 18 - Região das Araucárias 0,51 0,65 0,46
R 19 - Região do Botucaraí 0,44 0,55 0,39
R 20 - Rota da Produção 0,42 0,51 0,36
South R 21 - Região Sul 0,45 0,55 0,41
R 22 - Pampa 0,64 0,79 0,62
Mountainous
region R 23 - Caxias e HortênciasR 24 - Campos de Cima da Serra 0,750,50 0,940,68 0,690,50
R 25 - Vinhedos e Basalto 0,75 0,98 0,70
R 26 - Uva e Vale 0,63 0,83 0,59
Valleys R 27 - Jacuí Centro 0,47 0,58 0,44
R 28 - Vinte e Oito 0,61 0,76 0,57
R 29 - Vales e Montanhas 0,67 0,84 0,64
0,51 0,66 0,47
Figure 1. Map of the Health Macro-Regions and Health Regions of Rio Grande do Sul and Composite Indicator of Health Surveillance values in parameters (1), (2) and (3)
Map of the Health Macro-Regions and Health Regions of Rio Grande do Sul and Composite Indicator of Health Surveillance values in parameters (1), (2) and (3)
Health
Macro-Regions Health Regions (1) ) Highest (3)
st
0,59 0,55
0,60 0,56
0,61 0,55
0,53 0,47
0,52 0,48
a Serra 0,64 0,57
0,68 0,62
0,56 0,51
0,55 0,52
0,61 0,53
0,53 0,45
0,55 0,52
0,60 0,50
0,66 0,66
0,57 0,51
0,50 0,46
0,54 0,41
0,51 0,46
0,44 0,39
0,42 0,36
0,45 0,41
0,64 0,62
0,75 0,69
0,50 0,50
0,75 0,70
0,63 0,59
0,47 0,44
0,61 0,57
0,67 0,64
0,51 0,47
R30 R25 R26
R1 R2
R3
MIDWEST
R4
R5 R6
R7 R8
R9 R10
METROPOLITAN
R21 R22
SOUTH
R29
R28
R27
VALLEYS R11
R13 R14
MISSIONARY R15
R16
R17 R18
R19 R20
R24
R23
MOUNTAINOUS REGION R12
NORTH
M
ondini RP
produces evidence about the health situation and its trends, facilitating the identification of the populations and territories with the greatest health needs, epidemiological risk stratification and identification of critical areas.
The evaluation of Health Surveillance indica-tors in the 2016 Guidelines, Objectives, Targets and Indicators Journal guided this study and proved to be consistent in that it contained in-formation supported by valid and reliable data,
Graphic 1. Composite Health Surveillance Indicator by performance considering parameters (1), (2) and (3).
Abbreviations: Q1 = quartile 1, Q2 = quartile 2, Q3 = quartile 3. 0,00 0,50 1,00 R 20 R 19 R 21 R 27 R 16 R 24 R 30 R 18 R 05 R 04 R 11 R 17 R 12 R 09 R 08 R 15 R 01 R 13 R 02 R 28 R 10 R 03 R 26 R 22 R 06 R 14 R 29 R 07 R 23 R 25 IC A V E S
Região de Saúde Parâmetro (1) - Meta/MS
Q2 -0,57 Q1-0,52 Q3-0,63 0,00 0,50 1,00 R 20 R 19 R 21 R 27 R 16 R 18 R 05 R 04 R 30 R 24 R 12 R 17 R 15 R 08 R 09 R 10 R 11 R 01 R 03 R 28 R 02 R 06 R 13 R 22 R 26 R 29 R 07 R 14 R 23 R 25 IC A V E S
Região de Saúde Parâmetro (2) - Meta/CIB/RS
Q1- 0,66 Q2- 0,70
Q3- 0,77 0,00 0,50 1,00 R 20 R 19 R 21 R 17 R 27 R 11 R 16 R 18 R 04 R 30 R 05 R 24 R 13 R 15 R 08 R 09 R 12 R 10 R 01 R 03 R 02 R 06 R 28 R 26 R 22 R 07 R 29 R 14 R 23 R 25 IC A V E S
Região de Saúde Parâmetro (3) - Maior desempenho
Q1- 0,47 Q2 - 0,51
Q3 - 0,57 Parameter (1) – Target/MS
Health Region
Parameter (2) – Target/CIB/RS
Health Region
Parameter (3) – Highest Performance
e C
ole
tiv
a,
22(10):3429-3437,
2017
as well as indicators of the four environmental, epidemiological, health and worker’s surveillance
sectors (Graphic 2)4.
Health Surveillance proposes to work on the logic of an articulated and integrated set of ac-tions. However, these are still fragmented in divi-sions of environmental, epidemiological, health and Worker’s Surveillance, each of which acts for
its objective of care16. The proposed Composite
Health Surveillance Assessment Indicator allows a dialogue between surveillance sectors,
provid-ing a more integrated view of management16.
Evaluating the performance of Health Sur-veillance in 30 Health Regions through the in-dividual evaluation of the historical series of 11 indicators is a task that involves a large number of values. Thus, the composite indicator is an alternative that seeks to facilitate the evaluation and comparison between the 30 Health Regions. However, it is not intended to replace the indi-vidual evaluation of indicators, but rather to
complement it.6
The best performances in Health Surveillance are those with an ICAVES closer to the ideal (1.0). The State’s ICAVES mean shows different values in the three parameters: (1) Target recommended by the Ministry of Health to agree on the 2016 indicator; (2) Target agreed in the CIB/RS for the
2016 indicator and (3) Mean of the Health Re-gion with the highest indicator’s performance, as can be seen in Graphic 2.
Some targets agreed in the CIB/RS are low-er than recommended by the Ministry of Health and, thus, the Parameter (2) ICAVES has a high-er index value than Paramethigh-er (1). Howevhigh-er, ICAVES of Parameters (1) and (3) are similar, which shows that the evaluation from the target recommended by the Ministry of Health is con-sistent with the actual performance of the Health Regions.
The result indicates that Health Surveillance indicators time series data calculated by techni-cians from the State Health Surveillance Center of Rio Grande do Sul (CEVS/RS) subsidized the agreement of the CIB/RS. Thus, the role of planning in the health sector is noted, including monitoring and evaluation of indicators, which appears as a relevant management mechanism
orienting the decision-making process15-17.
In Parameter (3), the 30 State’s Health Re-gions are compared from their actual perfor-mance, leading us to infer, without there being an individual analysis of the 11 indicators, that there is a large gap between highest and lowest mean of the time series. This result points to inequality in Health Surveillance performance among the 30 Health Regions.
The result of the calculation of the Com-posite Health Surveillance Assessment Indicator (ICAVES), in the three Parameters used, points to the Health Region 20 – Rota da Produção as a priority for the strengthening of Health Sur-veillance actions, followed by Health Region 19 - Botucaraí, both located in the Northern Mac-ro-Region. Bordering the latter, we have the Ser-ra Macro-Region that encompasses the Regions with the best results: Health Region 25 – Vinhe-dos e Basalto, followed by Health Region 23 – Caxias e Hortências (Chart 4).
In the context of the results shown above, ma-trix support can be a strategy of action in search of equity. Health Regions that stand out for their performance in the area of Health Surveillance can share their knowledge, skills, responsibilities and actions with the Health Regions
experienc-ing greater difficulty11,18. And in a
complementa-ry way, the geographical proximity between the Macro-Regions and/or Health Regions can be considered in the construction of the support’s methodology.
This study considers that the ICAVES enables, through an accessible methodology, the synthesis of a set of indicators, facilitating the analysis of
Graphic 2. Health Surveillance Performance in Rio Grande do Sul in parameters (1), (2) and (3).
Health Surveillance Performance/RS
ICA
VES
(1) T arget/MS
(2) T
arget/CIB/RS (3) H ighest
perfor man
ce
0,57
0,72
0,52
Parameters
1,00
0,50
M
ondini RP a large amount of data. It is a robust instrument
with potential to contribute to the construction of public health policies with priorities better tai-lored to the needs of the population.
The cross-sectional Health Surveillance ac-tions in the Health Care Network are integrated with all levels of care, and the focus is to prevent illness by detecting, preventing and controlling determinants and conditionants of health.
The identification of priority areas supports timely actions and induces equity. Therefore, it is important to highlight the relevance of the eval-uation of health indicators in the surveillance of health conditions in a regionalized way, since it allows intervening in moments in which health risks can be avoided or minimized, directly
af-fecting the Health Care Network3,22.
Collaborations
RP Mondini worked on the design, outline and writing of the paper; IA Menegolla in the design, outline and critical review; EV Silva in the design, critical review and final writing.
Acknowledgements
e C
ole
tiv
a,
22(10):3429-3437,
2017
References
1. Estado do Rio Grande do Sul. Secretaria Estadual de Saúde (SES). Resolução nº 555/2012. Comissão Interges-tores Bipartite 2016. Porto Alegre: SES; 2016. 2. Brasil. Decreto nº 7.508, de 28 de junho de 2011.
Re-gulamenta a Lei no 8.080, de 19 de setembro de 1990, para dispor sobre a organização do Sistema Único de Saúde - SUS, o planejamento da saúde, a assistência à saúde e a articulação interfederativa, e dá outras provi-dências. Diário Oficial da União 2006; 28 jun. 3. Estado do Rio Grande do Sul. Grupo de Trabalho de
Planejamento, Monitoramento e Avaliação da Gestão.
Plano Estadual de Saúde: 2016/2019. Porto Alegre: Se-cretaria Estadual de Saúde; 2016.
4. Brasil. Ministério da Saúde (BR). Caderno de Diretrizes, Objetivos, Metas e Indicadores 2016. Brasília: MS; 2016. 5. Estado do Rio Grande do Sul. Secretaria Estadual de
Saúde (SES). Resolução Nº 33/16. Comissão Intergestores Bipartite 2016. Porto Alegre: SES; 2016.
6. Espaço do Gestor, do Prestador e do Profissional de Saúde. Instrumentos de Gestão e Planejamento. Indi-cadores Propostos pelo Ministério da Saúde 2016. Se-cretaria Estadual de Saúde [internet]. 2016 out-nov. [acessado 2016 nov 10]. Disponível em: http://www. saude.rs.gov.br/lista/427/Instrumentos_de_Gest%-C3%A3o_e_Planejamento
7. Pereira BS, Tomasi E. Instrumentos de apoio à gestão regional de saúde para monitoramento de indicadores de saúde. Epidemiol Serv Saude 2016; 25(2):411-418. 8. Junior JB. Epidemiologia em serviço: uma avaliação de
desempenho do Sistema Nacional de Vigilância em Saú-de [tese]. Campinas: Universidade Estadual de Campi-nas; 2004.
9. Lei nº 8.080, de 19 de setembro de 1990. Dispõe sobre as condições para a promoção, proteção e recuperação da saúde, a organização e o funcionamento dos servi-ços correspondentes e dá outras providências. Diário Oficial da União 1990; 19 set.
10. Escorel S. Equidade em Saúde. Diconário da Educação Profissional em Saúde. Fundação Oswaldo Cruz. Esco-la Politécnica de Saúde Joaquim Venâncio[internet]. 2016 out-nov [acessado 2016 nov 05]. Disponível em: http://www.sites.epsjv.fiocruz.br/dicionario/verbetes/ equsau.html.
11. Righi LB. Apoio matricial e institucional em Saúde: en-trevista com Gastão Wagner de Sousa Campos. Comun Saude Educ 2014; 18(1):1145-1150.
12. Gerhardt TE, Silveira DT. Métodos de Pesquisa. Porto Alegre: Editora da UFRGS; 2009.
13. Pan American Health Organization (PAHO). Plan of Action for the Prevention and Control of Noncommuni-cable Diseases in the Americas 2013-2019. Washington: PAHO; 2014.
14. Brasil. Ministério da Saúde (MS). Sistema de Planeja-mento do SUS: uma construção coletiva: InstruPlaneja-mentos básicos. Brasília: MS; 2009.
15. Brasil. Ministério da Saúde (MS). Portaria nº 3.085, de 1º de dezembro de 2006. Regulamenta o Sistema de Planejamento do SUS. Diário Oficial da União 2006; 1º dez.
16. Brasil. Ministério da Saúde (MS). Sistema de Planeja-mento do SUS: uma construção coletiva: orientações ge-rias para eleaboração de instrumentos de planejamento: Programação Anual de saúde e Relatório Anual de Ges-tão. Brasília: MS; 2009.
17. Brasil. Ministério da Saúde (MS). Sistema de Planeja-mento do SUS: uma construção coletiva: monitoraPlaneja-mento e avaliação: processo de formulação, conteúdo e uso dos instrumentos do PlanejaSUS. Brasília: MS; 2009. 18. Campos GWS, Domitti AC. Apoio matricial e equipe
de referência: uma metodologia para gestão do traba-lho interdisciplinar em saúde. Cad Saude Publica 2007; 23(2):399-407.
19. Mendes EV. As redes de atenção à saúde. Brasília: Orga-nização Pan-Americana da Saúde; 2011.
Article submitted 30/05/2017 Approved 26/06/2017