CLINICAL SCIENCE
aGeriatric Service, Hospital das Clínicas, Faculdade de Medicina da
Uni-versidade de São Paulo - São Paulo/SP, Brazil.
bDepartment of Preventive Medicine, Faculdade de Medicina da
Universi-dade de São Paulo - São Paulo/SP, Brazil. [email protected]
Received for publication on 27/09/07 Accepted for publication on 23/11/07
DEVELOPMENT OF ELDERLY QUALITY OF
LIFE INDEX – EQOLI: ITEM REDUCTION AND
DISTRIBUTION INTO DIMENSIONS
Sérgio Márcio Pacheco Paschoala, Wilson Jacob Filhoa, Júlio Litvocb
Paschoal SMP, Jacob Filho W, Litvoc J. Development of Elderly Quality of Life Index – EQoLI: item reduction and distribution into dimensions. Clinics. 2008;63:179-88.
OBJECTIVE:To describe item reduction and its distribution into dimensions in the construction process of a quality of life evalu-ation instrument for the elderly.
METHODS:The sampling method was chosen by convenience through quotas, with selection of elderly subjects from four programs to achieve heterogeneity in the “health status”, “functional capacity”, “gender”, and “age” variables. The Clinical Impact Method was used, consisting of the spontaneous and elicited selection by the respondents of relevant items to the construct Quality of Life in Old Age from a previously elaborated item pool. The respondents rated each item’s importance using a 5-point Likert scale. The product of the proportion of elderly selecting the item as relevant (frequency) and the mean importance score they attributed to it (importance) represented the overall impact of that item in their quality of life (impact). The items were ordered according to their impact scores and the top 46 scoring items were grouped in dimensions by three experts. A review of the negative items was performed.
RESULTS: One hundred and ninety three people (122 women and 71 men) were interviewed. Experts distributed the 46 items into eight dimensions. Closely related items were grouped and dimensions not reaching the minimum expected number of items received additional items resulting in eight dimensions and 43 items.
DISCUSSION:The sample was heterogeneous and similar to what was expected. The dimensions and items demonstrated the multidimensionality of the construct. The Clinical Impact Method was appropriate to construct the instrument, which was named Elderly Quality of Life Index - EQoLI. An accuracy process will be examined in the future.
KEYWORDS: Elderly. Quality of life. Questionnaires. Evaluation. Health impacts.
INTRODUCTION
Evaluation instruments should cover all relevant aspects of the construct and explore, in detail, all issues of interest. Compromises, however, have to be made, first, “between the need for a relatively short questionnaire versus the need for retaining enough items to ensure a comprehensive coverage of Quality of Life (content validity)” and, second, between
“the preservation of a broad vision versus a more detailed evaluation of specific issues”.1
Regardless of the method, redundant or inappropri-ate items are elimininappropri-ated, decreasing the item number to a manageable level and ensuring that the scale measures the construct or the clinical phenomenon of interest.
In the final instrument, the items will be grouped into dimensions. The aim is to reach a balance between items and dimensions, for both are essential to the construction of an effective instrument. This instrument should also be as short as possible to ensure its applicability.
This article describes the “item reduction” and “item distribution into dimensions” stages of the construction of a quality of life in old age evaluation instrument, based on information given by the elderly using the Clinical Impact Method.3-6 The theoretical-conceptual framework, the chosen
methodology and the process of relevant item generation are described elsewhere.7
METHODS
1. Sample
Two hundred interviews with elderly subjects (60 years old and over) were programmed according to convenience sampling. The heterogeneity criterion was met, assuming as parameters the “functional capacity” and “health-status” variables. Functional capacity was measured with the Brazil-ian Version of the Older Americans Resources and Services Multidimensional Functional Assessment Questionnaire – BOMFAQ, validated for the Portuguese language.8
Sub-jects that were able to perform basic and instrumental daily activities were considered independent. Those that needed help in instrumental activities, and who were not able to leave home alone were considered dependent, even if they were independent in self-care (basic) activities. Health status was measured by self-evaluation: those who answered the question “rate your present health condition” as “very bad”, “bad” or “impaired” were considered “sick” and those who answered the same question as “good” or “excellent” were considered “healthy”.
To have a sample with the designed diversity character-istics, four elderly programs that were expected to yield the desired heterogeneous composition in relation to the two above mentioned variables were selected. Therefore, 50 in-terviews were planned for each of the following groups:
Hospital das Clínicas da Faculdade de Medicina da Uni-versidade de São Paulo (HC):
The self-evaluation of most of this group of subjects was expected to yield “sick” with low functional capacity;
It was expected that the majority, or even all subjects,
would present good functional capacity and evaluate themselves as “healthy”, because they needed to be able to get around to participate in activities.
School of the Universidade de São Paulo (EHMPRO): This group was expected to present a great proportion of “sick” people with impaired functional capacity, because these elderly were either bed-ridden or had difficulty in getting out of their homes.
(SCUSP):
Elderly practicing regular physical activity should evalu-ate themselves as “healthy” and present preserved func-tional capacity.
Based on the criteria above our sampling can be defined as “by convenience” and “by quota”.
In defining the quotas, two other criteria, important for the final sample configuration, were included: “gender” and “age”, each in proportion to the overall elderly population. For each quota, gender and age targets were defined, based
men - 41.0%, women – 59.0%; 60 to 74 years old – 75.0%, 75 years old and over – 25.0%. In the programmed 200 interviews, these percentages resulted in an estimate of 120 women and 80 men, 148 aged 60 years to 74 years and 52 aged 75 years and over, equally distributed into the four quotas (30 women and 20 men in each quota) (Table 1). In each quota, subjects were randomly recruited and then invited. The study was approved by the Institutional Ethics Committee. Each participant was thoroughly informed; those who agreed to participate gave their written consent. After agreement, an interview was scheduled.
Elderly persons with moderate to severe dementia, with expression or comprehension aphasia or with any other dis-ease that prevented interaction or communication, such as significant hipoacusia, were excluded.
were conducted by one of the authors. In EHMPRO, due to difficulties in interviewing the subjects in their own resi-dences, a previously trained interviewer conducted part of the interviews. Regarding the EHMPRO group, privacy in their residence was not always possible to attain, because the presence of a relative or the caregiver was often required, due to the elderly person’s dependency condition.
2. Item reduction
Initially, relevant items to the Quality of Life in Old Age construct were identified. The respondents were asked to name which factors improved their quality of life and which worsened it (good and bad quality of life determinants, respectively), keeping in mind their life stage, i.e., old age (spontaneous responses). When these “spontaneous” factors were exhausted, they were shown the previously generated item pool6,7 and asked which made their quality of life better
or worse (elicited stage). To establish the importance of each item, the investigator asked the respondent to rate the items they considered determinant of “good” quality of life in old age and then those considered determinant of “bad” quality of life in old age. For each item, the following question was asked: “How much does item x improve the quality of life of the elderly?” (for items previously evaluated as determinant of a good quality of life during old age) and “How much does item y worsen the quality of life of the elderly?” (for items previously evaluated as determinant of a bad quality of life during old age). A 5-point Likert scale was used (1 = almost nothing; 2 = a little; 3 = moderately; 4 = a lot and 5 = extremely), with the modifications suggested by our pilot study7, both for the items previously considered by the
elderly as good (how much does it improve?) as well as bad (how much does it worsen?); the respondents did not have any problems to understanding this scale.
To carry out reduction, frequency and mean importance were calculated for each item. “Frequency” was given by the proportion of elderly selecting the item as relevant and “importance” was measured by the mean importance score they attributed to it. The frequency-importance product rep-resents the overall impact of that item in the subjects’ quality of life (impact).
The items were ranked in decreasing order according to their impact score and the final instrument consisted of the top 46 scoring items, corresponding to 1/3 of the initial item pool. Thus, a first reduction was performed to ensure instru-ment practicality and applicability. A new reduction could be performed in the dimension identification stage.
3. Dimension identification
Dimensions were identified by experts knowledgeable in quality of life questionnaire construction and application or in geriatrics.
The top 46 scoring items were grouped into dimensions by three experts in two rounds in order to reach an agree-ment by at least two of them. It was recommended that each dimension should have at least four representative items to ensure construct dimensionality. Following these criteria, a dimension that did not reach the minimum required item number could include the next highest scoring items from the pool compatible with that dimension. Items that were highly correlated should be combined into a single item.
The investigator established the degree of agreement between the experts and the final arrangement of the instru-ment dimensions.
RESULTS
For this study, 193 interviews were conducted from July 30th, 2002 to October 9th, 2003. The interviews took an average of 75 minutes (sd=19). The mean age was 72 years (sd=7), varying from 60 to 97 years old, with EHMPRO hav-ing the highest mean age (76 years, sd=7).
1. Sample description
The numbers of respondents in three of the quotas
being close to the 50 planned interviews. A smaller number was administered in EHMPRO, with 42 interviews, which represented 84% of the planned interviews (Table 2).
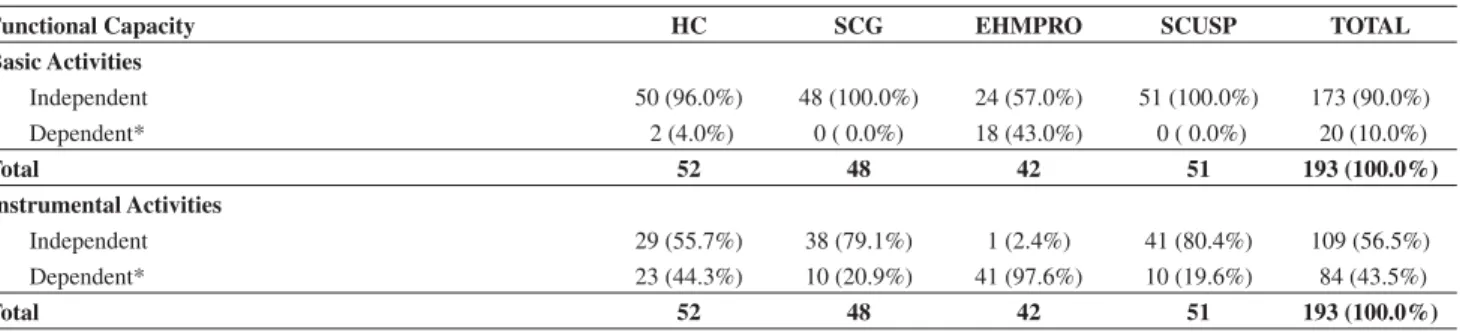
Considering the total sample, 56.5% of the subjects were independent as far as instrumental activities were concerned. This proportion varied from 2.4% in EHMPRO to 80.4% in SCUSP. The HC group presented an intermediate value of
Table 1 - Sample design
Parameters Quota 1 Quota 2 Quota 3 Quota 4 TOTAL
Health self-evaluation Sick Healthy Sick Healthy
Physical Functional Capacity Dependent Independent Dependent Independent
Number of interviews according to age and gender
60 to 74 years old 150 (75%)
Women 22 (59%) 22 (59%) 22 (59%) 22 (59%) 88 (59%)
Men 15 (41%) 15 (41%) 15 (41%) 15 (41%) 60 (41%)
75 years and over 50 (25%)
Women 8 (62%) 8 (62%) 8 (62%) 8 (62%) 32 (62%)
Men 5 (38%) 5 (38%) 5 (38%) 5 (38%) 20 (38%)
Table 2 - Number and percentage of elderly distributed in the sample quotas according to age and gender - São Paulo – 2003
Number of interviews according to age and gender HC EHMPRO SCUSP N (%)
60 to 74 years old 126 (65)
Women 22 (59%) 22 (59%) 12 (75%) 22 (59%) 78 (62)
Men 15 (41%) 14 (41%) 4 (25%) 15 (41%) 48 (38)
75 years old and over 67 (35)
Women 9 (60%) 8 (67%) 18 (69%) 9 (64%) 44 (66)
Men 6 (40%) 4 (33%) 8 (31%) 5 (36%) 23 (34)
Total 52 48 42 51 193(100)
Table 3 - Number and percentage of elderly distributed in the sample quotas according to functional capacity - São Paulo – 2003
Functional Capacity HC SCG EHMPRO SCUSP TOTAL
Basic Activities
Independent 50 (96.0%) 48 (100.0%) 24 (57.0%) 51 (100.0%) 173 (90.0%)
Dependent* 2 (4.0%) 0 ( 0.0%) 18 (43.0%) 0 ( 0.0%) 20 (10.0%)
Total 52 48 42 51 193 (100.0%)
Instrumental Activities
Independent 29 (55.7%) 38 (79.1%) 1 (2.4%) 41 (80.4%) 109 (56.5%)
Dependent* 23 (44.3%) 10 (20.9%) 41 (97.6%) 10 (19.6%) 84 (43.5%)
Total 52 48 42 51 193 (100.0%)
* partially or totally dependent
Table 4 - Number and percentage of elderly distributed in the sample quotas according to health status - São Paulo – 2003.
Health-status HC SCG EHMPRO SCUSP TOTAL
Healthy 0 ( 0%) 47 ( 98%) 5 (12%) 51 (100%) 103 (53%)
Sick 52 (100%) 1 ( 2%) 37 (88%) 0 ( 0%) 90 (47%)
Total 52 48 42 51 193 (100%)
of 79.1%, close to the SCUSP value. For basic activities, 89.6% of the total sample were independent: 100% from the
the HC group were in good condition, while the EHMPRO group had the worst average condition, with 57.1% of the elderly persons being independent (Table 3).
With regard to health status, the evaluation turned out as expected with all of the SCUSP group and 98.0% of the
extreme, only 12.0% of the EHMPRO group and none of the HC group classified themselves as healthy (Table 4).
Concerning demographic variables, the sample had 122 women, two more than the designed total and 71 men, 88.0% of the planned total. 126 interviewed subjects were aged 60 to 74 years, 85.1% of the planned 148 subjects and 67 respondents were aged 75 years and over, 29.0% more than the planned 52 subjects (Table 2).
2. Item reduction
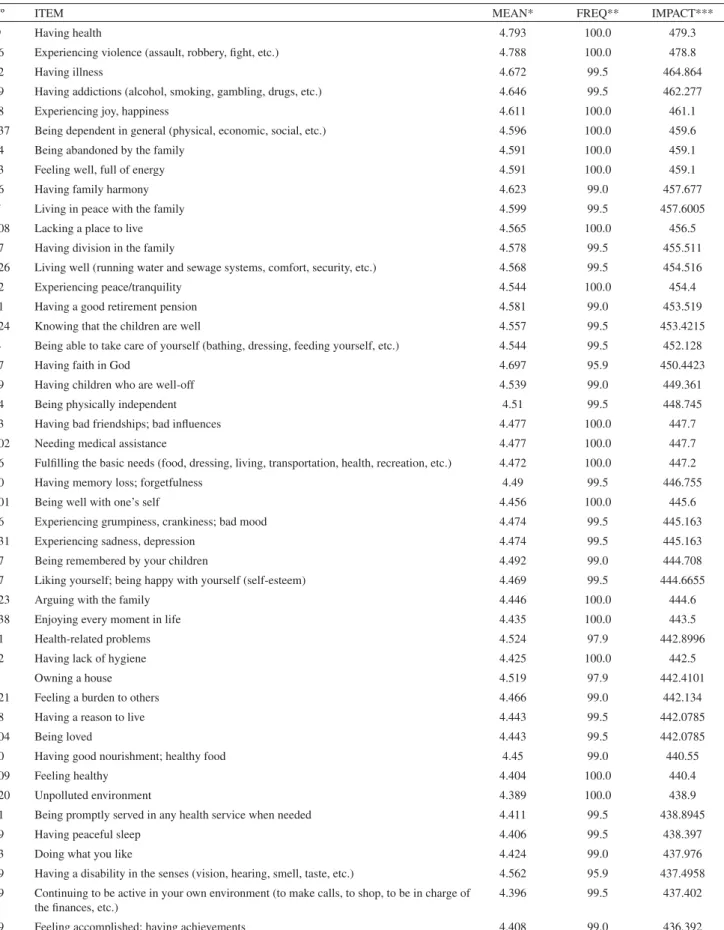
The product of the proportion of elderly subjects that identified an item as relevant to quality of life (frequency) by the mean importance attributed to that item (importance) resulted in a numeric score, representing the item’s impact on their quality of life.
The 46 highest scoring items, one-third of the initial total7, are represented in Table 5.
3. Item distribution into dimensions
Table 5 - Top 46 impact scoring item ranking, in decreasing order – São Paulo – 2003
Nº ITEM MEAN* FREQ** IMPACT***
9 Having health 4.793 100.0 479.3
86 Experiencing violence (assault, robbery, fight, etc.) 4.788 100.0 478.8
82 Having illness 4.672 99.5 464.864
69 Having addictions (alcohol, smoking, gambling, drugs, etc.) 4.646 99.5 462.277
68 Experiencing joy, happiness 4.611 100.0 461.1
137 Being dependent in general (physical, economic, social, etc.) 4.596 100.0 459.6
24 Being abandoned by the family 4.591 100.0 459.1
33 Feeling well, full of energy 4.591 100.0 459.1
96 Having family harmony 4.623 99.0 457.677
7 Living in peace with the family 4.599 99.5 457.6005
108 Lacking a place to live 4.565 100.0 456.5
57 Having division in the family 4.578 99.5 455.511
126 Living well (running water and sewage systems, comfort, security, etc.) 4.568 99.5 454.516
22 Experiencing peace/tranquility 4.544 100.0 454.4
31 Having a good retirement pension 4.581 99.0 453.519
124 Knowing that the children are well 4.557 99.5 453.4215
4 Being able to take care of yourself (bathing, dressing, feeding yourself, etc.) 4.544 99.5 452.128
67 4.697 95.9 450.4423
29 Having children who are well-off 4.539 99.0 449.361
34 Being physically independent 4.51 99.5 448.745
93 Having bad friendships; bad influences 4.477 100.0 447.7
102 Needing medical assistance 4.477 100.0 447.7
76 Fulfilling the basic needs (food, dressing, living, transportation, health, recreation, etc.) 4.472 100.0 447.2
90 Having memory loss; forgetfulness 4.49 99.5 446.755
101 Being well with one’s self 4.456 100.0 445.6
56 Experiencing grumpiness, crankiness; bad mood 4.474 99.5 445.163
131 Experiencing sadness, depression 4.474 99.5 445.163
87 Being remembered by your children 4.492 99.0 444.708
17 Liking yourself; being happy with yourself (self-esteem) 4.469 99.5 444.6655
123 Arguing with the family 4.446 100.0 444.6
138 Enjoying every moment in life 4.435 100.0 443.5
41 Health-related problems 4.524 97.9 442.8996
32 Having lack of hygiene 4.425 100.0 442.5
6 Owning a house 4.519 97.9 442.4101
121 Feeling a burden to others 4.466 99.0 442.134
18 Having a reason to live 4.443 99.5 442.0785
104 Being loved 4.443 99.5 442.0785
20 Having good nourishment; healthy food 4.45 99.0 440.55
109 Feeling healthy 4.404 100.0 440.4
120 Unpolluted environment 4.389 100.0 438.9
81 Being promptly served in any health service when needed 4.411 99.5 438.8945
39 Having peaceful sleep 4.406 99.5 438.397
63 Doing what you like 4.424 99.0 437.976
49 Having a disability in the senses (vision, hearing, smell, taste, etc.) 4.562 95.9 437.4958 59 Continuing to be active in your own environment (to make calls, to shop, to be in charge of
the finances, etc.)
4.396 99.5 437.402
79 Feeling accomplished; having achievements 4.408 99.0 436.392
The distribution of 24 items (52.2%) that reached agree-ment between two experts (66.7% of agreeagree-ment) and the dimensions of the conceptualization stage was also accepted. Agreement on item distribution lead to specific names for dimensions, such as Psychological and Well-Being Emo-tional Determinants. One of the experts created combined dimensions (Socioeconomic, Health/Functional Capacity, Psychological/Transcendence etc), such that item distribu-tion could be considered to be in concordance when any other expert put a given item into one of the two areas of this expert’s chosen dimension.
Six items (13.0%) did not reach a concordant distribution among the experts or between them and the construct concep-tualization stage, requiring a second round. The experts were asked to again analyse these six items with the first round choices of each expert and their distribution into dimensions carried out by the authors in the conceptualization stage. Each expert could remain with the same choice or make a new one after considering the other opinions. As the new answers were regrouped, concordance was reached for three items and 66.7% agreement was reached for two others. The distribution of these five items was also in agreement with the authors’ distribution in the construct conceptualization stage. There was no agreement for the “Having a reason to live” item distri-bution with the previous distridistri-bution and the experts also had divided opinions. Our choice was to put it in the Religiosity/ Transcendence dimension, as previously proposed in the item generation and dimensionality construction stages7. Following
the suggestion of one expert, the Religiosity/Transcendence dimension was renamed to Spirituality/Transcendence. The final instrument had eight dimensions.
The next step was to combine highly correlated items. Three pairs were found in the PHYSICAL HEALTH di-mension: “Having health”/“Feeling healthy”, “Having illness”/“Health-related problems” and “Needing medical assistance”/“Being promptly served in any health service when needed”. “Having health” was chosen because it was the best scoring item, being extremely valued by the elderly and it is a more extensive concept than “Feeling healthy”. “Having illness” was chosen from the second pair, because its meaning was easily understood by the elderly, who feared it very much. “Being promptly served in any health service when needed” was the item selected from the third pair, be-cause it was an objective translation of medical assistance. One pair was identified in the FUNCIONAL CAPACITY di-mension, “Being able to take care of yourself (bathing, dress-ing, feeding yourself, etc.)”/“Being physically independent”. “Being able to take care of yourself” was our choice as it is a more direct and objective approach and is easily understood
-other pair was found: “Being well with one’s self”/“Liking
yourself; being happy with yourself (self-esteem)”, and our option was for the second item, because it is a less abstract concept. In the FAMILY dimension, three pairs were identi-fied: “Having family harmony”/“Living in peace with the family”, “Having division in the family”/“Arguing with the family” and “Knowing that the children are well”/“Having children who are well-off”. “Living in peace with the family” was chosen from the first pair, because it is a more objective way of expressing this concept, since harmony is a difficult term for many poorly educated elderly to understand. The selected item from the second pair was “Having division in the family” and the selected item from the third pair was “Having children who are well-off”, because both are easy to understand expressions. Therefore, eight pairs were com-bined, resulting in a 38 item pool.
Some dimensions did not have the required minimum item number, namely FUNCTIONAL CAPACITY (3), SO-CIAL (1), HABITS/LIFE STYLE (3) and ENVIRONMENT (3). Following the recommendation of having at least four items per dimension, the next best scoring items compatible with the dimension were added. Thus, “Relying on others for daily activities”, which ranked 51st was included in the
FUNCTIONAL CAPACITY dimension, “Practicing physical activity (sports, walking, jogging etc)”, ranked 87th, was
in-cluded in the HABITS/LIFE STYLE dimension and “Having public safety”, ranked 62nd, was included in the
ENVIRON-MENT dimension. As for the SOCIAL dimension, it was decided to assign its items to the FAMILY dimension and rename the combined dimension SOCIAL/FAMILY. The resulting item pool had 41 items.
Based on their knowledge in dealing with the elderly, the authors decided to add to the total list two more items: “Having control over your own life” and “Living without significant pain”. “Having control over your own life”, ranked 70th, was included due to the importance autonomy
has in determining good quality of life in old age and was added to the FUNCTIONAL CAPACITY dimension, which was renamed FUNCTIONAL CAPACITY/AUTONOMY. “Living without significant pain”, ranked 63rd, was included
because pain is a common experience among the elderly, transforming many lives, triggering depression, inactiv-ity and immobilinactiv-ity and was thus added to the PHYSICAL HEALTH dimension.
With these modifications, the number of items rose to 43: 15 negative and 28 positive items, distributed into eight dimensions (Table 6).
4. Negative item review
as “Having bad memory, forgetfulness” and “Having a dis-ability in the senses (vision, hearing, smell, taste etc)” was reworded as “Having vision, hearing, smelling and tasting impairments” . “Lacking a place to live” was substituted by “Having no place to live” and “Having lack of hygiene” was changed to “Having bad hygiene”. The 11 remaining items did not require any alteration.
DISCUSSION
1. Sample characterization
For this study, 193 elderly people were interviewed, which was 96.5% of the expected number. Recruitment of at least 100 subjects is recommended for the item reduction stage.14
The health self-evaluation and functional capacity measurements confirmed the planned quota
heterogene-
were all totally independent in their basic activities and had a higher proportion of healthy and totally instrumental activity-independent subjects. The HC group members were classified as intermediate, since 96.2% were independent in their basic activities, only 55.7% were instrumental activity-independent and none were self-evaluated as healthy. The EHMPRO group had very low scores in all three indicators (57.1%, 2.4% and 12.0%).
-MPRO groups were not filled as planned, due to the fact
program had less men enrolled and this fact was due not only to the greater longevity of women, but also to the fact that its activities are less appealing to men. Our proportions of actual respondents relative to the expected numbers in terms of gender, 102% (122 women of the planned 120) and 89% (71 men of the panned 80) must be compared to the 85% value, suggested by Kish13. It is important to point out that
the sampling processes differed, with Kish’s based on popu-lation and ours on quota convenience. Nevertheless, using the same percentage (85%) to evaluate the appropriateness of our sample means to aggregate an objective criterion to our subjective evaluation that the small differences between what was planned and what was actually accomplished, did not tarnish the sample.
In the EHMPRO quota, the lower male percentage (60% of the expected) was below the suggested 85%. This lower percentage is the result of two main difficulties in the field: the number of women enrolled in this program was much higher than that for men and the men in the program were independent in a higher proportion, disqualifying them from the study.
Table 6 - Distribution into dimensions of the 43 item pool, following modifications
PHYSICAL HEALTH DIMENSION Having health
Having illness
Having bad memory, forgetfulness
Being promptly served in any health service when needed Having peaceful sleep
Having vision, hearing, smelling and tasting impairments Living without significant pain
FUNCTIONAL CAPACITY/AUTONOMY DIMENSION Being dependent in general (physical, economic,social, etc.)
Being able to take care of yourself (bathing, dressing, feeding yourself, etc.)
Continuing to be active in your own environment (to make calls, to shop, to be in charge of the finances, etc)
Relying on others for daily activities Having control over your own life PSYCHOLOGICAL DIMENSION
Experiencing joy, happiness Feeling well, full of energy
Experiencing grumpiness, crankiness; bad mood Experiencing sadness, depression
Liking yourself; being happy with yourself (self-esteem) Enjoying every moment in life
Feeling a burden to others Being loved
Doing what you like
SOCIAL/FAMILY DIMENSION Being abandoned by the family Living in peace with the family Having division in the family Having children who are well-off Having bad friendships; bad influences Being remembered by your children ECONOMIC DIMENSION
Having no place to live
Having a good retirement pension
Fulfilling the basic needs (food, dressing, living, transportation, health, recreation, etc)
Owning a house
HABITS/LIFE STYLE DIMENSION
Having addictions (alcohol, smoking, gambling, drugs, etc) Having bad hygiene
Having good nourishment; healthy food
Practicing physical activity (sports, walking, jogging etc.) SPIRITUALITY/TRANSCENDENCE DIMENSION
Experiencing peace/tranquility
Having a reason to live
Feeling accomplished; having achievements ENVIRONMENT DIMENSION
Experiencing violence (assault, robbery, fight, etc)
Living well (running water and sewage systems, comfort, security, etc) Unpolluted environment
Regarding the age variable, the EHMPRO quota was the farthest away from what was planned. Sixteen elderly persons aged 60 to 74 years old were interviewed, whereas 37 was the designed number, the opposite occurred with elderly persons aged 75 years and over, where 26 were interviewed against the 13 planned. This result reflects this group’s characteristics, because older elderly persons tend to be more dependent. In addition studies show that functional limitation is more frequent in women and in older subjects.15
In conclusion, when the tendencies of the “health status” and “functional capacity” variables and the more quantifiable “gender” and “age” variables were analyzed, our sample composition was adequately close to our design, consisting of a heterogeneous sample of elderly subjects.
2. Item reduction
A first reduction down to one-third of the items was made. The items chosen most frequently and rated as most important by the elderly were retained. Data analysis con-firmed the HEALTH dimension’s importance to Quality of Life in Old Age as has, already been reported in other studies.16,17
Usually, a reasonable number of items is required “to cover most, if not the totality of the construct semantic extension, explicit in the constitutive definitions”.18 What
is a reasonable number of items? “Common sense teaches us that for a construct to be well represented, it is necessary around 20 items”.18 Surely, very simple constructs need only
few items. As an example, Pasquali18 cites satisfaction with
salary. Question: “How many ways are there to verify such satisfaction? It seems exaggerated to ask someone 20 times if he/she is satisfied with his/her salary”. However, there are many dimensions and aspects to be analyzed in Quality of Life in Old Age. In item generation6,7 during the first stages
of the construction process, many elderly persons were con-sulted, in order to understand the meaning of quality of life in old age and what the determining factors of good and bad quality of life in this life stage might be. For this, 139 items covering various dimensions of the construct were selected; however, the instrument must be practical and applicable to various situations. The reduction to one-third of the initial items helps to reach such a goal. This was also the traditional psychometric approach: “if the final item number, i.e., after the instrument underwent all the construction and validation stages, should be around 20, how many items should one begin with, to end up with these 20? The answer given in the traditional positivist psychometric context is that one should begin with three times the number one wants to end up with”.18
3. Item distribution into dimensions
Three experts distributed the 46 best impact scoring items into eight dimensions. Two rounds were necessary to reach an agreement or to have at least the concordance of two of the three experts. Furthermore, the investigator checked for concordance with the dimensions initially produced during the item generation stage. The instrument multidimensional-ity was characterized corresponding to the construct multi-dimensionality.
4. Negative item review
The importance of negative items in a quality of life scale must be stressed,19 but the items must be understood
by everyone that uses the questionnaire, including a target population of less privileged subjects, as the clearness crite-rion of the item construction rules is fundamental.18 “Short
statements with unequivocal and simple expressions” are recommended, since “long negative statements often lack clearness”. Negative statements are usually more confusing than positive ones. “Thus, it is better to affirm negativity than to negate an affirmation. For example: it is clearer to say I hate to be interrupted than I don’t like to be interrupted or it is better to say I feel unhappy than I don’t feel happy”.18
Streiner and Norman20 said the same thing about positive
and negative writing: as a general rule, investigators that develop scales should avoid items written in the negative form, i.e., items that use words such as no, rarely or never, or that have words with negative prefixes (e.g. im-, un-, a-). Such items tend to have lower validity coefficients than those written in the positive form. It is better to state that “I feel sick most of the time” than “I rarely feel good”.
5. Final considerations
This stage of the construction process of an evaluation instrument of quality of life in old age resulted in an in-strument with eight dimensions and 43 items. The Clinical Impact Method proved to be appropriate for the construction process.
The process was based on information given by the elderly themselves, making it possible to know their percep-tion of the value of relevant issues concerning their lives and the aging process. It was possible to identify the items most relevant to Quality of Life in Old Age by generating an impact ranking item pool from which items were drawn for evaluation by the experts.
of the negative items were reworded to meet the clearness criterion of the construction rules. The Idealized Quality of Life and Accomplished Quality of Life parts of the question-naire should have a differentiated writing.
Idealized Quality of Life is the elderly opinion, at that moment, about the importance of various items and dimen-sions to a good or bad quality of life in old age and Ac-complished Quality of Life is the actual situation of elderly persons with regard to these same items and dimensions, verifying immediately if he/she performs, has or feels what he/she deemed important or if he/she/ does not perform, have or feel what he/she judged to be less or not important. In contrast to past situations, when the subjects’ needs and perceptions of what constituted an acceptable quality of life were ignored, Fry14 emphasizes that people’s perspectives
must be profoundly understood. An easy to handle numeric index that summarizes quality of life by measuring the
dis-tance between the idealized and the actual situation should be established.
The instrument should be as short as possible to be prac-tical and acceptable. Its format should allow for self-admin-istration as well as interviewer-adminself-admin-istration, since there are many illiterate or poorly educated elderly persons within our population, with abstraction and reading comprehension difficulties, in addition to visual and motor impairments.
A next stage will include instrument accuracy study, with data report and analysis.
The instrument was named Elderly Quality of Life Index – EQOLI.
ACKNOWLEDGMENTS
FMUSP) for his collaboration.
REFERENCES
1. Fayers PM, Machin D. Questionnaire development and scoring. In: Fayers PM, Machin D. Quality of Life. Assessment, Analysis and Interpretation. Chichester: John Wiley & Sons. LTD; 2000. p.135-53.
new Health-Related Quality of Life instrument. In: Spilker B, editor. Quality of Life and Pharmacoeconomics in Clinical Trials. Philadelphia: Lippincott-Raven Publishers; 1996. p.49-56.
quality of life in clinical trials. CMAJ. 1986;134:889-95.
Life in patients with chronic airflow limitation. Br J Dis Chest. 1987;81:45-54.
indices. J Chronic Dis. 1985;38:27-36.
6. Paschoal SMP. Qualidade de Vida do Idoso: Elaboração de um instrumento que privilegia sua opinião [dissertação]. São Paulo: Faculdade de Medicina, Universidade de São Paulo; 2000.
7. Paschoal SMP, Jacob Filho W, Litvoc J. Development of Elderly Quality of Life Index – EQoLI: Theoretical-conceptual framework, chosen methodology and relevant items generation. Clinics. 2007;62:279-88.
and family support of the elderly of different socioeconomic strata living in the community [thesis]. London: University of London; 1987.
R, Tompkins C. A new measure of health status for clinical trials in
Patterson CJ, Turpie I. Measuring quality of life in the frail elderly. J Clin Epidemiol. 1993;46:1433-44.
Factor Analysis for Quality of Life Questionnaire Construction. J Clin Epidemiol. 1997;50:233-8.
psychometric strategies for development of a health measurement scale. J Clin Epidemiol. 1999;52:105-11.
13. Kish L. Survey Sampling. New York; John Wiley & Sons; 1965. 14. Fry PS. Whose quality of life is it anyway? Why not ask seniors to tell
15. Barbosa AR, Souza JMP, Lebrão ML, Laurenti R, Marucci MFN. Diferenças em limitações funcionais de idosos brasileiros de acordo com idade e sexo: dados da pesquisa SABE. Cad Saúde Pública 2005;21:1177-85.
16. Fleck MPA, Chachamovich E, Trentini CM. Projeto WHOQOL-OLD: método e resultados de grupos focais no Brasil. Rev Saúde Publ. 2003;37:793-9.
Elderly people’s definition of quality of life. Rev Bras Psiquiatr. 2003;25:31-9.
18. Pasquali L. Princípios de elaboração de escalas psicológicas. Rev Psiq Clín. 1998;25. Edição Especial:206-13.
19. Ranzijn R, Luszcz M. Measurement of subjective quality of life of elders. Int J Aging Hum Dev. 2000;50:263-78.