Anesthesia and Surgical ICU Heart Institute Hospital das Clínicas -University of São Paulo- SP/Brazil.
Respiratory & Critical Care Medicine; Clinique-University Paris XI – REDLine Institute.
Email: [email protected]
Received for publication on June 14, 2006. Accepted for publication on July 02, 2006.
REVIEW
VOLUME MANAGEMENT IN CRITICALLY ILL
PATIENTS: NEW INSIGHTS
Marcel Rezende Lopes, José Otávio Costa Auler Jr, Frédéric Michard
Lopes MR, Auler JOC, Michard F. Volume management in critically ill patients: new insights. Clinics. 2006;61(4):345-50.
In order to turn a fluid challenge into a significant increase in stroke volume and cardiac output, 2 conditions must be met: 1) fluid infusion has to significantly increase cardiac preload and 2) the increase in cardiac preload has to induce a significant increase in stroke volume. In other words, a patient can be nonresponder to a fluid challenge because preload does not increase during fluid infusion or/and because the heart (more precisely, at least 1 of the ventricles) is operating on the flat portion of the Frank-Starling curve. Volumetric markers of cardiac preload are therefore useful for checking whether cardiac preload effectively increases during fluid infusion. If this is not the case, giving more fluid, using a venoconstricting agent (to avoid venous pooling), or reducing the intrathoracic pressure (to facilitate the increase in intrathoracic blood volume) may be useful for achieving increased cardiac preload. Arterial pulse pressure variation is useful for determining whether stroke volume can/will increase when preload does increase. If this is not the case, only an inotropic drug can improve cardiac output. Therefore, the best option for determining the usefulness of, and monitoring fluid therapy in critically ill patients is the combination of information provided by the static indicators of cardiac preload and arterial pulse pressure variation.
KEYWORDS : Delta PP. Systolic pressure variation.
The decision-making process concerning volume ex-pansion is frequently based on the clinical examination and the assessment of cardiac preload indicators, mainly cardiac filling pressures.1 There is no doubt that in some
cases (eg, hemorrhage or severe diarrhea) we can rea-sonably rely on clinical examination to identify patients who will benefit from fluid loading. However, in more complex—but not uncommon—situations (eg, septic shock) both clinical examination and indicators of car-diac preload have been shown to be of minimal value in answering the question: “can we improve cardiac
out-put and hence hemodynamics by giving fluid?”2
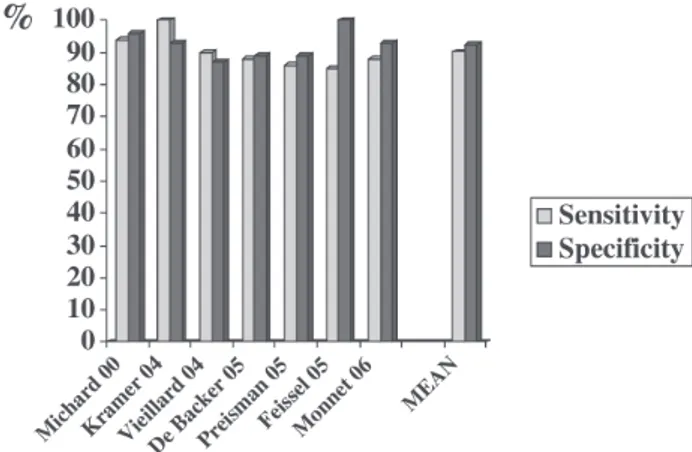
Over the past 6 years, many clinical studies have dem-onstrated the value of arterial pulse pressure variation (∆PP)
to predict fluid responsiveness (ie, an increase in cardiac out-put as a result of fluid infusion) in sedated patients whose lungs are being mechanically ventilated3-10 (Figure 1).
346
CLINICS 2006;61(4):345-50 Volume management in critically ill patients
Lopes MR et al.
The reliability and availability of ∆PP—now automati-cally calculated and displayed on bedside monitors—and the minimal value of classical markers of preload in pre-dicting fluid responsiveness necessarily raise the follow-ing question: “Should we continue to assess cardiac preload to determine fluid therapy?”
Therefore, we will first review the reasons why cardiac preload indicators are poor predictors of fluid responsive-ness, and secondly we will describe the circumstances in which they may still be useful for the clinician.
Static indicators of cardiac preload and fluid responsiveness
The little value of cardiac filling pressures in assessing cardiac preload. In many clinical situations, cardiac fill-ing pressures do not accurately reflect cardiac preload for at least 3 reasons. First, measuring cardiac filling pressures is not always easy. Indeed, several studies have demonstrated that observer variability in wedge pressure measurements is of potential clinical importance.11-13
Second, the pressures that are carefully measured at end-expiration are frequently higher than transmural pres-sures.14 This is the case in patients with airflow
limita-tion (autoPEEP), in patients ventilated with an external PEEP, and in patients with intra-abdominal (and hence intrathoracic) hypertension (Figure 2). Third, the rela-tionship between ventricular end-diastolic pressure and end-diastolic volume is not linear, but rather it is curvi-linear and unpredictable since it depends on ventricular compliance and thus varies from one patient to an-other.15,16 In summary, because in practice we usually
measure with poor reproducibility the nontransmural pressures that are not correlated with ventricular dimen-sions, we cannot rely on these measurements to accu-rately assess cardiac preload (Figure 2). This is why sev-eral volumetric parameters have been proposed to im-prove the accuracy of cardiac preload assessment at the bedside.
The limited value of volumetric markers of preload for predicting fluid responsiveness. The volumetric indica-tors of cardiac preload are mainly the right ventricular end-diastolic volume (RVEDV), which is evaluated by specific pulmonary artery catheters;17-19 the left
ventricu-lar end-diastolic area (LVEDA), which is measured by transthoracic or transesophageal echocardiography;20 and
the global end-diastolic volume (GEDV) and intrathoracic blood volume (ITBV), which are evaluated by transpulmonary thermodilution.21-24 Several studies have
demonstrated that these volumetric parameters can be
use-ful for predicting fluid responsiveness—but only when they are very low or very high.17,18,24 For example, it has
been shown that the rate of positive response to a fluid challenge is high when the RVEDV index is below 90 mL/m2, but low when the RVEDV index is greater than
140 mL/m2.17,18 Similar findings have been recently
re-ported with the GEDV index, which reflects the volume of blood contained in the 4 heart chambers during dias-tole. When the GEDV index is below 600 mL/m2, a
posi-tive response to a fluid challenge is very likely; in con-trast, when the GEDV index is greater than 800 mL/m2,
a positive response is very unlikely.24 However, in all these
studies, intermediate values are not more predictive than a random guess.
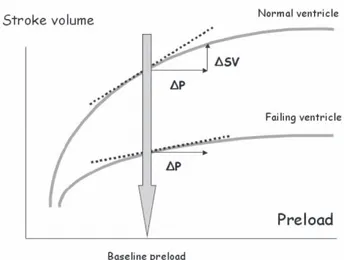
These findings are quite consistent with cardiac physiology, since the slope of the relationship between preload and stroke volume depends on contractility. Therefore, the pre-infusion cardiac preload is not the only factor influencing the response to a volume load. As illustrated in Figure 3, the increase in stroke volume, which occurs as a result of a rise in preload, depends more on the slope of the Frank-Starling curve than on
cardiac preload.25 In summary, from a physiological
point of view, assessing cardiac preload—even with volumetric parameters—cannot be really useful for pre-dicting fluid responsiveness.
Why assess volumetric indicators of cardiac preload?
Arterial pulse pressure variation (∆PP) has been shown to be very useful in predicting fluid responsiveness be-cause it provides the clinician with valuable information concerning the position on the Frank-Starling
ship.26 If the pulse pressure, which is directly
propor-tional to stroke volume, varies during a mechanical breath, it means that the patient’s heart is sensitive to changes in preload induced by mechanical insufflation, ie, that both the right and the left ventricles are operat-ing on the steep portion of the Frank-Starloperat-ing curve.26
However, ∆PP works only if we assume that 1) respira-tory changes in pleural pressure are sufficient to induce significant changes in preload and 2) fluid infusion sig-nificantly increases cardiac preload. These two condi-tions are not always met, and hence the static indica-tors of cardiac preload remain appropriate in the deci-sion-making process concerning volume expansion.
Limitations of arterial pulse pressure variation (DPP).
In a patient sensitive to changes in preload (i.e., one whose heart is operating on the steep portion of the Frank-Starling relationship), the arterial pulse pressure will vary over a single mechanical breath only if preload varies. Since respiratory changes in preload are induced by changes in pleural pressure, in patients ventilated with a low tidal volume (6 mL/kg for example), the res-piratory changes in pleural pressure may not be suffi-cient to induce significant changes in preload.7,26
There-fore, in this context, the absence of respiratory variations in arterial pulse pressure does not mean that the patient is insensitive to changes in preload (and hence would be nonresponder to a fluid challenge) but simply that preload does not vary during the respiratory cycle. In this regard, ∆PP has been validated as an accurate predictor of fluid responsiveness mainly in deeply sedated me-chanically ventilated patients having a tidal volume
≥ 8 mL/kg; therefore, it cannot currently be
recom-mended as a clinical tool in other situations.26
Moreo-ver, ∆PP cannot be used in patients with cardiac
arrhythmias.27 Therefore, when ∆PP cannot be used, the
assessment of cardiac preload may be useful for predict-ing fluid responsiveness if very low or very high values of RVEDV (< 90 or > 140 mL/m2), LVEDA (< 5 or >
20 cm/m2), ITBV (< 7 50 or > 1000 mL/m2) or GEDV
(< 600 or > 800 mL/m2) are observed. But it must be
emphasized once again that intermediate values of preload are not useful for predicting fluid responsive-ness.
Fluid therapy does not always increase cardiac preload.
One might assume that a fluid challenge systematically and necessarily induces a significant increase in cardiac preload and that it is only necessary to assess the posi-tion on the Frank-Starling curve (using ∆PP) to accu-rately identify patients who will benefit from a fluid challenge—but this is not the case. Fluid infusion in-creases intravascular blood volume (at least transiently) but not necessarily cardiac preload. Axler et al28
stud-ied the hemodynamic effects of 159 “typical rapid vol-ume infusions” in critically ill patients and did not ob-serve any significant increase in left ventricular preload as assessed by the measurement of LVEDA using echocardiography. The increase in ventricular end-diastolic volumes as a result of fluid infusion depends on the partitioning of the fluid into the different cardio-vascular compartments organized in series. When the heart is poorly compliant, giving fluid may not increase cardiac preload. Ventricular compliance can be decreased because of ischemic cardiopathy or simply because the ventricles are already dilated. These physiological or rather mechanical considerations are supported by sev-eral clinical studies. In critically ill patients receiving fluid, when the right ventricle is already dilated (RVEDV index greater than 140 mL/m2), fluid infusion does not
increase right ventricular dimensions. In contrast, when
the RVEDV index is below 140 mL/m2, the same fluid
regimen leads to a significant increase in RVEDV.17
Similar findings have been reported with the GEDV.24
In patients with septic shock receiving the same amount of fluid (500 mL of colloid) over a short period of time (20-30 minutes), we observed various responses in terms of GEDV increase.24 These findings support the notion
that a standardized fluid challenge does not induce the same increase in preload in all patients. In addition to ventricular compliance and dimensions, factors like mean intrathoracic pressure (by acting on the intra/ extrathoracic repartition of the total blood volume) or
348
CLINICS 2006;61(4):345-50 Volume management in critically ill patients
Lopes MR et al.
venous capacitance/pooling (usually increased in sepsis) may also play a role in the partitioning of the fluid in-fused. Therefore, during a fluid challenge, assessing preload is definitely useful for checking whether preload
effectively increases. If preload does not increase (for any reason), an increase in cardiac output cannot be ex-pected even if the heart is operating on the steep por-tion of the Frank-Starling curve.
RESUMO
Lopes MR, Auler JOC, Michard F. Avaliação da volemia em pacientes críticos: nova proposta. Clinics. 2006; 61(4):345-50.
Para ser efetivo em aumentar significativamente o volume sistólico um volume de fluido precisa preencher duas condições :
1- A infusão deste fluido tem que aumentar a pré-carga 2- O aumento da pré-carga tem que promover uma elevação proporcional do volume sistólico
efetivamente durante a infusão de fluido. Em caso negativo, ou seja a pré-carga não aumenta, medidas adicionais como mais fluidos, venoconstrictores para aumentar o quantidade de sangue, ou aumento do retorno venoso por redução da pressão intratorácica podem ser efetivas para atingir a primeira condição: aumento da pré-carga. Delta PP pode ser útil para verificar se o volume sistólico aumenta com a
combinando os indicadores estáticos da pré-carga (PVC, pressão capilar pulmonar) com Delta PP, consegue-se a melhor opção para monitorar a resposta aos fluidos em pacientes críticos.
UNITERMOS: Variação de pressão arterial (∆PP). Reação a fluidos. Pré-carga cardíaca. Débito cardíaco.
REFERENCES
1. Boldt J, Lenz M, Kumle B, Papsdorf M. Volume replacement strategies on intensive care units: results from a postal survey. Intensive Care Med. 1998;24:147-51.
2. Michard F, Teboul JL. Predicting fluid responsiveness in ICU patients. A critical analysis of the evidence. Chest. 2002;121:2000-8. 3. Michard F, Chemla D, Richard C, Wysocki M, Pinsky MR, Lecarpentier
Y, et al. Clinical use of respiratory changes in arteriel pulse pressure to monitor the hemodynamic effects of PEEP. Am J Respir Crit Care Med. 1999;159:935-9.
4. Michard F, Boussat S, Chemla D, Anguel N, Mercat A, Lecarpentier Y, et al. Relation between respiratory changes in arterial pulse pressure and fluid responsiveness in septic patients with acute circulatory failure. Am J Respir Crit Care Med. 2000;162:134-8.
5. Kramer A, Zygun D, Hawes H, Easton P, Ferland A. Pulse pressure variation predicts fluid responsiveness following coronary artery bypass surgery. Chest. 2004;126:1563-8.
6. Vieillard-Baron A, Chergui K, Rabiller A, Peyrouset O, Page B, Beauchet A, et al. Superior vena caval collapsibility as a gauge of volume status in ventilated septic patients. Intensive Care Med. 2004;30:1734-9. 7. De Backer D, Heenen S, Piagnerelli M, Koch M, Vincent JL. Pulse
pressure variations to predict fluid responsiveness: influence of tidal volume. Intensive Care Med. 2005;31:517-23.
350
CLINICS 2006;61(4):345-50 Volume management in critically ill patients
Lopes MR et al.
9. Feissel M, Badie J, Merlani PG, Faller JP, Bendjelid K. Pre-ejection period variations predict the fluid responsiveness of septic ventilated patients. Crit Care Med. 2005;33:2534-9.
10. Monnet X, Rienzo M, Osman D, Anguel N, Richard C, Pinsky MR, et al. Passive leg raising predicts fluid responsiveness in the critically ill. Crit Care Med. 2006;34:1402-7.
11. Komadina KH, Schenk DA, LaVeau P, Duncan CA, Chambers SL. Interobserver variability in the interpretation of pulmonary artery catheter pressure tracings. Chest. 1991;100:1647-54.
12. Hoyt JD, Leatherman JW. Interpretation of the pulmonary artery occlusion pressure in mechanically ventilated patients with large respiratory excursion in intrathoracic pressure. Intensive Care Med. 1997;23:1125-31.
13. Al-Kharrat T, Zarich S, Amoateng-Adjepong Y, Manthous CA. Analysis of observer variability in measurement of pulmonary artery occlusion pressures. Am J Respir Crit Care Med. 1999;160:415-20.
14. Pinsky M, Vincent JL, De Smet JM. Estimating left ventricular filling pressure during positive end-expiratory pressure in humans. Am Rev Respir Dis. 1991;143:993-4.
15. Raper R and Sibbald WJ. Misled by the wedge? The Swan-Ganz catheter and left ventricular preload. Chest. 1986;89:427-34.
16. Kumar A, Anel R, Bunnell E, Habet K, Zanotti S, Marshall S, et al. Pulmonary artery occlusion pressure and central venous pressure fail to predict ventricular filling volume, cardiac performance, or the response to volume infusion in normal subjects. Crit Care Med. 2004;32:691-9.
17. Reuse C, Vincent JL, Pinsky MR. Measurements of right ventricular volumes during fluid challenge. Chest. 1990;98:1450-4.
18. Diebel L, Wilson RF, Heins J, Larky H, Warsow K, Wilson S. End-diastolic volume versus pulmonary artery wedge pressure in evaluating cardiac preload in trauma patients. J Trauma. 1994;37:950-5.
19. Diebel LN, Wilson RF, Tagett MG, Kline RA. End-diastolic volume. A better indicator of preload in the critically ill. Arch Surg. 1992;127:817-22.
20. Beaulieu Y, Marik PE. Bedside ultrasonography in the ICU: part 1. Chest. 2005;128:881-95.
21. Lichtwarck-Aschoff M, Zeravik J, Pfeiffer UJ. Intrathoracic blood volume accurately reflects circulatory volume status in critically ill patients with mechanical ventilation. Intensive Care Med. 1992;18:142-7.
22. Sakka SG, Rühl CC, Pfeiffer UJ, Beale R, McLuckie A, Reinhart K, et al. Assessment of cardiac preload and extravascular lung water by single transpulmonary thermodilution. Intensive Care Med. 2000;26:180-7. 23. Michard F, Perel. Management of circulatory and respiratory failure
using less invasive hemodynamic monitoring. In: Vincent JL, ed. Yearbook of intensive care and emergency medicine. Berlin: Springer; 2003. P.508-20.
24. Michard F, Alaya S, Zarka V, Bahloul M, Richard C, Teboul JL. Global end-diastolic volume as an indicator of cardiac preload in patients with septic shock. Chest. 2003;124:1900-8.
25. Michard F, Reuter D. Assessing cardiac preload or fluid responsiveness? It depends on the question we want to answer. Intensive Care Med. 2003;29:1396.
26. Michard F. Changes in arterial pressure during mechanical ventilation. Anesthesiology. 2005;103:419-28.
27. Michard F. Volume management using dynamic parameters: the good, the bad, and the ugly. Chest. 2005;128:1902-3.