AR
TICLE
1 Centro de Estudos e Investigação em Saúde, Faculdade de Economia, Universidade de Coimbra. Av. Dr. Dias da Silva 165. 3004-512 Coimbra Portugal. [email protected] 2 Administração Regional de Saúde de Lisboa e Vale do Tejo. Lisboa Portugal.
The voice of Primary Care patients
in the Lisbon and Tagus Valley region of Portugal
Abstract This article was the result of a study aimed at determining the degree of user satis-faction with the care provided in the 125 Fam-ily Health Units (Unidades de Saúde Famil-iar - USF) and in some of the 127 Personalized Health Care Units (Unidades de Cuidados de Saúde Personalizados - UCSP) of the Region of Lisbon and Tagus Valley (LVT). A total of 20,118 questionnaires were distributed and 16,965 re-ceived (89.0% response rate). The data collection instrument used was the Europep questionnaire, essentially measuring four dimensions: medical care, non-medical care, organization of care and quality of premises. 65.3% of the respondents were women, the average age was 50.8 years, 35% had a maximum of six years of schooling, and to 5.2% this had been their first contact. There was an overall average satisfaction of 77.4%, higher in what regards the care and attention provided by professionals. Women had slightly lower sat-isfaction than men, the same as for the younger compared to the older ones. Those with less litera-cy were the ones that presented better satisfaction rates. USF had always more satisfaction than the UCSP, and models B a satisfaction greater than models A. Users penalize units with more than 12 GP and there was a great regional disparity.
Key words Satisfaction, Primary Health Care
Pedro Lopes Ferreira 1
Vítor M. Raposo 1
Fe
rr
eir
Introduction
Primary health care aims at being the first and the main contact of citizens with the health sys-tem. In line with this assumption, the ongoing primary care reform pointed out the need for a deep organizational change.
On the other hand, the role of health care providing services in meeting the needs and ex-pectations of their users is acknowledged, both in what regards the technical and the interpersonal aspects of care1,2. Furthermore, in the presence
of great changes in the knowledge-based society, of health spending increases and major budget-ary constraints, it is increasingly important that provision of care satisfies the subjective needs of patients. Therefore, the assessment of user satis-faction is nowadays recognized as an added value to other measures of outcome as the health state or the quality of life3,4 and is already considered
an indispensable component for the evaluation of quality of care; also, there is evidence of its correlation with the health outcomes. On the other hand, every organization is inserted in an environment with which it interacts continual-ly, promoting constant exchanges of goods and services. In public utility services, such as social, health and education institutions, this exchange should still be more pronounced as a result of strong pressure and growing demand for partici-pation by civil society.
Satisfaction data are typically used for two purposes. First of all, to evaluate the care provid-ed and, in addition, to prprovid-edict the «consumers’» behaviors, namely by determining whether they recommend health units that they normally at-tend or whether they would return, if necessary, to the same health units5.
This need for information also encompasses the concept of transparency – one of the cor-nerstones of good governance6-9 of any health
system – and the concept of participation that, on the other hand, includes the possibility of a complaint, the right to be heard regarding their opinion about the health system or the impact of their experience with this system10,11. It also
includes the possibility of being involved in deci-sion-making at various levels of the system, from the level of the direct provision of care up to the level of planning, priority setting and policy de-cision making12.
The Portuguese experience
In 2005, with the beginning of a new political cycle, the Mission for Primary Health Care was created, aiming to put into practice the primary health care reform. The starting point for reform was based on the low level of satisfaction of cit-izens, professionals and policy makers, deter-mined by low accessibility, inefficiency, bureau-cratic barriers and lack of incentives to improve productivity and quality13. The priority action of
the primary health care reform was the launch and implementation of Family Health Units (Unidades de Saúde Familiar - USF), models A and B, thus starting to reconfigure the Health Centers, with the ultimate goal of thoroughly re-forming the PHC (Primary Health Care). In the Health Region of Lisbon and Tagus Valley (LVT), as well as in all the country, issues such as patient safety, citizens’ rights, good practices, ethical be-havior, complaints handling, and evaluation of users’ satisfaction became intuitive and a goal shared by the entire health team.
The Europep questionnaire
The Portuguese version of the European Europep questionnaire was tested and validat-ed in Portugal and developvalidat-ed by the Centre for Health Studies and Research of the University of Coimbra (CEISUC). The Europep project was launched in 1994 by a group of Europe-an researchers under the leadership of Richard Grol, from the Centre for Quality of Care Re-search (WOK), Faculty of Medical Sciences of the University of Nijmegen, The Netherlands, in the framework of a Biomed project funded by the European Union. It was aimed at creating a measuring instrument to assess the satisfaction of primary health care users and involved the initial participation of eight countries: Denmark, Germany, Israel, Norway, Portugal, Sweden, The Netherlands, and United Kingdom. When this project ended in 1999, the Europep question-naire was thoroughly validated in 15 languages and was recognized by WONCA14, after having
been validated in various international contexts of general medicine15,16.
It should be noted that in Portugal, as early as in 2000, it was administered to users of all 86 Health Centers of LVT17; 3,969 responses were
individu-e C
ole
tiv
a,
22(3):747-758,
2017
als. The call was then made to the coordinators of the Health Sub-Regions and the sampling error amounted to 1.4%.
Then, within a study of a project led by the Portuguese Institute for Quality in Health (IQS) funded by the European Program Health XXI and managed by the Ministry of Health, all the by then existing 365 health centers were studied. 11,166 responses were obtained, representative of the population by gender, age group and sub-re-gion18,19.
When the first USF appeared, it was decid-ed to assess again the satisfaction of the users of these units, and this was immediately endorsed by the Mission for Primary Health Care of the Ministry of Health20. A one-day census was
ap-plied to the users of the 146 USF so far consti-tuted and 12,713 answers were received, corre-sponding to a final response rate of 75.8% and to a maximum error of 0.4% for a confidence interval of 95.
In Brazil there is also evidence of the use of this measurement instrument21.
Methods
This observational study, descriptive and cross-sectional and at the national level was de-veloped in June 2015 in order to determine the degree of user satisfaction with the care provid-ed in all USF, as determinprovid-ed in Ordinance No.
301/2008, of April 18, and in a few randomly selected UCSP in the Region LVT. It was also intended to perform a comparative analysis be-tween health units with the same organizational model and health units with different models22.
Conceptual model of analysis
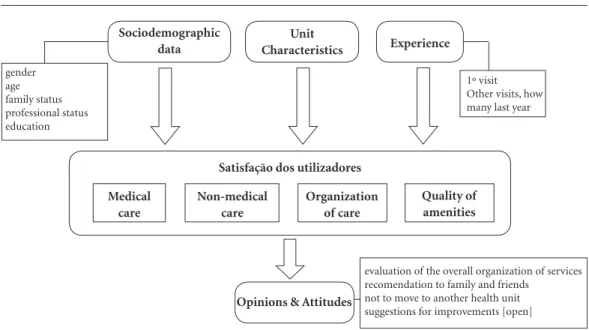
This study assumes the conceptual model in Figure 1. To measure user satisfaction of USF and UCSP it was assumed that there are determinants for this satisfaction and that these determinants are somehow grouped by sociodemographic and unit characteristics, in addition to the user own experience. The sociodemographic data mea-sured in this study included gender, age, family situation, employment status and level of edu-cation. The unit characteristics encompassed its social, economic and demographic contexts, as well as its organizational model. Finally, experi-ence was measured by the number of visits to the health unit in the previous 12 months.
Satisfaction was measured through the dimensions called ‘medical care’, ‘non-medi-cal care’, ‘organization of care’ and ‘quality of amenities. ‘Medical care‘ includes both inter-personal and technical components of general practitioners (GP) and in ‘non-medical care’ dimension are covered nursing care and atten-tion provided by clinical secretaries. Finally, in ‘organization of care’, access and overall services provided are examined. Chart 1 presents the
di-Figure 1. Conceptual Model.
Satisfação dos utilizadores Sociodemographic
data
Unit
Characteristics Experience
Medical care
gender age family status professional status education
1º visit Other visits, how many last year
evaluation of the overall organization of services recomendation to family and friends
not to move to another health unit suggestions for improvements [open]
Opinions & Attitudes Non-medical
care
Organization of care
Fe
rr
eir
mensions, sub-dimensions and questions of the questionnaire used. Each question was supposed to be answered in a 5-point Likert scale, from ex-cellent to poor.
These dimensions and sub-dimensions have been statistically obtained with factor analysis by the method of principal components after a varimax rotation and, more recently, recon-firmed in23. Previously, the values of the measure
of sampling adequacy of Kaiser-Meyer-Olkin and significance values associated with Bartlett’s sphericity test assured the feasibility of this
anal-ysis24. The four main dimensions are associated
with 75.3% of all the explained variance. Finally, it is expected that user satisfaction has an impact on the opinions and attitudes of users. Thus, this conceptual model provides for an eval-uation of the overall organization of the services, possible recommendation of the health unit to family and friends if they need health care, the willingness not to move to another health unit, and the presentation of suggestions for improve-ment of the care provided by the unit.
Chart 1. Questionnaire dimensions, subdimensions and questions.
Dimensions Subdimensions Questions
Medical care Interpersonal component
02 - Consultation time with GP 03 - Professionals showed interest
04 – Felt at ease with the general practitioner 05 – Involvement in decisions about medical care 06 – How the general practitioner listened to you 07 – Keeping your records and data confidential 08 – Providing quick relief of your symptoms
09 – Helping you to perform your normal daily activities 10 – Attention received
Technical component 11 – Examination made by the GP
12 – Offering you services for preventing diseases
13 – Explaining purpose of examinations, tests and treatments 14 – Information about symptoms and disease
15 – Help to deal with problems 16 – Help to follow GP’s advice
17 – Knowledge about previous contacts in the practice 18 – Preparing you for what to expect from specialists 23 – Competence, courtesy and kindness of GPs Non-medical care Nurses 19 – Time devoted by nurses
20 – Explanations by nurses
24 – Competence, courtesy and kindness of nurses Clinical secretariat 21 – Administrative service
22 – Explanations by clinical secretariat 25 – Competence, courtesy and kindness of staff Organization of
care
Access 27 – Ease of scheduling appointment
28 – Getting through to the practice on telephone 29 – Being able to talk to the GP on the telephone 31 – Waiting time in the waiting room
Services provided 26 – The helpfulness of the practice staff 30 – Opening hours of the unit 32 – Respect with which was treated 33 – Freedom of choice
34 – Speed in attendance 37 – Domestic care services
38 – General organization of the services Quality of amenities 35 – General comfort of facilities
e C
ole
tiv
a,
22(3):747-758,
2017
Procedures
The LVT region had 127 UCSP, 69 USF-A and 56 USF-B, a total of 252 functional units. As regards the existing UCSP, units with less than 3 GP and with more than 20% of users without GP were excluded from the analysis. The purpose of this restriction was to allow a comparison be-tween realities that, in a way, are thus more com-parable to each other. With the application of this criterion, only 15 UCSP under these conditions were obtained.
All resulting 140 functional units were then categorized according to their size, taking into ac-count the number of GP, in small, medium, large and very large. These units received a number of questionnaires according to their size. Thus, small units (with 3 to 5 GP) received 80 question-naires, medium units (6 to 8 GP) received 140 questionnaires, large units (9 to 11 GP) received 200 questionnaires, and the very large units (12 to 16 GP) received 240 questionnaires. Thus, the 140 functional units of LVT region received a to-tal of 20,118 questionnaires.
Each Citizen Office was responsible for de-livering the questionnaires to all users of 16 or more years of age who went to the health unit. They were asked to answer to the questionnaire in the premises and to put it in a box placed in a strategic health unit location.
As soon as the delivery of the questionnaires was complete, these were sent to CEISUC, where they were processed through optical reading and entered in a computer database, after performing random quality tests. In addition to the quanti-tative part, the comments that users had written, either on the slot of the open question designed for this purpose and/or on the remaining parts of the questionnaire, were separately typed.
Data analysis
The values of questions, sub-dimensions and dimensions were estimated using a weighted sum in which the values were previously converted, divided by the total number of valid responses, i.e., excluding the answers ‘does not apply’. This conversion was the result of a linear transforma-tion of scale from 1 (bad) to 5 (excellent) in a range of 0% to 100%.
Dissemination of obtained information
The main results of the study were published in CEISUC institutional webpage. Throughout the study information about the methodology was being published, as well as the name of the units under analysis and, in the end, the national results as well, these latter in free access (without access by keyword), as well as the results of each health unit, with access by means of a keyword for health unit. Using this methodology, CEISUC only had to give the keywords to the coordinators of the corresponding health units.
Results
The main results of this study, limited to the LVT Region, will now be reported, including the char-acteristics of the received sample, the respective responses rates and the values corresponding to the CEISUC satisfaction index. Will also be pre-sented results obtained from comparative anal-yses, taking into account the sociodemographic data of the respondents, their experience with the health unit, the characteristics of these units and their geographical location.
Responses received
20,118 questionnaires were sent to the of Citizens Offices of the 15 Health Centers Clus-ters (ACeS) of the LVT Region. Of these, 16,965 questionnaires were received and 1,054 were not delivered to users and were therefore considered “leftovers”. Thus, the overall response rate was 89.0%, with only 20% of ACeS with a response rate between 60% and 80%. After five weeks, 97% of the questionnaires had already been received.
Demographic characterization of the sample
The sample of respondents is mostly com-posed by (65.3%) women (n = 10,697; 65.3%) and with a mean age of 50.8 ± 17.1 years, with users’ age ranging from 16 to 98 years. Most of them (10,581; 64.9%) were married or living in partnership.
Fe
rr
eir
education degree (university or polytechnic). As regards the employment status, almost half (7,508; 47.2%) was employed and 2,550 (16.5%) were unemployed.
Experience with the health unit
The previous experience was measured by asking if this was his/her first contact with that health unit. If there was a previous contact, he/ she was asked to indicate how many more times he/she had visited the GP in the previous 12 months. The answer to the first question revealed that, for 4.0% (638) of users, this was their first visit and that, for the remaining, one-quarter (2,174) had visited the unit 1 to 2 times, the av-erage of visits stood at 5.1 and a large percentage (almost one fifth) had gone more than six times to the health unit in the previous 12 months, that is, at least, an average of once every two months.
CEISUC satisfaction index
CEISUC user satisfaction index of USF and UCSP in this sample has reached the average value of 77.1%, with a standard deviation of 17.5 (median 78.5%). However, its distribution is strongly skewed to the left, with almost half (48.3%) of the users evaluating their satisfaction with the health unit in the last quintile and only less than 3% situating on the first two quintiles.
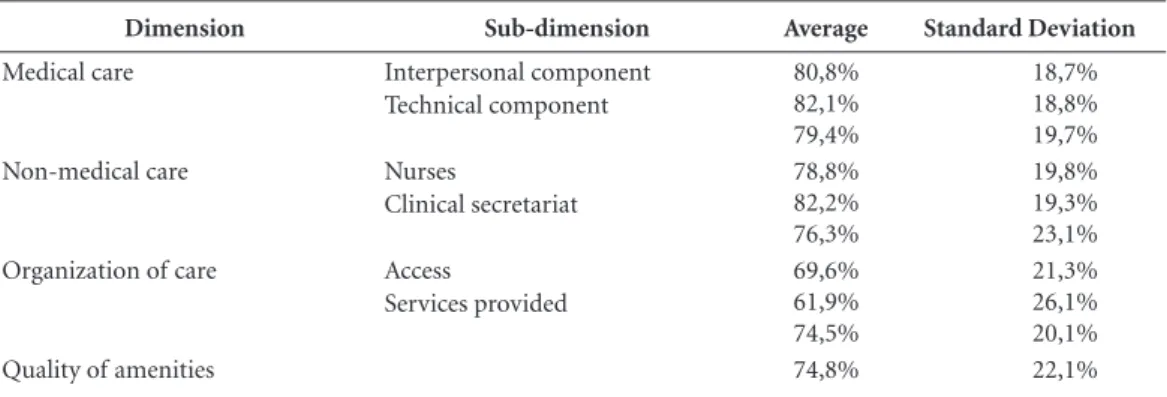
As we can see in Table 1, the four main di-mensions of this index show a greater satisfaction of users with regard to care provided, either by doctors (80.8%) or by non-medical staff (82.2%).
The organization of care was the dimension on which the worse relative satisfaction was ob-tained. The satisfaction in each of the sub-di-mensions of the index is presented below.
.
Satisfaction with medical careMedical care obtained an average of 80.8% ± 18.7%, with evidence of more users situating in the fifth quintile. Its two sub-dimensions show relative higher user satisfaction with regard to interpersonal (82.1%) and technical (79.4%) components of medical care. About half of them assessed interpersonal component of care as ex-cellent.
Now, looking closer to the answers to these two sub-dimensions, we found (data not shown in table) that in relation to interpersonal aspects users are more satisfied with: the guarantee that their records and data would be kept confidential (87.2%); how the GP listened to them (84.3%); and the ease with which they felt free to tell him their problems (83.5%). The interest shown in their personal situation (82.7%), the attention paid to their problems (81.8%) and how they were involved in decisions regarding the care provided by the GP (81.2%) were aspects that also obtained very positive values on the part of users.
In relation to the responses associated with the more technical component of care provid-ed by the GP, users notoriously recognize their competence, courtesy and kindness (83.1%), val-ue the explanation provided about the purpose of examinations, tests and treatments (81.8), the physical examination carried out by the GP (81.1%) and provision of services for preventing illness (e.g. screening, health checks and immu-nisations) (80.4%). Relatively less well evalu-ated was preparation for what to expect from specialists, hospital care, or other care providers (74.3%).
.
Satisfaction with non-medical careNon-medical care obtained an average satis-faction of 78.8% ± 19.8%, with evidence, again,
Table 1. Satisfaction with the units of the LVT region.
Dimension Sub-dimension Average Standard Deviation
Medical care Interpersonal component Technical component
80,8% 82,1% 79,4%
18,7% 18,8% 19,7% Non-medical care Nurses
Clinical secretariat
78,8% 82,2% 76,3%
19,8% 19,3% 23,1% Organization of care Access
Services provided
69,6% 61,9% 74,5%
21,3% 26,1% 20,1%
e C
ole
tiv
a,
22(3):747-758,
2017
of more users (51.5%) situating in the fifth quin-tile. Its two sub-dimensions show greater satis-faction in relation to nursing (82.2%) and clin-ical secretariat (76.3%). It is interesting to note the proportion (43.9%) who rate nursing care as excellent.
In what concerns this kind of care, users do not reveal significant variations in their extreme-ly positive evaluation, be it the time devoted to them by professionals (81.9%), the explanations they provided on procedures and care (82.4%) or their competence, courtesy and kindness (83.1%).
As of the service provided by the clinical Sec-retariat, it was evaluated slightly lower. However, the questions of this sub-dimension didn’t re-veal great variability as well, be it the time to be served (75.8%), how users were informed when information was requested (76.3%) or the com-petence, courtesy and kindness of the clinical sec-retaries (77.2%).
.
Satisfaction with the organization of care The organization of care was, as we saw ear-lier, the dimension that has obtained the lowest satisfaction average (69.6% ± 21.3%). This is visible in the decrease of the percentage of those who scored their satisfaction in the last quintile (30.8%), to the detriment of all others. On the other hand, the satisfaction of 12.1% of the re-spondents situated in the first two quartiles.In this dimension, two sub-dimensions were also analyzed and access is visibly the more pe-nalized sub-dimension, with 61.9%. Only 25.8% of respondents considered access as excellent, and about 21% of them considered it bad or fair.
Still with regard to access, the most penalized was the possibility of getting through by tele-phone either to the unit (57.3%) or to the GP himself (59.6%). Another aspect in which some dissatisfaction was also shown was the time they waited in the waiting room (61.1%).
With regard to services provided, was highly valued the respect that users feel because of how they are treated and their privacy is maintained (80.2%). Least satisfied are in relation to the open-ing hours of the unit (72.1%), the provision of quick services for urgent health problems (72.9%) and the freedom to choose the health professional and to have a second opinion (72.0%).
.
Satisfaction with the quality of amenities The dimension concerning the quality of amenities had an average satisfaction of 74.8% with a standard deviation of 22.1%. The general comfort of units, including temperature, envi-ronment, noise, lighting and facilities was thedi-mension that obtained the least satisfaction from users of this study (71.3%).
Satisfaction of special needs
Users were asked if their health unit respond-ed to the nerespond-eds felt for example, by children, the elderly and disabled people. More than 81% of users gave an affirmative answer to the question put. For each user who considers that his/her unit does not respond to these needs, there are eight users who consider the opposite.
Recommendation of health unit to friends
Users were then questioned about the pos-sibility of strongly recommending their unit to friends, if medical care was needed. From the re-sponses obtained, it follows that 87.5% of users responded affirmatively to the question. For each user who does not strongly recommend his/her health unit to friends, there are 10 users who con-sider the opposite.
Reasons not to move to another health unit
Users were asked if they saw any reason not to move to another health unit. Of the questions corresponding to the overall satisfaction, this one presented the least negative responses (7.4%) re-sulting from possible dissatisfaction. For every individual who sees reasons to move to another health unit, there are 12 who consider the oppo-site.
Asymmetry of satisfaction vis a vis sociodemographic and unit characteristics
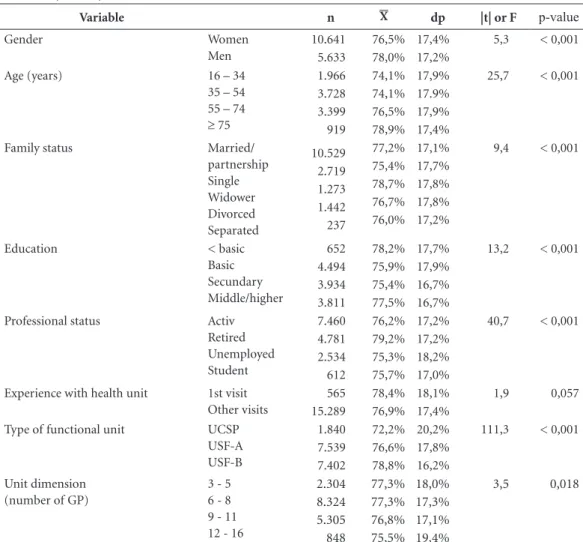
The asymmetry of satisfaction was analyzed taking into account gender, age, family situation, education, employment status, experience with the health unit, and type and size of the unit. Ta-ble 2 presents the results.
As can be seen in this table, men are slight-ly more satisfied than women with primary care provided. Furthermore, the creation of the age groups allowed for the statement that age also has an influence on the evaluation of satisfaction, i.e. as age advances, the higher is satisfaction rat-ing. A possible explanation may be the decrease of expectations or better attention devoted to the elderly. This difference in satisfaction is not visi-ble between the first two age groups studied.
Fe
rr
eir
of these differences were influenced by gender and by age of the respondent. The education also shows some influence on satisfaction. In fact, people less educated are those who reveal best satisfaction ratings. On the other hand, it turns out that retired persons (older) are the ones that, again, have highest rates of satisfaction. Students (younger) are those who most penalize the way they were treated by primary care.
The experience with the health unit was an-alyzed from an item that questioned if this was his/her first contact with the unit. In the case of a negative answer, was also asked how many more times he/she had visited the unit. For 825 users this has been their first contact with this health unit. The remaining 94.8% of the respondents had visited the unit one to four more times, in the previous 12 months. Not found any statistically significant difference between these two groups.
One of the most challenging points of this study was to check whether user satisfaction is sensitive to the organization and management model of care. That is, whether we should expect that the UCSP units have the same level of satis-faction than the USF model A and the latter the same level of satisfaction than model B. Evidence showed greater satisfaction of users of USF mod-el B vis a vis the USF modmod-el A and of these vis a vis users of UCSP.
The size of the functional units was also examined and it was clear that the scale of the health unit has some impact on user satisfaction with regard to the various levels of satisfaction, in particular when we isolate the very large units. In general, these feature statistically lower values of satisfaction than the other.
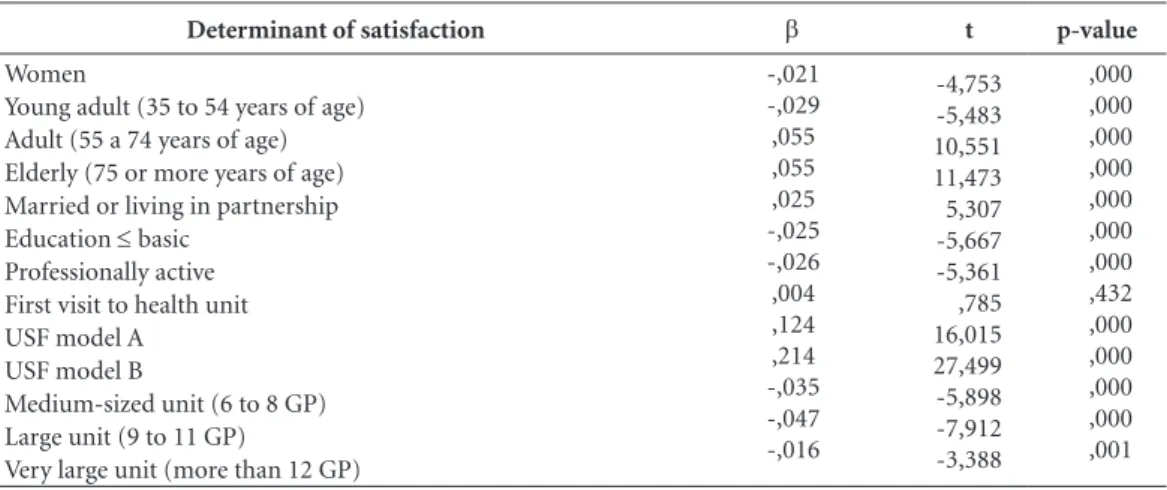
When all these determinants are analyzed, now from a multivariate perspective, the results
Table 2. Asymmetry of satisfaction of CEISUC index of satisfaction.
Variable n X dp |t| or F p-value
Gender Women Men 10.641 5.633 76,5% 78,0% 17,4% 17,2%
5,3 < 0,001
Age (years) 16 – 34
35 – 54 55 – 74
≥ 75
1.966 3.728 3.399 919 74,1% 74,1% 76,5% 78,9% 17,9% 17.9% 17,9% 17,4%
25,7 < 0,001
Family status Married/ partnership Single Widower Divorced Separated 10.529 2.719 1.273 1.442 237 77,2% 75,4% 78,7% 76,7% 76,0% 17,1% 17,7% 17,8% 17,8% 17,2%
9,4 < 0,001
Education < basic
Basic Secundary Middle/higher 652 4.494 3.934 3.811 78,2% 75,9% 75,4% 77,5% 17,7% 17,9% 16,7% 16,7%
13,2 < 0,001
Professional status Activ Retired Unemployed Student 7.460 4.781 2.534 612 76,2% 79,2% 75,3% 75,7% 17,2% 17,2% 18,2% 17,0%
40,7 < 0,001
Experience with health unit 1st visit Other visits 565 15.289 78,4% 76,9% 18,1% 17,4% 1,9 0,057
Type of functional unit UCSP USF-A USF-B 1.840 7.539 7.402 72,2% 76,6% 78,8% 20,2% 17,8% 16,2%
111,3 < 0,001
Unit dimension (number of GP)
3 - 5 6 - 8 9 - 11 12 - 16
2.304 8.324 5.305 848 77,3% 77,3% 76,8% 75,5% 18,0% 17,3% 17,1% 19,4% 3,5 0,018
e C
ole
tiv
a,
22(3):747-758,
2017
previously presented in a univariate form are confirmed (Table 3).
In fact, we observed the lowest satisfaction among women and among young people and greater satisfaction in adults and the elderly. We noted also that the user in active professional situation, regardless of the other determinants, reveals lower satisfaction with the care provided and that, again, to be enrolled in a USF is associ-ated with greater satisfaction. Finally, we noted that the dimension of the health unit makes a negative difference in terms of satisfaction.
Regional asymmetry
The null hypothesis of no regional asymme-try was also tested, that is, the variability of the satisfaction ratings among the units of the ACeS of the LVT Region. In general, we found large asymmetries (F = 60.2; p < 0.001), with the satis-faction among the ACeS ranging from 68.2% to 85.0.
Comparison of the results with those obtained in 2009
Finally, one of the objectives initially set for this study was the comparison, as far as possible, between the results obtained with the USF in 2009 and those found in 2015. In fact, in 2009, the 42 USF then existing in the region showed an average satisfaction of 73.3% ± 4.1%, while the same in 2015 showed an average of 78.7% ± 5.4%. This difference is statistically significant (|t|=5.99; p < 0.001).
Discussion
Included users of all USF and a selected sample of the UCSP then existing in the LVT Region. For the sake of viability of comparison between USF and UCSP, were only considered eligible for selection those UCSP that were as similar as pos-sible to the USF, that is, with at least three GPs and a percentage of users without family doctor of less than 20%.
The questionnaire used followed the concep-tual model of the Europep questionnaire with four main dimensions: medical care, non-medi-cal care, organization of care and quality of ame-nities. The first dimension includes the sub-di-mensions ‘interpersonal component’ and ‘tech-nical component’; the second dimension, the sub-dimensions ‘nurses’ and ‘clinical Secretariat’; and the third dimension, the sub-dimensions ‘ac-cess’ and ‘services provided’.
20,118 questionnaires were delivered to users by the Citizen Offices of the ACeS. Of these, were completed and received: 7,640 from the 69 USF model A; 7,464 from the 56 USF model B; and 1,861 from the 15 UCSP, that is, a total of 16,965 responses from 140 primary health care func-tional units of the LVT region. This correspond-ed to a general rate of responses of 89.0% from users of USF and 90.1% from users of UCSP.
Regarding the characteristics of the sample, we can state that 65.3% of the respondents were female, with an average age of 50.8 years, 35% had an educational level less than or equal to the second cycle of basic education and, to 5.2% this had been their first contact.
Determinant of satisfaction b t p-value
Women
Young adult (35 to 54 years of age) Adult (55 a 74 years of age) Elderly (75 or more years of age) Married or living in partnership Education ≤ basic
Professionally active First visit to health unit USF model A
USF model B
Medium-sized unit (6 to 8 GP) Large unit (9 to 11 GP)
Very large unit (more than 12 GP)
-,021 -,029 ,055 ,055 ,025 -,025 -,026 ,004 ,124 ,214 -,035 -,047 -,016
-4,753 -5,483 10,551 11,473 5,307 -5,667 -5,361 ,785 16,015 27,499 -5,898 -7,912 -3,388
,000 ,000 ,000 ,000 ,000 ,000 ,000 ,432 ,000 ,000 ,000 ,000 ,001
b: regression coeficient; p-value: signiicance.
Fe
rr
eir
In what concerns satisfaction, we can say that the CEISUC satisfaction index showed an aver-age value of 77.4% with a standard deviation of 17.4%. As with other authors, we found a satisfac-tion with a strongly left skewed distribusatisfac-tion20,21.
The dimensions in which users were most satis-fied were those relating to the care and attention provided by doctors (81.0%), by nurses (82.5%) and by the clinical secretariat staff (76.4%). In the global, 81.2% of users would recommend the health unit to friends, especially in the USF mod-el B (91.7%), when compared to the USF modmod-el A (86.4%) and the UCSP (75.5%). On the other hand, 89.5% of users did not see reasons to move to another unit, mainly, and again, users of the USF model B (92.4%), when compared with the USF model A (89.2%) and the UCSP (79.4%).
Women showed a slightly lower satisfaction than men (77.1% vs. 78.4%); the young people from 16 to 34 years of age also showed a satis-faction lower than elderly with 75 years of age or older (75.3% vs. 81.0%). In fact, this was an a priori expected result, given the similar results previously obtained by us and by other studies of satisfaction17,19,20,25,26. People with education
lesser than the basic education showed the best satisfaction ratings (79.5%); retired people, pos-sibly due to their age, were those who showed the highest satisfaction (80.6); a larger experience makes users increasingly satisfied, especially with the interpersonal component of medical care (first visit: 80.5%; more visits: 82.0%) and nurs-ing care (1st visit: 81.5%; more visits: 83.3%); users of USF showed higher levels of satisfaction than those of UCSP (72.7%) and, within the USF, model B (79.5%) presented better satisfac-tion than model A (76.8%); the larger units are those which reveal worse levels of satisfaction, no matter the management model followed; and sig-nificant asymmetry in satisfaction was detected among the LVT Region’s ACeS.
Furthermore, based on the values of satisfac-tion obtained in 2009 in the USF then evaluat-ed in the region, when levels of satisfaction are compared with the values now found, there are statistically significant increases.
Finally, by looking at the results of this study, we can see that we have achieved a very high re-sponse rate, which minimizes the risk of selection bias due to withdrawals, and hardly does change the factorial structure of the questionnaire, as well as it leads to very small confidence intervals for the results.
Conclusions
The main objective of this study was to deter-mine the degree of user satisfaction, object of contracting of USF and UCSP, as provided in Ordinance No. 301/2008 of 18 April. It was also intended to perform a comparative analysis with-in the framework of primary health care, among health units with the same organizational model and among health units with different models.
The use of indicators of satisfaction in health governance plays an important role in the con-tinuous improvement of quality, innovation, dis-semination of best practices, and transparency and accountability/responsibility10,19. As
suggest-ed in previous works, this evaluation bassuggest-ed on satisfaction indicators should also include other indicators in areas such as availability, access, pro-ductivity, continuity, effectiveness and efficiency for exemple27 to support the decision-making of
the decision-makers involved.
In the light of the results obtained, it is con-sidered absolutely necessary, from a perspective of continuous quality improvement, and taking into account previous studies10,19, to set a system
of incentives and interventions to reward those with better results and support those with less good results, so that they improve. This approach should absolutely take into account the model under consideration (USF and UCSP) and be supported and actively pursued by the upper in-stances of the Ministry of Health – macro health governance – and by Regional Health Authorities and by the ACeS – meso health governance – so that effective transformations occur at the level of organizations – organizational governance.
A poor score of a health unit in consequence of the application of this classification system does not necessarily mean that we’re looking at a health unit that does not practice acceptable levels of medical care. This means only that the user experience is poor and, as a consequence, the evaluation they do is penalizing. These in-terventions may range from the assignment of greater autonomy and control to the highest clas-sified units, up to financial aid and external assis-tance for the most poorly classified, not leaving out the clear need, taking into account the results obtained, of achieving the transition from the UCSP model to the USF model.
e C
ole
tiv
a,
22(3):747-758,
2017
also needs to know its position with regard to the others, so that its successes are shared and its weaknesses identified, in such a way that they represent an opportunity and a starting point for new interventions for change.
Once again is demonstrated that the Portu-guese version of Europep is a valid and easy to use instrument to obtain information about pa-tients’ experience with the evaluation of primary health care.
Collaborations
Fe
rr
eir
References
1. Campbell SM, Roland MO, Buetow SA. Defining quali-ty of care. Soc Sci Med 2000; 51(11):1611-1625. 2. Donabedian A. The quality of care. How can it be
as-sessed? JAMA 1988; 260(12):1743-1748.
3. Grol R, Wensing M, Mainz J, Jung HP, Ferreira PL, Hearnshaw H, Hjortdahl P, Olesen F, Reis S, Ribacke M, Szecsenyi J. Patients in Europe evaluate general practice care: an international comparison. Br J Gen Pract 2000; 50(460):882-887.
4. Debono D, Travaglia J. Complaints and patient satisfac-tion: a comprehensive review of the literature. Sydney: University of New South Wales; 2009.
5. Ware J, Davies-Avery A, Stewart A. The Measurement and Management of Patient Satisfaction: A Review of the Literature. Santa Monica: Rand Corporation; 1977. 6. Barbazza E, Tello JE. A review of health governance:
Definitions, dimensions and tools to govern. Health Policy 2014; 16(1):1-11.
7. Dodgson R, Lee K, Drager N. Global Health Gover-nance: a Conceitual Review. London: Dept of Health & Development World Health Organization, Centre on Global Change & Health London School of Hygiene & Tropical Medicine; 2002.
8. Grahan J, Amos B, Plumptre T. Principles for Good Gov-ernance in the 21st Century. Ottawa: Institute on Gov-ernance; 2003. Policy Brief nº 15.
9. United Nations Development Programme (UNDP).
Reconceitualising Governance. New York: UNDP; 1997. 10. Ferreira PL, Raposo V. A governação em saúde e a
uti-lização de indicadores de satisfação. Revista Portuguesa de Clínica Geral 2006; 22:285-296.
11. Sakellarides C, coordenador. Conhecer os caminhos da saúde. Relatório de Primavera 2001. Lisboa: Observa-tório Português dos Sistemas de Saúde (OPSS); 2001. 12. Serapioni M, Ferreira PL, Antunes P. Participação em
Saúde: Conceitos e conteúdos. Notas Económicas 2014; 40:26-40.
13. Pisco L. Reforma da Atenção Primária em Portugal em duplo movimento: unidades assistenciais autónomas de saúde familiar e gestão em agrupamentos de Cen-tros de Saúde. Cien Saude Colet 2011; 16(6):2841-2852. 14. Ferreira PL. A voz dos doentes: satisfação com a medi-cina geral e familiar. In: Ferreira PL. Portugal. Instru-mentos para a melhoria contínua da qualidade. Lisboa: Direcção Geral da Saúde; 1999. p. 1-57.
15. Grol R, Wensing M, Mainz J, Ferreira PL, Hearnshaw H, Hjortdahl P, Olesen F, Ribacke M, Spenser T, Szecsenyi, J. Patients’ priorities with respect to general practice care: an international comparison. Fam Pract 1999; 16(1):4-11.
16. Hearnshaw H, Wensing M, Mainz J, Grol R, Ferreira PL, Helin-Salmivaara A, Hjordahl P, Olesen F, Ribacke M, Szecsenyi J. The effects of interactions between patient characteristics on patients´ opinions of general practice in eight European countries. Primary Health Care Re-search and Development 2002; 3:231-237.
17. Ferreira PL, Luz A, Valente S, Raposo V, Godinho P, Fe-lício ED. Determinantes da satisfação dos utentes dos cuidados primários: o caso de Lisboa e Vale do Tejo.
Revista Portuguesa de Saúde Pública 2001; 2:53-61. 18. Ferreira PL. Avaliação dos doentes de cuidados
primá-rios. Aspetos da clínica geral mais importantes para os doentes. Revista Portuguesa de Clínica Geral 2001; 17:15-45.
19. Ferreira PL, Raposo V, Godinho P. A voz dos utilizadores dos centros de saúde. Lisboa: Instituto da Qualidade em Saúde; 2005.
20. Ferreira PL, Antunes P, Portugal S. O valor dos cuidados primários: Perspectiva dos utilizadores das USF. Lisboa: Ministério da Saúde; 2010.
21. Brandão AS, Giovanella L, Campos CA. Avaliação da atenção básica pela perspectiva dos usuários: adapta-ção do instrumento EUROPEP para grandes centros urbanos brasileiros. Cien Saude Colet 2013; 18(1):103-114.
22. Ferreira PL, Raposo V. Monitorização da satisfação dos utilizadores das USF e de uma amostra de UCSP. Relató-rio de projeto. Coimbra: Centro de Estudos e Investiga-ção em Saúde da Universidade de Coimbra; 2015. 23. Roque H, Veloso A, Ferreira PL. Versão portuguesa do
questionário EUROPEP: contributos para a validação psicométrica. Rev Saude Publica 2016; 50:61. 24. Lisboa JV, Augusto MG, Ferreira PL. Estatística aplicada
à gestão. Porto: Vida Económica; 2012.
25. Milano M, Mola E, Collecchia G, Carlo AD, Giancane R, Visentin G, Nicolucci A. Validation of the Italian version of the EUROPEP instrument for patient eval-uation of general practice care. Eur J Gen Pract 2007; 13(2):92-94.
26. Bjertnaes OA, Lyngstad I, Malterud K, Garratt A. The Norwegian EUROPEP questionnaire for patient eval-uation of general practice: data quality, reliability and construct validity. Fam Pract 2011; 28(3):342-349. 27. Marshall M, Campbell S, Hacker J, Roland M, editors.
Quality indicators for general practice: a practical guide for health professionals and managers. London: Royal Society of Medicine Press Ltd; 2002.
Article submitted 15/11/2016 Approved 05/12/2016