Atazanavir
+
Ritonavir Administered as First-Line
Therapy for the Treatment of HIV Infection in Italy: From
Randomised Trial to Real World
Emanuela Foglia1, Paolo Bonfanti2, Giuliano Rizzardini3, Erminio Bonizzoni4, Umberto Restelli1,5*, Elena Ricci3, Emanuele Porazzi1, Francesca Scolari1, Davide Croce1,5
1CREMS (Centre for Research on Health Economics, Social and Health Care Management), University Carlo Cattaneo - LIUC, Castellanza, Varese, Italy,2Department of Infectious and Tropical Diseases, A. Manzoni Hospital, Lecco, Italy,3First and Second Departments of Infectious Diseases, L. Sacco Hospital Authority, Milan, Italy, 4Department of Occupational Health Clinica L. Devoto Labour, Section of Medical Statistics and Biometry G.A. Maccacaro, Faculty of Medicine and Surgery, University of Milan, Milan, Italy,5Faculty of Health Sciences, University of the Witwatersrand, Johannesburg, South Africa
Abstract
Objective:To estimate the lifetime cost utility of two antiretroviral regimens (once-daily atazanavir plus ritonavir [ATV+r]
versus twice-daily lopinavir/ritonavir [LPV/r]) in Italian human immunodeficiency virus (HIV)-infected patients naı¨ve to treatment.
Design: With this observational retrospective study we collected the clinical data of a cohort of HIV-infected patients
receiving first-line treatment with LPV/r or ATV+r.
Methodology:A Markov microsimulation model including direct costs and health outcomes of first- and second-line highly
active retroviral therapy was developed from a third-party (Italian National Healthcare Service) payer’s perspective. Health and monetary outcomes associated with the long-term use of ATV+r and LPV/r regimens were evaluated on the basis of
eight health states, incidence of diarrhoea and hyperbilirubinemia, AIDS events, opportunistic infections, coronary heart disease events and, for the first time in an economic evaluation, chronic kidney disease (CKD) events. In order to account for possible deviations between real-life data and randomised controlled trial results, a second control arm (ATV+r 2) was
created with differential transition probabilities taken from the literature.
Results:The average survival was 24.061 years for patients receiving LPV/r, 24.081 and 24.084 for those receiving ATV+r 1
and 2 respectively. The mean quality-adjusted life-years (QALYs) were higher for the patients receiving LPV/r than those receiving ATV+r (13.322 vs. 13.060 and 13.261 for ATV+r 1 and 2). The cost-utility values were 15,310.56 for LPV/r, 15,902.99
and 15,524.85 for ATV+r 1 and 2.
Conclusions:Using real-life data, the model produced significantly different results compared with other studies. With the
innovative addition of an evaluation of CKD events, the model showed a cost-utility value advantage for twice-daily LPV/r over once-daily ATV+r, thus providing evidence for its continued use in the treatment of HIV.
Citation:Foglia E, Bonfanti P, Rizzardini G, Bonizzoni E, Restelli U, et al. (2013) Cost-Utility Analysis of Lopinavir/Ritonavir versus Atazanavir+Ritonavir
Administered as First-Line Therapy for the Treatment of HIV Infection in Italy: From Randomised Trial to Real World. PLoS ONE 8(2): e57777. doi:10.1371/ journal.pone.0057777
Editor:Maarten Postma, Groningen Research Institute of Pharmacy, United States Of America
ReceivedApril 11, 2012;AcceptedJanuary 29, 2013;PublishedFebruary 27, 2013
Copyright:ß2013 Foglia et al. This is an open-access article distributed under the terms of the Creative Commons Attribution License, which permits
unrestricted use, distribution, and reproduction in any medium, provided the original author and source are credited.
Funding:An unconditional grant was received by Abbott Italy, to cover the costs for the reprocessing of data. The funders had no role in study design, data
collection and analysis, decision to publish, or preparation of the manuscript.
Competing Interests:An unconditional grant was received by Abbott Italy, to cover the costs for the reprocessing of data. This does not alter the authors’
adherence to all the PLOS ONE policies on sharing data and materials.
* E-mail: urestelli@liuc.it
Introduction
The generalizability of cost-effectiveness data gleaned from multinational studies is being increasingly called into question. Unless contextualised in the country of reference [1–3], such data will fail to capture salient differences in clinical practice, population characteristics, health care costs, treatment preferenc-es, and cost-opportunity of resources [4]. This is of relevance for
institutional decision makers, who are more likely to be interested in the prompt availability of context-specific data than heteroge-neous data reported in an international study [5].
currently reimbursed by the National Health Service (NHS), without any threshold of utilisation (as for new drugs). However, human immunodeficiency virus (HIV) infection, once a fatal condition and now considered a chronic disease, has driven up overall NHS expenditures, with the result that the Italian NHS, like other health systems, is facing a general scarcity of resources. The decisions taken by the London Consortium in the U.K. are another example of this problem [6].
The introduction of a new therapeutic intervention implies not only an evaluation of its effectiveness, but also its long-term economic impact on the overall health budget and expenditures, without which the feasibility of the decision to introduce it will remain elusive.
Numerous predictive models have been proposed to elucidate the dynamics and the possible long-term consequences of HIV infection in terms of costs and effectiveness. Previous studies have evaluated this problem using a cost-utility approach from the patients’ perspective and by studying their preferences in various life conditions. Furthermore, Simpson et al. [7–10] laid the basis for the development of a Markov model in HIV infection. This predictive model was used to analyze the results of the CASTLE study (an open-label international non-inferiority randomised study of the use of LPV/r vs. ATV+r in antiretroviral-naı¨ve HIV-1-infected patients) [11], in terms of quality-adjusted life years (QALY) related to the patients’ health states and the associated costs. A later study [12] applied the Markov micro-simulation model (based on the individual patient level) to HIV-infected patients in accordance with the most recent international guidelines on drug treatment and patients evaluation (e.g., using 8 instead of 12 health states), rate of opportunistic infections (OIs), AIDS diagnosis, coronary heart disease (CHD) events, and incidence of hyperbilirubinemia and diarrhoea.
In the present study, we added to the model long-term renal toxicity, i.e., chronic kidney disease (CKD), an important event associated with both HIV infection and HAART. To date, this variable has never been taken into account in the evaluation,
although the EuroSIDA study had considered it in terms of incidence and associated factors [13].
Here, the model was used to estimate the real lifetime cost utility of two ARV treatment regimens (once-daily atazanavir+ritonavir [ATV+r] in combination with tenofovir-emtricitabine [TDF/ FTC] versus twice-daily lopinavir/ritonavir [LPV/r]) in Italian HIV-infected patients naı¨ve to ARV treatment
Methods
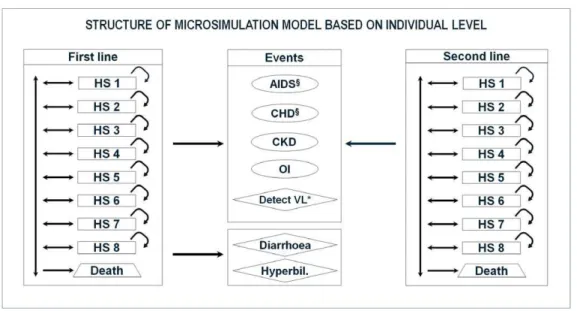
The Markov microsimulation model devised by Broder et al. [12] was further refined to create a new model (Fig. 1) from the NHS payer’s perspective that included direct costs and health outcomes of Italian HIV-infected patients receiving ATV+r or LPV/r.
Population Sample
Patients attending the Infectious Disease Department 1, L. Sacco Hospital, Milan, were considered eligible to enter the study if diagnosed HIV-positive, were receiving first-line treatment with LPV/r or ATV+r, and had been followed up for 2 consecutive years after treatment initiation. Other inclusion criteria were: age
.18 years old, HIV-1 RNA $5000 copies/mL, resident of Lombardy, and retrospectively identified from the Department clinical database of patients starting first-line treatment.
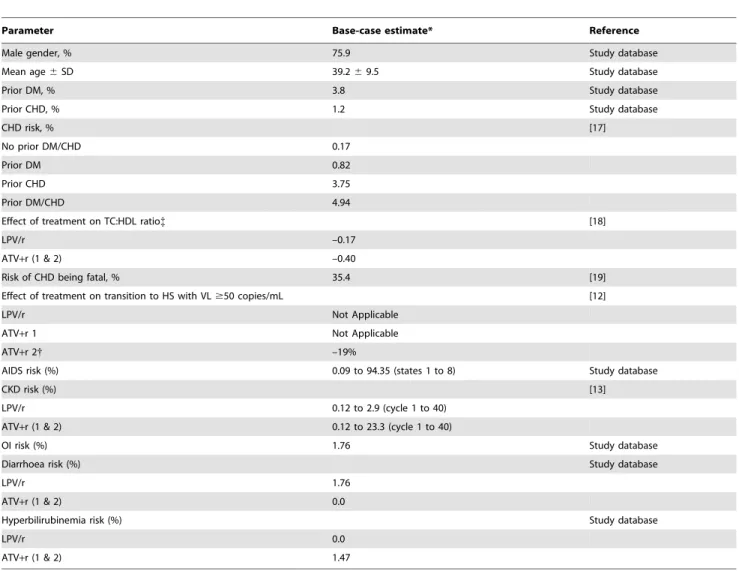
A consent form allowing the use of personal medical data was signed by the patients on their first visit to the Department to ensure anonymous data processing analysis. Base-case estimates are shown in Table 1.
Enrolment followed one of two scenarios: initiation of LPV/r or ATV+r (ATV+r 1), after which the patients remained on first-line treatment or switched to second-line treatment; the two lines were modelled at the individual patient level, in accordance with the analysis of the cohort study data.
Figure 1. Structure of the microsimulation model at the individual level.Circle: event that does not determine a change of line of treatment. Rhombus: event that determine a change of line of treatment. HS: Health State. CHD: Coronary heart disease. CKD: Chronic kidney disease. OI: Opportunistic infection. VL: Viral load.1event that may lead to death. * Detectable viral load for two consecutive semesters. Patients enter the model being in first-line treatment (LPV/r or ATV+r). After each cycle, patients may change health state, die or experience events that may lead to a change
in the line of treatment (patients in second-line had different treatment options that excluded those on first-line). Diarrhoea and hyperbilirubinemia may be experienced only by patients in first-line treatment, since these adverse events are associated with LPV/r and ATV+r therapies.
Model Characteristics
The patients on first-line therapy were categorized in eight health states according to CD4 cell count and viral load (HIV RNA copies/mL) (Table 2), as previously described [7,8,11,12]. Patients with two consecutive detectable viral loads, or a primary treatment-related adverse event (diarrhoea or hyperbilirubinemia), or requiring a switch of drug regimen were assigned second-line treatment. The patients on second-line therapy had treatment options that excluded first-line options. Second-line treatment include all the treatment lines after the first line, and consider all the events and the HIV pathology evolution up to a patient’s death.
Transition probabilities for first-line health states (Table 2) were estimated from a sample of ARV-naı¨ve patients starting HAART with LPV/r or ATV+r [14]. Second-line transition probabilities were estimated from the same database, but considering all second-line patients except those on LPV/r or ATV+r.
The patients’ progression through the health states was evaluated within a time frame of 6 months, in accordance with
Italian clinical guidelines [15]. Health and monetary outcomes, associated with the long-term use of ATV+r and LPV/r regimens, were estimated for the eight health states, the incidence of diarrhoea and hyperbilirubinemia, AIDS events, opportunistic infections (OIs), coronary heart disease (CHD), and chronic kidney disease (CKD). The total cost per patient was calculated considering drug costs and patient’s clinical conditions (HS), as well as institutional guidelines, protocols and the reimbursement rates applied by the Region of Lombardy. Cost data and QALYs were discounted at an annual rate of 3% [16].
Based on the probabilities analysed in the reprocessing of the database, the microsimulation model was populated with a cohort of 500,000 subjects in each arm. In order to determine whether there was a significant deviation between real-life data and RCT results, a second control arm (ATV+r 2) was introduced, whereby the differential effectiveness results reported in the CASTLE study were applied to the transition probabilities of ATV+r 2.
Table 1.Base-case estimates used within the model
Parameter Base-case estimate* Reference
Male gender, % 75.9 Study database
Mean age6SD 39.269.5 Study database
Prior DM, % 3.8 Study database
Prior CHD, % 1.2 Study database
CHD risk, % [17]
No prior DM/CHD 0.17
Prior DM 0.82
Prior CHD 3.75
Prior DM/CHD 4.94
Effect of treatment on TC:HDL ratio{ [18]
LPV/r –0.17
ATV+r (1 & 2) –0.40
Risk of CHD being fatal, % 35.4 [19]
Effect of treatment on transition to HS with VL$50 copies/mL [12]
LPV/r Not Applicable
ATV+r 1 Not Applicable
ATV+r 2{ –19%
AIDS risk (%) 0.09 to 94.35 (states 1 to 8) Study database
CKD risk (%) [13]
LPV/r 0.12 to 2.9 (cycle 1 to 40)
ATV+r (1 & 2) 0.12 to 23.3 (cycle 1 to 40)
OI risk (%) 1.76 Study database
Diarrhoea risk (%) Study database
LPV/r 1.76
ATV+r (1 & 2) 0.0
Hyperbilirubinemia risk (%) Study database
LPV/r 0.0
ATV+r (1 & 2) 1.47
SD: standard deviation; DM: diabetes mellitus; CHD: Coronary heart disease; TC: Total cholesterol; HDL: High-density lipoprotein; VL: Viral load; HS: Health state; OI: Opportunistic infection; CKD: Chronic kidney disease
*Estimates gathered from the literature and expressed as incidence rates (i.e., event/person-years) were converted into semestral probabilities using standard formulas {
Transition probabilities of transitioning to a state with greater viral load ($50 copies/mL) are 19% lesser than LPV/r {Effect on TC:HDL ratio is considered null in second-line treatment
The aim of these scenarios, i.e., the real-life situation and the scenario adjusted considering the results of the CASTLE study, was to forecast the lifetime development of the population.
The economic model was built and analysed using TreeAge Pro Suite 2010 (TreeAge Software Inc., Williamstown, MA).
Event Rates
The model included different types of events: AIDS, CHD, OIs, diarrhoea, hyperbilirubinemia, and CKD. The AIDS event rate was related to the health state of each patient, according to CD4 cell count and viral load, whereas CHD incidence was calculated as the pooled risk of low, medium and severe events (angina, ischemic diseases, heart failure, acute myocardial infarction and stroke). The CHD risk was related to diabetes, prior CHD events and to total cholesterol (TC)/high-density lipoprotein (HDL) ratio, wherein a unit decrement in the ratio predicted a 14% reduction in CHD risk [17].
As described by Broder [12], Simpson [8], and the CASTLE study [18], the cardiovascular risk was adjusted to take into account that few CHD events are fatal [19].
Since the timelines of the model output were 2, 5, 10, 20 years, and lifetime, it was not possible to use the Framingham algorithm due to the gap in time. Therefore, the same assumptions as Broder et al. 2011 had made [12] were adopted. In our model (Fig. 1), CHD and AIDS events could lead to death.
Within the sample, the OI rate included tuberculosis, oesoph-ageal candidiasis and gastric candidiasis, and the rate of adverse events was calculated from their occurrence (any grade gastroin-testinal adverse event and hyperbilirubinemia) in the sample during the follow-up period.
The incidence of CKD was based on the EuroSIDA study [13], which categorised kidney disease into five levels, from low (glomerular filtration rate [GFR] 89–60 ml/min) to severe (GFR
,15 ml/min). Rates were calculated in CKD severity strata, using clinical guidelines [20], and their distribution in the HIV-infected population. CKD rates increased steadily every 6 months in the patients receiving first-line therapy, whereas the CKD rate for the second-line patients remained unchanged at the level observed in the last 6 months when they were on first line. OIs and CKD were not considered to affect mortality or treatment effectiveness.
Costs
The economic resource categories were: antiretroviral (ARV) drugs; outpatient and specialist services; other medicines pur-chased locally; and hospital admissions. Unlike those for AIDS, CHD, OIs, AEs and CKD, the ARV costs were calculated separately for each treatment arm. Hospital admissions were associated with HIV infection but not attributable to AIDS, CHD, OIs, drug-related adverse events or CKD. The cost of ARV drugs was derived from the Official Lombardy Region Bulletin [21].
The cost for each of the eight health states was estimated from the actual resource consumption recorded in the Lombardy Region databank (Lombardy Region Integrated Patient Data-base). The data represent the actual consumption of NHS resources in a real-life situation. They were reprocessed consid-ering the reference cohort.
The cost of an AIDS event was calculated on the basis of Diagnosis Related Group (DRG) reimbursement, paid by the Lombardy Region, and did not take into account the patient’s health state.
The cost of a CHD event was calculated on the basis of event severity and weighted with the respective incidence in the population and derived from an average of the DRG if
hospitalisation, diagnostic procedures, specialist visits, and treat-ments were consumed.
The cost calculated for OIs depended on the event: for tuberculosis it was DRG reimbursement, drug treatment and diagnostic tests, whereas for oral candidiasis it was specialist visit, diagnostic tests and drug therapy. The pooled results were calculated according to the respective incidence rates. Diarrhoea and hyperbilirubinemia costs were derived from the costs for diagnostic tests and treatment, as indicated by clinical guidelines. Just as for CHD, the CKD cost was similarly calculated according to severity and weighted with respective incidence rates [13,20]. Besides hospital admissions, diagnostics, specialist visits, and chronic drug treatments, the cost estimate included the likelihood of a more invasive and expensive therapy such as dialysis. Table 3 reports the costs of treatment and adverse events per health state. For all events, the same cost was considered for each health state, whereas the treatment costs differed between treatment arms and health states.
The second-line treatment costs were calculated using the same method. All other treatment options recommended by the Italian guidelines were compared with the rate of use observed in the reference cohort.
Health-Related Quality of Life
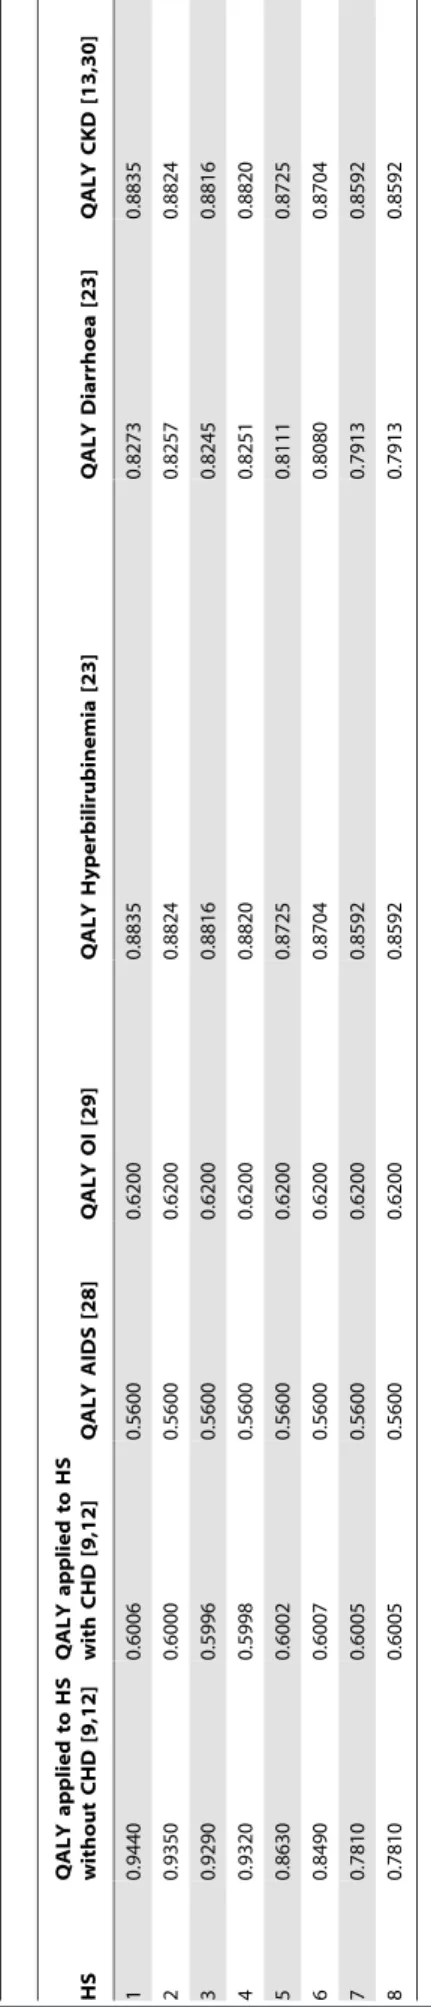
The model utilities (Table 4) were not related to treatment regimens, but instead to the health state specific for progression of disease. Since QALY data for the Italian HIV-positive population are not currently available in the literature, published data on the U.S. HIV-infected population were used [7], categorizing the patients in eight health states, as suggested by Broder et al. [12].
In our model, CHD events led to a 40% decrease in the quality of life (QoL), as reported in Castiel et al. [22], whereas in the microsimulation model, the QoL worsened progressively from health state 1 to 8; in the second-line treatment the same QALY of health states 7 and 8 was assigned to each health state.
Diarrhoea and hyperbilirubinemia utility values associated with events were selected by analysing the literature [23–25] and by applying the Delphi technique [26–27]. This involved ten
Table 4. QALY variables related to HS, and events entered in the microsimulation model. HS QALY applied to HS without CHD [9,12] QALY applied to HS with CHD [9,12] QALY AIDS [28] QALY OI [29] QALY Hyperbilirubinemia [23] QALY Diarrhoea [23] QALY CKD [13,30] 1 0.9440 0.6006 0.5600 0 .6200 0 .8835 0.8273 0.8835 2 0.9350 0.6000 0.5600 0 .6200 0 .8824 0.8257 0.8824 3 0.9290 0.5996 0.5600 0 .6200 0 .8816 0.8245 0.8816 4 0.9320 0.5998 0.5600 0 .6200 0 .8820 0.8251 0.8820 5 0.8630 0.6002 0.5600 0 .6200 0 .8725 0.8111 0.8725 6 0.8490 0.6007 0.5600 0 .6200 0 .8704 0.8080 0.8704 7 0.7810 0.6005 0.5600 0 .6200 0 .8592 0.7913 0.8592 8 0.7810 0.6005 0.5600 0 .6200 0 .8592 0.7913 0.8592 HS: Health state; QALY: Quality-adjusted life years; CHD: Coronary heart disease; CKD: Chronic kidney d isease; OI Opportunistic infection doi:10.1371/journal.pone. 0057777.t004
Table 3.Costs of treatments and adverse events in euro for each Health State.
LPV/r ATV+r 1 and 2
Health State
1 J11,423.24 J11,439.40
2 J11,563.34 J11,579.48
3 J11,621.42 J11,637.56
4 J11,575.64 J11,591.78
5 J11,837.66 J11,853.80
6 J11,753.78 J11,769.94
7 J11,895.84 J11,912.00
8 J11,409.78 J11,425.94
AIDS event J4,684.00
Coronary Heart Disease J1,354.07
Opportunistic Infection J2,110.69
Hyperbilirubinemia J27.61
Diarrhoea J50.82
Chronic Kidney Disease J1,185.36
infectious disease specialists working in the Lombardy Regional Healthcare Service. A questionnaire, starting with open questions and ending with closed questions, was successively administered to the experts to determine, starting from the utility values reported in the literature, which value should be associated to each event. The same methodology was used to determine the utilities due to AIDS events [28], OIs [29], and CKD [30].
Mortality
The mortality rate of the HIV-infected population was derived from the mortality rate reported for the general Italian population [31], stratified by age and gender, and adjusted for major risk associated with HIV seropositivity, using the mortality rate ratio (MRR) reported for the European HIV-infected population [32].
Sensitivity Analysis
A probabilistic sensitivity analysis was performed for both scenarios (LPV/r vs. ATV+r 1 and LPV/r vs. ATV+r 2) by varying the probability values of a CHD event being fatal; CKD, OIs, diarrhoea and hyperbilirubinemia rates; effect of treatments on TC:HDL ratio (ranges to cover up to 10-fold change from base case, as reported in Broder et al., 2011 [12]); utility values associated with health state, CHD events, diarrhoea, hyperbiliru-binemia, CKD, AIDS events, and OIs; cost values of health state,
CHD events, CKD, OIs; and the transition probabilities for ATV+r 2 (Table 5).
A total of 200 microsimulations were generated for each analysis, each populated with 5,000 individuals.
Results
In this section the results of the two analyses are presented separately, both LPV/r vs. ATV+r 1, based on real life data, and LPV/r vs. ATV+r 2, where the efficacy of ATV+r 2 arm is calculated as a differential value, as reported in the CASTLE study.
LPV/r vs. ATV+r 1
QALY values were calculated by reprocessing the data obtained from several sources, as described in the Methods section. Whilst AIDS and OI QALY did not vary across health states, QALY values steadily decreased across the health states for CHD, AEs, and CKD (Table 4). When these results were included in the model, the scenarios showed an average survival, in years, of 24.061 for the LPV/r arm and 24.081 for ATV+r 1 (Table 6).
The mean QALYs were higher in the LPV/r arm than in the ATV+r 1 (13.322 vs. 13.060), with a gain of 0.262.
The results showed a similar incidence of cardiovascular events in the LPV/r and ATV+1 arms (6.6 cases per 1,000 patient years
Table 5.Parameters used within the sensitivity analysis performed.
Parameter Range for sensitivity analysis* Reference
Risk of CHD event being fatal Uniform (0.254, 0.454) [12]
Diarrhoea risk{ Beta (8, 448) Study database
Hyperbilirubinemia risk{ Beta (3, 189) Study database
CKD risk Uniform (610% of base-case value) Expert opinion
OIs risk{ Beta (11, 637) Study database
Effect of treatment on TC:HDL ratio [12]
LPV/r Normal (–0.17, 1.56)
ATV+r (1 & 2) Normal (–0.40, 2.82)
Effect of treatment on transition to HS with VL$50 copies/mL Expert opinion
LPV/r / ATV+r 1 Not Applicable
ATV+r 2 Uniform (–0.29, –0.09)
HS QALY weight Uniform (65% of base-case value) Expert opinion
CHD QALY weight Uniform (610% of base-case value) Expert opinion
Diarrhoea QALY weight Uniform (610% of base-case value) Expert opinion
Health state QALY weight Uniform (610% of base-case value) Expert opinion
Hyperbilirubinemia QALY weight Uniform (610% of base-case value) Expert opinion
CKD QALY weight Uniform (610% of base-case value) Expert opinion
AIDS QALY weight Uniform (610% of base-case value) Expert opinion
OI QALY weight Uniform (610% of base-case value) Expert opinion
HS cost (first and second line) Uniform (63% of base-case value) Study database
CHD cost Uniform (620% of base-case value) Study database
CKD cost Uniform (65% of base-case value) Study database
OI cost Uniform (610% of base-case value) Study database
CHD: Coronary heart disease; CKD: Chronic kidney disease; OI: Opportunistic infection; TC: Total cholesterol; HDL: High-density lipoprotein; HS: Health state; QALY: Quality-adjusted life years.
*Ranges are: minimum and maximum or percentage variation of base-case values for uniform distributions; mean and standard deviation for normal distributions; alpha and beta are shape parameters for beta distributions.
{
vs. 6.5 per 1,000 patient years). The incidence of CKD was lower in the LPV/r arm than in the ATV+r 1 arm (27.1 cases vs. 110.9 per 1,000 patient years).
There was a higher incidence of drug-related adverse events among the patients receiving LPV/r than among those in the ATV+r 1 arm (17.7 vs. around 14.1 per 1,000 patient years).
Although the use of LPV/r showed an advantage in terms of costs, the economic weight of kidney-related events had a significant impact on the final results, leading to an advantage for the use of LPV/r, with a lower rate of CKD events among the patients receiving LPV/r than among those in the ATV+r 1 arm. However, a higher rate of CHD events was observed in the patients receiving LPV/r than in those in the ATV+r 1 arm.
The annual cost analysis showed nearly complete overlapping of the economic performance of the two treatments: the LPV/r arm had a per capita annual advantage ofJ148 in comparison with
the ATV+r 1 arm. In addition, the cost-utility values (J15,310.56
for LPV/r;J15,902.99 for ATV+r 1) confirmed an advantage in
the use of the LPV/r regimen.
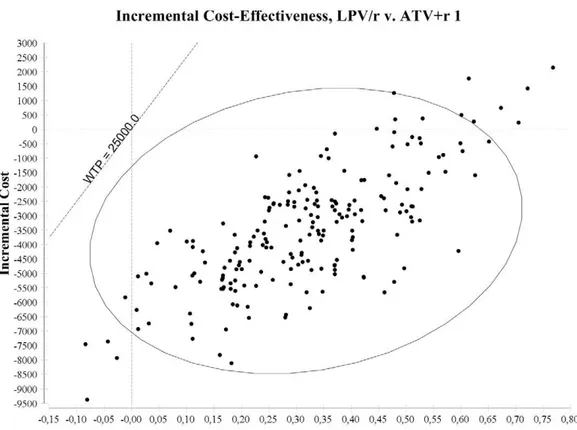
Figure 2 reports the results of the probabilistic sensitivity analysis for LPV/r vs. ATV+r 1. Considering a J25,000
willingness to pay threshold [33], the LPV/r regimen had a lower cost and higher effectiveness, being the dominant alternative, in 92.0% of the simulations, higher effectiveness and cost with an incremental cost-effectiveness ratio (ICER) ,25,000 in 5.5% of the simulations, and lower effectiveness and cost with an ICER
.25,000 in 2.5% of the simulations, being cost effective at a
J25,000 per QALY willingness to pay in 97.5% of the
simulations.
LPV/r vs. ATV+r 2
The average survival of patients receiving ATV+r 2 was 24.084 years (Table 6), almost identical to that noted for the LPV/ r arm. The mean QALYs were slightly higher in LPV/r arm than in the ATV+r 2 arm, with a 0.061 gain (13.322 vs. 13.261).
A marginally higher incidence of cardiovascular events was associated with LPV/r in comparison with ATV+r 2 (6.6 vs. 6.4 cases per 1,000 patient years), with a lower incidence of CKD (27.1 vs. 135.3 cases per 1,000 patient years), and a higher incidence of drug-related adverse events (17.7 vs. 16.9 per 1,000 patient years).
The ATV+r 2 arm was more cost advantageous in the shorter time period, i.e., projections of up to 20 years, while LPV/r showed an advantage in the lifetime analysis. The annual cost showed a slight advantage for LPV/r, with a cost-utility value of
J15,310.56 for LPV/r andJ15,524.85 for ATV+r 2, respectively.
Figure 3 reports the results of the sensitivity analysis of LPV/r vs. ATV+r 2. LPV/r had lower costs and higher effectiveness, being the dominant alternative, in 61.0% of the simulations, higher effectiveness and costs with an ICER,J25,000 in 15.0%
of the simulations, lower effectiveness and cost with an ICER
,J25,000 in 5.0% of the simulations, and lower effectiveness and
higher cost with an ICER.J25,000 in 19.0% of the simulations,
being cost effective atJ25,000 per QALY willingness to pay in
81.0% of the simulations.
Discussion
In both analyses (LPV/r vs. ATV+r 1 and LPV/r vs. ATV+r 2), LPV/r is dominant compared to ATV+r, resulting in a lower lifetime cost and in a higher utility value.
This Markov model was based on regional and national data. Its potential is a closer alignment of the results to specific regional or country-based protocols and costs, with greater usability from a payer’s perspective for decision-making processes. The clinical results are consistent with previous data on ATV and LPV [10– 12]. In addition, the new information gained by including CKD in the computations builds on current cost-utility analyses in this field.
Since the objective of this analysis was to provide Italian policy makers with information cogent to occurring events of the
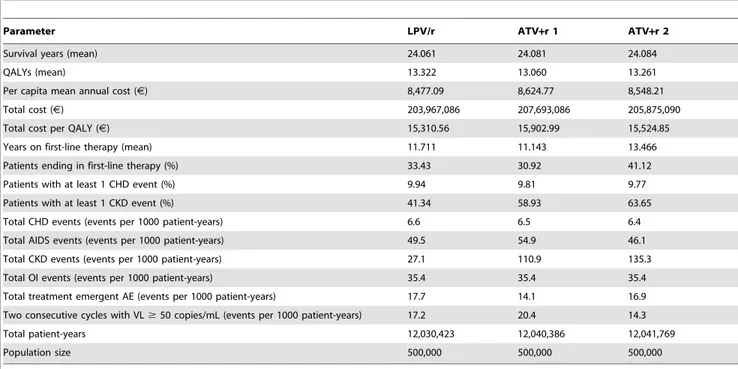
Table 6.Lifetime results of the model divided per treatment.
Parameter LPV/r ATV+r 1 ATV+r 2
Survival years (mean) 24.061 24.081 24.084
QALYs (mean) 13.322 13.060 13.261
Per capita mean annual cost (J) 8,477.09 8,624.77 8,548.21
Total cost (J) 203,967,086 207,693,086 205,875,090
Total cost per QALY (J) 15,310.56 15,902.99 15,524.85
Years on first-line therapy (mean) 11.711 11.143 13.466
Patients ending in first-line therapy (%) 33.43 30.92 41.12
Patients with at least 1 CHD event (%) 9.94 9.81 9.77
Patients with at least 1 CKD event (%) 41.34 58.93 63.65
Total CHD events (events per 1000 patient-years) 6.6 6.5 6.4
Total AIDS events (events per 1000 patient-years) 49.5 54.9 46.1
Total CKD events (events per 1000 patient-years) 27.1 110.9 135.3
Total OI events (events per 1000 patient-years) 35.4 35.4 35.4
Total treatment emergent AE (events per 1000 patient-years) 17.7 14.1 16.9
Two consecutive cycles with VL$50 copies/mL (events per 1000 patient-years) 17.2 20.4 14.3
Total patient-years 12,030,423 12,040,386 12,041,769
Population size 500,000 500,000 500,000
Figure 3. Incremental cost effectiveness ratio plan, presenting the results of the probabilistic sensitivity analysis of LPV/r vs. ATV+r 2 regimens.
doi:10.1371/journal.pone.0057777.g003
Figure 2. Incremental cost effectiveness ratio plan, presenting the results of the probabilistic sensitivity analysis of LPV/r vs. ATV+r 1 regimens.
surveyed area, the cost data are based on a specific national analysis rather than on international assessments that do not take into account the clinical practice protocols currently in use. As such, it gives a fairly accurate picture of what is now happening in Lombardy (Italy’s most populous region, with more than 15% of the total population) [34].
Although the sample is restricted to Lombardy, the guidelines for the management of HIV-infected patients are national. Furthermore, the Italian NHS is based on a regional reimburse-ment system, with no significant differences among the country’s regions; therefore, the sensitivity analysis could cover these differences, providing useful information to policy makers in any region.
Using a patient-based methodology it is possible to follow the diagnostic and care pathway of patients and understand their actual consumption of resources. This makes the results of the cost analysis even more relevant, moreover, unlike a theoretical value, cost data were affected by the compliance of patients.
The main limitation of the study is the low number of patients enrolled in the ATV+r arm, primarily because ATV+r became available after LPV/r. This limitation was overcome by using a second ATV+r arm that took into account (as in Broder et al. [12]) a lesser probability of transitioning to a state with a greater viral load than the LPV/r arm, therefore more consistent with the CASTLE trial results and providing the possibility to verify the robustness of the results. A second limitation of the study was that some assumptions cannot be based on Italian data. For example, there is a lack of information about QALYs in the Italian HIV-infected population.
The MRRs were calculated by adjusting the mortality data for the general Italian population for major risks linked to HIV infection, and derived from a European HIV-infected population, as reported by Obel et al. [32]. Their study was selected because the distribution of risk factors was similar to our study sample for gender, risk factors for HIV acquisition, and hepatitis C virus co-infection. The MRRs were not the actual MRRs of the Italian HIV-infected positive population, however.
The model was innovative in that it included CKD events, a variable not considered in previous studies for a cost-utility analysis. Such events, due to their high probability to occur, can significantly influence the results, when compared with similar published studies on the economic impact of the two treatment regimens. The results of the study presented, however, are consistent with data from the EuroSIDA study [13]. Moreover, unlike previously published models, where second-line treatment was simulated at the cohort level by employing a deterministic
methodology, our model extends the simulation at individual patient level to second-line treatment, thus enhancing the realism of the analysis.
CKD events had an impact on costs and on QALYs but not on mortality rate. As CKD is a chronic degenerative condition, it incurs more costs and diminishes the patient’s quality of life.
There is a growing body of literature on CKD and HAART in HIV infection. A 2012 study [6] reviewed the literature on the incidence of CKD, in particular in patients receiving ATV. In order to analyse what impact this would have on the model, specific Italian-based studies will need to be implemented to single out the side effects of tenofovir and ATV.
In our sample, the distribution rate of AIDS, which reflects the frequency of event occurrence, was in line with the principal literature.
Despite the substantial overlap of the results for the different populations studied and the assessment methods used, albeit more conservative and closer to real life, the combination of cost data with utilities data shows a dominance of LPV treatment compared with ATV. Hence, LPV treatment being less expensive and more effective, it was not necessary to calculate the ICER.
The results of the present study underline the importance of collecting real-life data, which may differ from those reported in a RCT, in order to support decision makers in the Italian NHS and other health services as they contend with dwindling resources.
Also, the study results demonstrate the importance of ensuring the clinical quality of inputs into a model where the use of theoretical assumptions, not tested in clinical practice, might produce unreliable data for clinicians.
Undoubtedly, RCTs furnish an important and irreplaceable source of information on treatment efficacy; nonetheless, obser-vational studies based on regional or national real-life clinical and economic data, are also essential to evaluate the real impact of treatments (as underlined by agencies worldwide [35]) and to take decisions at the regulatory level.
Acknowledgments
The Authors wish to thank the Lombardy Region Health General Directorate for providing anonymous cost data for this study.
Author Contributions
Critical revision of the article: GR FS DC. Conceived and designed the experiments: EF PB GR EB ER EP DC. Performed the experiments: EF EB UR FS. Analyzed the data: EF PB GR UR ER EP FS DC. Wrote the paper: EF PB EB UR ER EP.
References
1. Buxton MJ, Drummond MF, Van Hout BA, Prince RL, Sheldon TA, et al. (1997) Modelling in economic evaluation: an unavoidable fact of life. Health Econ 6: 217–27.
2. Sculpher MJ, Pang FS, Manca A, Drummond MF, Golder S, et al. (2004) Generalisability in economic evaluation studies in health care: a review and case-studies. Health Technol Assess 8: 1–20.
3. Goeree R, Burke B, Manca A, Sculpher MJ, Willan AR, et al. (2005) Generalizability of economic evaluations: using results from other geographic areas or from multinational trials to help inform health care decision making in Canada. Report No.: Grant N. 67. CCOHTA HTA Capacity Building Grants Program. Toronto: Canadian Coordinating Office for Health Technology Assessment.
4. O’Brien BJ (1997) A tale of two (or more) cities: geographic transferability of pharmacoeconomic data. Am J Manage Care 3: S33–39.
5. Manca A, Willian AR (2006) ‘Lost in Translation’. Accounting for between country differences in the analysis of multinational cost-effectiveness data, Pharmacoeconomics 24(11): 1101–19.
6. Young J, Schafer J, Fux CA, Furrer H, Bernasconi E, et al. (2012) Renal function in patients with HIV starting therapy with tenofovir and either efavirenz, lopinavir or atazanavir, AIDS 26: 567–575.
7. Simpson KN, Luo MP, Chumney E, Sun E, Brun S, et al. (2004) Cost-effectiveness of lopinavir/ritonavir versus nelfinavir as the first-line highly active antiretroviral therapy regimen for HIV infection. HIV Clin Trials 5(5): 294–304. 8. Simpson KN, Luo MP, Chumney EC, King MS, Brun S (2007) Cost effectiveness of lopinavir/ritonavir compared with atazanavir in antiretroviral-naive patients: modelling the combined effects of HIV and heart disease. Clin Drug Investig 27(1): 67–74.
9. Simpson KN, Jones WJ, Rajagopalan R, Dietz B (2007) Cost effectiveness of lopinavir/ritonavir tablets compared with atazanavir plus ritonavir in antiret-roviral-experienced patients in the UK, France, Italy and Spain. Clinical Drug Investig 27(12): 807–17.
10. Simpson KN, Rajagoplan R, Dietz B (2009) Cost-effectiveness analysis of lopinavir/ritonavir and atazanavir+ritonavir regimens in the CASTLE study. Adv Ther 26(2): 185–93.
12. Broder MS, Chang EY, Bentley TG, Juday T, Uy J (2011) Cost effectiveness of atazanavir-ritonavir versus lopinavir-ritonavir in treatment-naive human immunodeficiency virus-infected patients in the United States. J Med Econ 14(2): 167–78.
13. Mocroft A, Kirk O, Reiss P, De Wit S, Sedlacek D, et al. (2010) Estimated glomerular filtration rate, chronic kidney disease and antiretroviral drug use in HIV-positive patients. J Acquir Immune Defic Syndr 24: 1667–78.
14. Rizzardini G, Restelli U, Porazzi E, Ricci E, Casartelli L, et al. (2011) The Cost Of Hiv Disease In Northern Italy: The Payer’s Perspective. J Acquir Immune Defic Syndr 57: 211–7.
15. Italian Ministry of Health (2010) Linee Guida Italiane sull’utilizzo dei farmaci antiretrovirali e sulla gestione diagnostico-clinica delle persone con infezione da HIV-1.
16. Drummond MF, Sculpher MJ, Torrance GW, O’Brien BJ, Stoddart GL (1997) Methods for the economic evaluation of health care programmes. Oxford: Oxford university press.
17. Worm SW, De Wit S, Weber R, Sabin CA, Reiss P, et al., (2009) Diabetes mellitus, preexisting coronary heart disease, and the risk of subsequent coronary heart disease events in patients infected with human immunodeficiency virus: the Data Collection on Adverse Events of Anti-HIV Drugs (D:A:D Study). Circulation 199:805–11.
18. Molina JM, Andrade-Villanueva J, Echevarria J, Chetchotisakd P, Corral J, et al. (2008) Once-daily atazanavir/ritonavir versus twice-daily lopinavir/ritonavir, each in combination with tenofovir and emtricitabine, for management of antiretroviral-naive HIV-1-infected patients: 48 week efficacy and safety results of the CASTLE study. Lancet 372(9639): 646–55.
19. American Heart Association. Heart Disease and Stroke Statistics – 2009 Update. Dallas, Texas: American Heart Association; 2009.
20. Decreto Direttore Generale 18 luglio 2005 – n.11275. Approvazione del documento ‘‘Prevenzione, diagnosi e trattamento dell’insufficienza renale in Lombardia’’. Bollettino Ufficiale Regione Lombardia, Milano – Giovedı` 22 settembre 2005, 2uSupplemento Straordinario.
21. Decreto Direttore Generale 5 agosto 2011 – n.7485. Approvazione del documento avente ad oggetto ‘‘Percorso diagnostic terapeutico (PDT) del paziente affetto da malattia HIV/AIDS’’. Bollettino Ufficiale Regione Lombardia, Serie Ordinaria – Venerdı` 19 agosto 2011.
22. Castiel D, Herve´ C, Gaillard M, Bollaert JL, Soula M (1992) Cost-utility analysis of early thrombolitic therapy. Pharmacoeconomics 1(6): 438–42.
23. Van Praag BMS, Ferrer-i-Carbonell A (2001) Age Differentiated QALY Losses, IZA Discussion Paper N.314.
24. Whitehead WE, Burnett CK, Cook 3rd EW, Taub E (1996) Impact of irritable bowel syndrome on quality of life. Dig Dis Sci 41(11): 2248–53.
25. Creed F, Ratcliffe J, Fernandez L, Tomenson B, Palmer S, et al. (2001) Health-related quality of life and health care costs in severe, refractory irritable bowel syndrome. Ann Intern Med 134(9 Pt 2): 860–8.
26. Quinn Patton M (2002) Qualitative research & evaluation methods. Thousand Oaks: Sage Publications.
27. Bowles H (1999) The Delphi technique. Nurs Stand 13(45): 32–6.
28. Freedberg KA, Scharfstein JA, Seage III GR, Losina E, Weinstein MC, et al. (1998) The cost-effectiveness of preventing AIDS-related opportunistic infec-tions. JAMA 279(2): 130–6.
29. Rose DN (1998) Short-course prophylaxis against tuberculosis in HIV-infected persons. A decision and cost-effectiveness analysis. Ann Intern Med 129(10): 779–86.
30. Fukui T, Iwamoto Y (2003) Medical Spending and the Health Outcome of the Japanese Population. International Forum for Macroeconomic Issues. 31. ISTAT. Demografia in cifre. Available from: URL: http://demo.istat.it/index.
html.
32. Obel N, Omlad LH, Kronborg G, Larsen CS, Pedersen C, et al. (2011) Impact of non-HIV and HIV risk factors on survival in HIV-infected patients on HAART: a population-based nationwide cohort study. PLoS One 6(7): e22698. 33. McCabe C, Claxton K, Culyer A (2008) The NICE Cost-effectiveness Threshold. What it is and What that means. Pharmacoeconomics 26(9):733– 744.
34. ISTAT, Istituto Nazionale di Statistica. Demographic statistics at www.demo. istat.it (last accessed 23 March 2012).