ISSN 1546-9239
© 2008 Science Publications
Corresponding Author: Howaida El-Kashlan, Physics and Chemistry Department, Faculty of Education, University of
Kinetic Study of the Effect of Selected Surfactants on Corrosion of Copper
Howaida M. El-Kashlan
Physics and Chemistry Department, Faculty of Education, Alexandria University, Alex, Egypt
Abstract: The rates of copper corrosion were determined by measuring the limiting current of anodic dissolution of copper in phosphoric acid in presence and in absence of cetyl trimethyl ammonium bromide (CTAB) and cetyl pyridinium bromide (CPYB). The rate of corrosion is found to decrease by increasing the concentration of the surfactant. The percentage of inhibition ranged from 1.85 to 33.97% depending on the type of surfactant and its concentration. Increasing the copper electrode height, and concentration of H3PO4 decreases the rate of copper corrosion. The investigated adsorption
isotherms indicate that the two surfactants fit Langmuir and Flory Huggins isotherm. The thermodynamic parameters show that corrosion is a diffusion controlled process. The dimensional analysis method was used to obtain the overall mass transfer correlations under the study conditions.
Keywords: corrosion, surface active substance, ammonium salts, mass transfer in electrolysis.
INTRODUCTION
Copper is one of the preferred metals in industry owing to its excellent electrical and thermal conductivities, good mechanical workability and its relatively noble properties [1-3]. Corrosion inhibition of copper in a wide variety of media has attracted the attention of a number of investigators [4-8]. In general, the adsorption of an inhibitor on a metal surface depends on the nature and the surface charge of the metal, the adsorption mode, its chemical structure, and the type of the electrolyte solution [9]. It has been accepted that the corrosion inhibition process results from the formation of organic inhibitor films on the metal surface [10]. The anodic dissolution of copper in organic solvent environments is influenced by its concentration [11]. In the present work, a study of the inhibiting effect of some inhibitors in case of copper corrosion in different concentrations of phosphoric acid solution was carried out. The aim is to discuss the mechanism of protection given by these organic additives as CPYB and CTAB on the electro-dissolution of copper in H3PO4 and the factors that
affect corrosion process.
MATERIALS AND METHODS
All of the reagents and chemicals were of analytical grade and used without further purification. Double distilled de-ionized water was used in the preparation of solutions.
The cell used in the present work consists of rectangular container having the dimensions of 5 x 5x 10 cm with electrodes fitting the whole cross section. The electrodes were rectangular copper sheets of 10 cm height and 5cm width. Electrode separation was 5 cm; a porous PVC diaphragm was used to prevent the stirring effect due to H2 bubbling. The electric circuit consisted
as the drive shaft are insulated by epoxy resin. The cathode is made of cylindrical copper electrode of 12 cm diameter. It also acts as a reference electrode because its surface area is very large compared to that of the anode.
RESULTS AND DISCUSSION
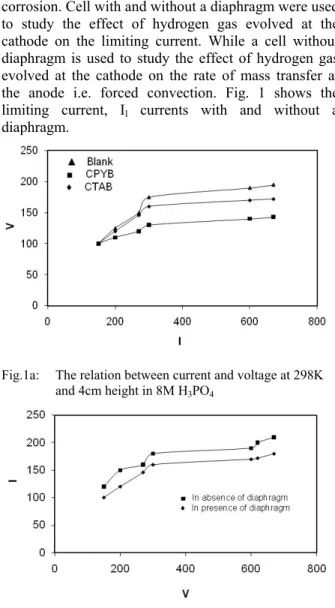
Leveling is the principle process in electropolishing [12] and can be explained in terms of mass transfer mechanism [13]. The study of leveling is based on the classical current voltage curves of corrosion. Cell with and without a diaphragm were used to study the effect of hydrogen gas evolved at the cathode on the limiting current. While a cell without diaphragm is used to study the effect of hydrogen gas evolved at the cathode on the rate of mass transfer at the anode i.e. forced convection. Fig. 1 shows the limiting current, Il currents with and without a
diaphragm.
Fig.1a: The relation between current and voltage at 298K and 4cm height in 8M H3PO4
Fig. 1b: The relation between current and voltage at 298K and 4cm height, 8 M H3PO4 in absence and
presence of diaphragm
Effect of electrolyte concentration on the polishing current: Fig. 2 shows the dependence of the polishing current on the bulk concentration of phosphoric acid. The limiting current density decreases with the increase of phosphoric acid concentration but the values of limiting current in acid-additives mixtures is less than in water-acid mixtures. This is in agreement with the finding of other authors who worked within the same range of concentration using other anode geometries [14-
16]
. From the practical point of view, we can recommend on the basis of above result that it is preferable to use relatively high organic additives percentage to inhibit polishing or dissolution of metal at the same phosphoric acid concentration.
Fig. 2: The relation between log Il and phosphoric acid
concentration at 298K
The decrease in the limiting current with increasing H3PO4 concentration is attributed to two effects:
1. The solubility of the dissolved copper phosphate in H3PO4, which makes the onset of the limiting current,
decreases with increasing H3PO4 concentration.
2. The viscosity of the solution increases with increasing H3PO4 concentration with consequence
decrease in the diffusivity of Cu2+ according to Stokes-Einstein equation:
D /T = constant (1)
where D = diffusivity of Cu2+ in cm2s-1, = viscosity of solution in poise, T = absolute temperature and ν = /ρ (where ν is the kinematic viscosity in stoke and ρ is density in gm cm-3).
Also, the increase in solution viscosity with increasing phosphoric acid concentration results in an increase in the diffusion layer thickness which represents the resistance to the rate of mass transfer of Cu2+ from anode surface to bulk solution.
additives-water- H3PO4 mixture is higher than for
water- H3PO4 mixture and this led to:
1. Decrease in diffusivity of Cu2+.
2. The solubility of copper phosphate in this solvent is lower than in water phosphoric acid medium so saturation of solution is attained quickly and the limiting current is small.
Fig. 3: The relation between Il and height of electrode at
298K and 8MH3PO4
Table 1: Effect of different height of copper electrode on limiting current (mA) in presence of organic substances (C=11x10-4 mol l-1 at 298K and 12M H3PO4)
h cm Il blank Il /A
blank
Il /A
CPYB
Il/A
CTAB 1
2 3 4 5 6
170 150 180 210 260 280
30 15 12 10.5 10.4 9.33
26 11 9 8 7 6.5
28 13 10 9 8.5 7.5
Effect of electrode height on polishing current: Table 1 and Fig. 3 show that the limiting current density decreases with the increase in height. In electropolishing and generally for anodic dissolution of metals, the direction of flow of the hydrodynamic boundary layer and the diffusion layer increases in the downward direction. Accordingly, the local limiting current density increases in the upward direction of the anode. This explains why polishing is attained at the upper parts of the electrode before the lower part at the limiting current region. This was confirmed by the visual observation during electropolishing. The average limiting current density decreases with the increase in the height according to the equation:
a
(H) C l
I = (2)
where C is constant, H is the height, a is constant depends on type of solution used, where a = 0.31 for 8 M H3PO4 as example.
Effect of organic additives concentrations: If the
limiting current in the absence of SAS is (Il) and in the
presence of SAS is (I), the percentage inhibition can be calculated from:
l I
I l I inhibition %
−
= X 100 (3)
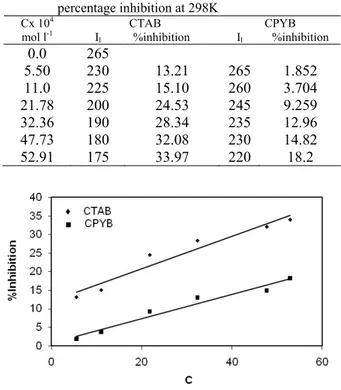
Table 2: Effect of concentration of organic additives on the percentage inhibition at 298K
CTAB CPYB Cx 104
mol l-1 Il %inhibition Il %inhibition 0.0
5.50 11.0 21.78 32.36 47.73 52.91
265 230 225 200 190 180 175
13.21 15.10 24.53 28.34 32.08 33.97
265 260 245 235 230 220
1.852 3.704 9.259 12.96 14.82 18.2
Fig. 4: The relation between percentage inhibition and concentration at 298K
Table (2) and Fig. (4) show that % inhibition depends on the type of SAS and its concentration. The values are ranged from 13.21% to 33.97 % depending on the type of SAS and its concentration. From table (1) and Fig. (3), the order of increasing the rate of corrosion is as follow:
CTAB > CPYB
Fig. 3 shows that as T increases the rate of the corrosion increases. Cationic SAS adsorbed strongly on the surface of copper metal. The above results are discussed as:
adsorption of SAS on copper surface depends mainly on its structure.
2. The decrease in the diffusion coefficient (D) of Cu2+ ion solutions containing surfactants which is due to the increase in the interfacial viscosity ( ) is in accordance with Stokes-Einstein equation as shown in table (8). The increase in interfacial viscosity in table (8) is caused by the adsorption of surfactant molecules at the copper surface with their polar end direction towards the solution and the non polar end directed to the copper surface. The present results agree with polarographic studies conducted in solutions containing surfactants where it was found that the diffusion current decreases in the presence of surfactants.
3. SAS not only decrease the limiting current through lowering surface tension but also through other effects such as adsorption on the cathode surface. The cationic SAS repels from the anode [17, 18].
4. Adsorption of SAS on the Cu-anode may lower the limiting current through increasing the interfacial viscosity owing to displacement of adsorbed H2O
molecules on the Cu-surface by surfactant molecules which is supported by adsorption isotherm.
Adsorption isotherm: The value of (∆Il) (the decrease
of the limiting current with respect to the Il value in
absence of SAS) at a given concentration was determined and the degree of surface coverage was calculated by the relation:
l I
I -l I
= (4)
The adsorption of SAS was found to obey a Langmuir isotherm which is given by equation (5):
K(C)y 1
=
− (5) or logK y logC
1
log = +
− (6)
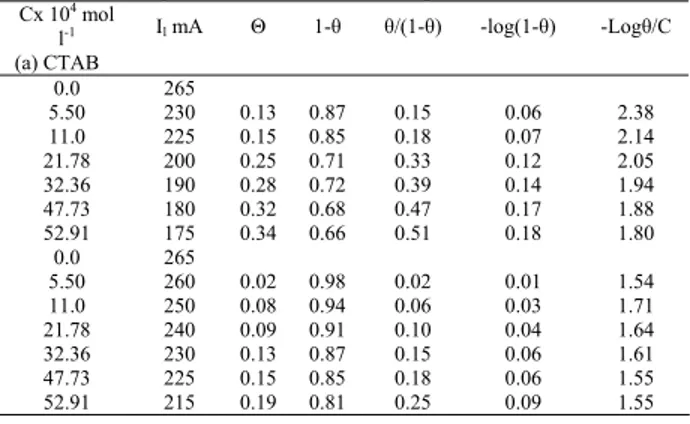
Table 3: Adsorption isotherm data using 8 M H3PO4 at 298K
Cx 104 mol
l-1 Il mA Θ 1- /(1- ) -log(1- ) -Log /C
(a) CTAB 0.0 5.50 11.0 21.78 32.36 47.73 52.91
265 230 225 200 190 180 175
0.13 0.15 0.25 0.28 0.32 0.34
0.87 0.85 0.71 0.72 0.68 0.66
0.15 0.18 0.33 0.39 0.47 0.51
0.06 0.07 0.12 0.14 0.17 0.18
2.38 2.14 2.05 1.94 1.88 1.80 0.0
5.50 11.0 21.78 32.36 47.73 52.91
265 260 250 240 230 225 215
0.02 0.08 0.09 0.13 0.15 0.19
0.98 0.94 0.91 0.87 0.85 0.81
0.02 0.06 0.10 0.15 0.18 0.25
0.01 0.03 0.04 0.06 0.06 0.09
1.54 1.71 1.64 1.61 1.55 1.55
Table 3 shows adsorption isotherm data using 8 M H3PO4 at 298K. A plot of ( /1- ) vs. C would give a
straight line for both organic additives as in figure (5) indicating that the inhibitor verifies Langmuir adsorption isotherm. Fig. (6) shows the Flory Huggins adsorption isotherm plotted as log /C vs. log (1- ) yielded straight line with slope x and intercept log xk. The experimental data fits Flory Huggins adsorption isotherm which is represented by equation
logxk log(1 ) C
log = + − (7)
where x is the number of water molecules replaced by one molecule of inhibitor.
The free energy of adsorption ∆Gads was calculated from the equation
∆Gads = - RTln (55.5k) (8) The values of ∆Gads are given in table (4). ∆Gads values are negative and lie in range 19.24 to 20.97. The most efficient inhibitor shows the most negative ∆Gads. This suggests that they are strongly adsorbed on metal surface. The negative values ∆Gads indicate the spontaneous adsorption of inhibitors. This is usually characteristic of strong interaction with metal surface. It is found that ∆Gads are more positive than 46 KJ/mol indicating that inhibitors are physically adsorped on metal surface. Similar results have also been reported[19].
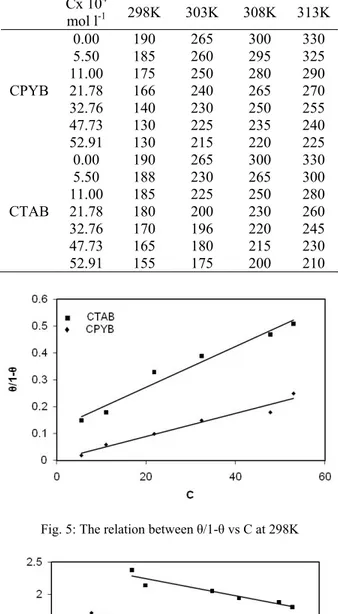
Effect of temperature: The corrosion of copper in
phosphoric acid in the presence of inhibitors was studied by measuring the limiting current over the temperature range 298-313K. The data is shown in Table (5). It is found that the rate of copper corrosion increases as temperature increases. Table (6) shows the values of Ea obtained at different temperatures permitted the calculation of the activation energy Ea according Arrhenius equation:
log I = [-Ea/(2.303RT)] + C (9)
where R is gas constant = 8.32 x 10⁷ erg mole-1 dgree-1 and T is the absolute temperature. Plotting log K vs. 1/T gives a straight line.
The activation energy values are given in table (7). Such values indicate that the presence of inhibitor decreases the activation energy of the reaction.
Table 4: The values of ∆G in case of two inhibitors Organic
compound Langmuir Flory Huggins
-∆G K -∆G X K
Table 5: Limiting current of different organic compounds (mA)
Cx 104
mol l-1 298K 303K 308K 313K
CPYB 0.00 5.50 11.00 21.78 32.76 47.73 52.91
190 185 175 166 140 130 130
265 260 250 240 230 225 215
300 295 280 265 250 235 220
330 325 290 270 255 240 225
CTAB 0.00 5.50 11.00 21.78 32.76 47.73 52.91
190 188 185 180 170 165 155
265 230 225 200 196 180 175
300 265 250 230 220 215 200
330 300 280 260 245 230 210
Fig. 5: The relation between /1- vs C at 298K
Fig 6: The relation between log /C vs log (1- ) at 298K
Thermodynamic treatment of the results: From the
integrated form of Arrhenius equation: ln I = -E/RT + ln A (10)
where I is the limiting current (mA), R is the gas constant (8.314 KJ mole-1), E is the activation energy and A is the frequency factor. The values of E are given in table (6). These values for the enthalpy of activation ∆H*, entropy of activation ∆S* and free energy of activation ∆G* can be obtained by using equations:
∆H* = E – RT (11)
∆S*/R = ln A – ln (BTe/h) (12) ∆G* = ∆H* - T∆S* (13)
Where B is the Boltzmann constant, e is 2.7183, h is Plank's constant. The increase in the heat of adsorption led to an increase in the energy of adsorption forces, however raising of the temperature acts in the reverse direction increasing the kinetic energy of the molecules facilitating desorption (consequently in physical adsorption). In absence of SAS the activation energy = 27 KJ mole-1 which is larger than when SAS is used as an inhibitor. Thus the values of activation energies show that:
1. The rate of corrosion of copper is increased by addition of SAS at temperature above 298K.
2. The adsorption process is physical adsorption. However, the value of ∆E of corrosion reaction is smaller in presence of SAS than in its absence. This is explained by the fact that these compounds partly formed some chemical bond with copper [18], and consequently a part of the electrode remains covered even at higher temperature.
Table (6) shows that the entropy ∆S* posses negative values, indicating a highly ordered organic species in the solution under investigation. These are found to be independent on the type of electrode and the type of SAS.
The variability of ∆H* values and similarities of ∆S* indicate that the mass transfer process is enthalpy and not entropic controlled process.
Effect of rotation: It is found that the limiting current density increases with increasing rpm. This may be attributed to break down a hydrodynamic boundary layer and a diffusion layer is formed. It is, also, observed that the higher the rpm, the higher the solution flow and the thinner the diffusion layer. This gives a higher rate of transfer of copper ions to the metal surface and, consequently, through the porous deposit layer formed on the metal which, in turn, enhances the rate of deposit. The limiting current density increases by increasing the rotation which indicates that corrosion reaction of copper is a diffusion controlled reaction. Table (7) shows the relation between rpm and Il.
Table 6: Thermodynamic parameters for electrodeposition of copper at 298K
Cx 104 mol l-1 Ea
kJmol-1 ∆
H*
kJmol-1 ∆
G* kJmol-1
-∆S* Jmol-1K-1 (a) CTAB 0.0 5.50 11.0 21.78 32.36 47.73 52.91 19.33±0.88 20.230±3.4 18.60±3.88 19.35±3.88 18.942±4.7 16.692±4.75 16.55±3.165 16.852±0.67 17.760±1.39 16.123±3.01 16.870±3.80 16.640±4.70 14.310±4.70 14.08±3.160 59.436±1.76 59.630±6.23 59.720±5.97 59.880±1.75 59.990±2.31 66.092±6.40 66.235±4.21 142.83±2.890 140.45±1.166 146.22±1.912 144.25±1.212 145.99±1.350 153.88±1.530 154.81±1.013 (b) CPYB 0.0 5.50 11.0 21.78 32.36 47.73 52.91 19.331±0.880 20.679±0.976 22.054±1.240 21.174±1.240 24.049±5.460 22.099±6.290 22.510±0.575 11.552±0.870 18.200±0.967 19.575±1.240 18.695±4.140 21.570±4.140 19.620±6.290 20.040±0.560 59.436±1.74 59.520±1.915 59.671±2.46 59.90±8.203 60.128±3.21 60.223±4.20 60.320±5.30 142.83±2.983 138.60±3.180 134.50±4.083 138.189±1.36 129.320±4.20 136.180±3.82 135.114±3.98
Table 7a: Overall mass transfer correlation for CTAB
Temp Rpm U
(cmS-1 )
(ν= /ρ) (cm2
s-1 )
Il
mAm-2 (D)
cm2
s-1 K (mA) Sh Sc Re
298 50 100 200 300 500 2.617 5.233 10.467 15.700 26.167 1.138E-02 1.138E-02 1.138E-02 1.138E-02 1.138E-02 12.73885 14.55869 15.92357 17.28844 18.19836 5.05E-06 3.67E-06 2.49E-06 2.08E-06 1.53E-06 9.67E-02 1.11E-02 1.21E-02 1.31E-02 1.38E-02 1915.98 3014.17 4847.09 6305.10 9014.47 2253.31 3101.75 4560.39 5463.82 7421.11 230.02 460.03 920.07 1380.10 2300.16 303 50 100 200 300 500 2.617 5.233 10.467 15.700 26.167 1.065E-02 1.065E- 02 1.065E-02 1.065E-02 1.065E-02 14.559 15.469 17.288 18.198 19.108 6.07E-06 3.95E-06 2.78E-06 2.21E-06 1.62E-06 1.11E-02 1.17E-02 1.31E-02 1.38E-02 1.45E-02 1821.86 2972.50 4728.71 6247.02 8942.62 1755.80 2696.22 3837.70 4816.42 6566.40 245.6042 491.2083 982.4166 1473.625 2456.042 308 50 100 200 300 500 2.617 5.233 10.467 15.700 26.167 8.96E-03 8.96E-03 8.96 E-03 8.96E-03 8.96E-03 15.924 16.379 17.971 19.563 20.473 6.65E-06 4.12E-06 2.82E-06 2.36E-06 1.72E-06 1.21E-02 1.24E-02 1.36E-02 1.49E-02 1.55E-02 1818.99 3016.37 4842.95 6291.34 9021.06 1348.27 2173.68 3180.73 3795.67 5200.66 291.97 583.93 1167.87 1751.80 2919.67 313 50 100 200 300 500 2.617 5.233 10.467 15.700 26.167 8.93E-03 8.93E- 03 8.93E-03 8.93E- 03 8.93E-03 17.288 18.653 20.018 20.928 22.748 7.51E-06 5.01E-06 3.31E-06 2.61E-06 2.02E-06 1.31E-02 1.42E-02 1.52E-02 1.59E-02 1.73E-02 1747.18 2828.86 45.92.50 6087.86 8565.35 1188.78 1783.92 2698.63 3421.80 4429.18 292.92 585.91 1171.82 1757.73 2929.54
Table 7b: Overall mass transfer correlation for CPYB
Temp Rpm U
(cmS-1 )
(ν= /ρ) (cm2 s-1 ) Il mAm-2 (D) cm2
s-1 K (mA) Sh Sc Re
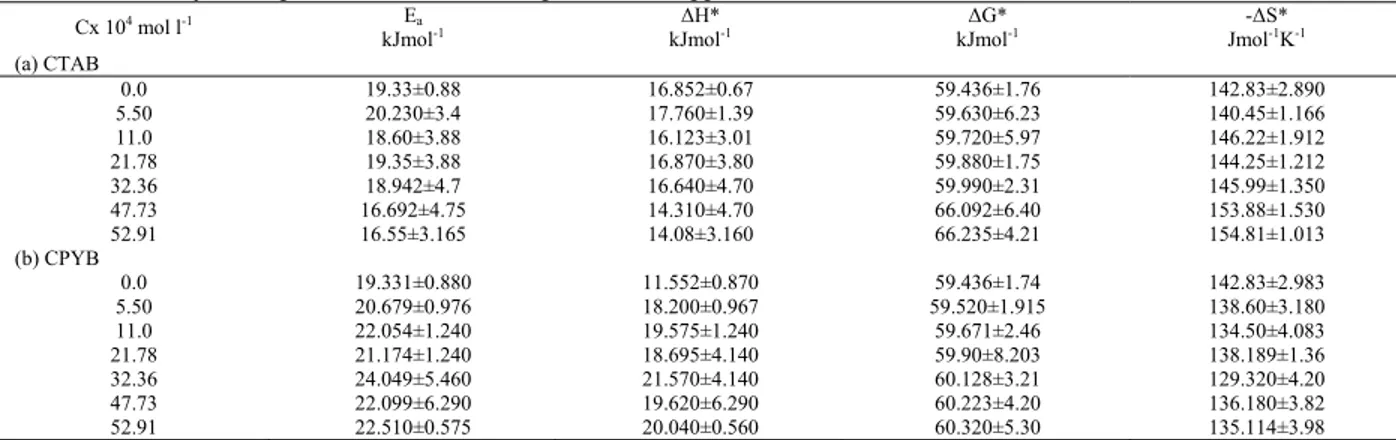
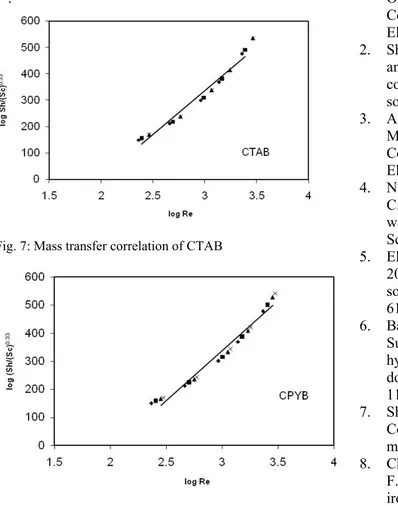
Sh = a Scb Rec (14)
Where Sh, Re and Sc are Sherwood (Sh = kd/D), where k is the mass transfer coefficient k = It/zFCCu2+ where
CCu2+ is the saturation solubility of copper phosphate,
Reynolds (Re = dU/v) and Schmidt (Sc = v/D) numbers respectively and a, b and c are empirical constants, c = 0.33 indicating forced convection [20]. By plotting log Sh/Sc0.33 and log Re, a straight line was obtained; its slope gives constant c and intercept gives the constant a. Figures (7, 8) give the above relations for two substances used. The general equations were
Sh = 9.784 Re0.52 Sc0.33 (15) With average deviation ±1.29% for CTAB
Sh = 9.79 Re0.51 Sc0.33 (16) With average deviation ±2.7% for CPYB
The exponent in the above equation denotes a highly turbulent flow which agrees with the previous mass transfer studies in aqueous media. In our present study forced convection mechanism is obtained, which agree very well with similar relationships reported before
[21-25]
.
Fig. 7: Mass transfer correlation of CTAB
Fig. 8: Mass transfer correlation of CPYB
CONCLUSION
The present study of cupper corrosion in presence of phosphoric acid and surfactants led to the following important conclusions:
1. The rate of copper corrosion decreases by increase of phosphoric acid concentration. The addition of to surfactant acid enhances the decrease.
2. The rate of copper corrosion decreases by the increase of surfactant concentration.
3. The decrease in the copper corrosion depends on the type of surfactant.
4. The rate of copper corrosion decreases by the increase of the height of cupper electrode.
5. The rate of copper corrosion increases by the increase of temperature.
EFERENCES
1. Khaled K. F. and Hackerman N., 2004. Orthosubstituted Anilines to Inhibit Copper Corrosion in Aerated 0.5M Hydrochloric Acid. Electrochimica Acta 49:485-95.
2. Sherif E. M. and Su Moon Park, 2006. Effect of 2-amino-S-ethylthio1, 3, 4 thiadiazole on copper corrosion inhibitor in aerated acidic pickling solution. Electrochemica Acta 51, 6556-6562. 3. Ahmed A. M., Salah M. Abd El Haleem, Darweesh
M. A. and El-nagar A. E., 2003. Corrosion of Copper in presence of Aromatic Acids. Bulletin of Electrochemistry 19, 498-504.
4. Nunez, L. E. Reguera, F. Corvo, E. Gonzales and C. Vazquez, 2005. Corrosion of copper in sea water and its aerosols in a tropical island. Corros. Sci. 47 (2): 461-484.
5. El Warraky, A., H. A. El Shayeb, and E. M. Sherif, 2004. Pitting corrosion of copper in chloride solutions. Anti- Corros. Methods Mater. 51 (1): 52-61.
6. Bastidas, J. M., J. L. Polo and E. Cano, 2000. Substitutional inhibition mechanism of mild steel hydrochloric acid corrosion by hexylamine and dodecylamine. J. Appl. Electrochem. 30 (10): 1173-1177.
7. Shaker M. A. and Abdel-Rahman H. H., 2007. Corrosion of copper metal in presence of binary mixtures. Am. J. Applied Sci. 4(8):554-64.
9. Riggs, O. L., Jr. 1973. Corrosion Inhibitors, 2nd ed., C. C. Nathan, Houston, TX. PP: 7-30.
10. Christy, A. G., A Lowe, V. Otieno-Alego, M. Stoll and R. D. Webster, 2004. Voltammetric and Raman microspectroscopic studies on artificial cooper pits grown in simulated potable water. J. App. Electrochem. 34 (2): 225-233.
11. Bacarella L. and J. C. Griess, 1973. Anodic dissolution of Copper in flowing sodium chloride solution between 25 deg and 175 deg. J. Electrochem. Soc. 120: 459-465.
12. Jenkins, L. H. and R. B. Durham, 1970. Film formation on copper and alpha brass in aqueous cupric-ammonia systems. J. Electrochem. Soc. 117 (6): 768-774.
13. Sedahmed, G. H., M. Z. El-abd, I. A. S. Mansour, A. M. Ahmed and A. A. Wragg, 1979. The role of natural convection mass transfer in the kinetics of electrodeposition of copper of horizontal surfaces. J. Appl. Electrochem. 9 (1):1-6.
14. El-Batouti, M., 1998. Corrosion of copper plates in presence of phosphoric acid-formaldehyde mixtures. Anti- Corros. Methods and Matterials 45 (5): 321-326.
15. Selim, I. Z., A. M. Ahmed, A. E. Khedr and H. M. A. Soliman, 2001. Effect of ethylene glycol addition on copper electrodeposition using rotating cylinder electrode. Bull. Electrochem. Ind. 17: 27-45.
16. Ahmed, A. M. and G. B. Mohammed, 1989. Diffusion of Cu++ in surfactant solution. J. chin, Chem. Soc. (Taiwan) 42: 78-89.
17. El-Subruiti, G. M. and A. M. Ahmed, 2002. Kinetic study of corrosion of copper in phosphoric acid Tert-Butanol Electrodeposition mixtures. Port. Electrochim. Acta 20: 151-166.
18. Grosser, F. N. and R. S. Gonclaves, 2005. Corrosion protection aspects of electrochemically prepared polyfurfural film on low carbon steel. Anti-Corros. Methods and Materials 52 (2): 78-83. 19. Talati J. D. and Daraji J. M., 1988. Journal of
Indian Chemical Society 65:94
20. Eisenberg, M., C. W. Tobias and C. R. Wilke, 1953. Correlation of limiting current under free convection conditions. J. Electrochem. Soc. 102, 523-531.
21. Taha A. A., 2004. Effect of non-aqueous solvents on the rate of production of copper powder from copper sulphate solution by cementation on stationary zinc sheet and rotating zinc cylinder. Portugaliae Electrochimica Acta 22, 103-125. 22. Soliman, H. M. A. and H. H. Abdel-Rahman, 2006.
The use of rotating cylinder electrode to study the effect of 1,3-dihydroxypropane on the production of copper powder. J. Braz. Chem. Soc. 17, 705-714.
23. Nassar, A. M., O. A. Fadali, G. H. Sedahmed, 1989. Effect of Drag Reducing polymer on the rate of cementation of copper from dilute solutions on rotating zinc cylinder. Metallkde 80 (1): 60-62. 24. Abdel-Rahman, H. H., M. A. Darweesh, 2006.
Removal of Cr6+ons from waste water in presence of some non-toxic amino acids. Egypt. J. Chem. 49: 19-34.