International Journal for Quality Research 10(2) 341–354 ISSN 1800-6450
341 David Jimoh Kayode 1
Nurahimah Mohd Yusoff Arsaythamby Veloo
Article info:
Received 27.07.2015 Accepted 10.03.2016 UDC – 54.061 DOI – 10.18421/IJQR10.02-07
VALIDATING QUALITY PROCESS
MANAGEMENT INSTRUMENT FOR
HIGHER EDUCATION USING STRUCTURAL
EQUATION MODELLING
Abstract: This study attempts to validate process management scale using rigorous validation procedures. An adapted questionnaire comprising 77 items was administered to faculty members in two public universities in Nigeria. The data gathered were analyzed using exploratory factor analysis and confirmatory factor analysis with SPSS 20.0 and SmartPLS 3.1.2 respectively. The findings of this study shows that process management is a third order reflective model with multidimensional constructs. The two dimension of process management administrative process and academic process has four and five dimensions respectively. The process management scale will therefore facilitate the identifications of elements that influence the effectiveness of higher education. The practical implications and methodological limitations are discussed.
Keywords: Instrument validation, process management, administrative process, academic process, higher education, PLS-SEM
1.
Introduction
1The Ultimate business of any organization including higher education institutions is customer’s satisfaction interms of quality. Quality has come to be the widespread concept in university education discussion (Lundquist, 1998). For the past two decades, university education all over the world have been under increasing internal and external pressure to be more efficient and effective in the provision of their services which have been pushing them in reshaping and renewing their management practices and organizational structure (Abdous, 2011;
1Corresponding author: David Jimoh Kayode email: [email protected]
Seng and Churilov, 2003; Trapitsin, et al., 2015; Vukšić et al., 2014).
examined their processes which previous researches has identified as the major determinant of its output (Calvo-Mora et al., 2013; Sahney et al., 2004). According to Kanji et al. (1999), process management have significant effect on the organizational critical results which are classified by Da Rosa et al. (2003); Calvo-Mora, Leal, and Roldán (2006) as administration and services; teaching and learning as well as research processes. Therefore, this study tends to validate the instrument for quality process management in higher education, building on previous researches.
2.
Quality Improvement
Approaches
Every excellent organization are bound to design, manage as well as improve its processes in order to generate improved value for its customers and other stakeholders (Calvo-Mora et al., 2006). Previous researches have suggested that managing quality in university education context should be handled differently from how it is being handled in manufacturing or service sectors (Chua, 2004; Madu and Kuei, 1993). The need for quality supervision in university education arises because of the continuous increase in student population, restricted and better resources utilization, limited student involvement in teaching and learning, absence of commitment among staffs and the lack of accountability. Others include systematic internal monitoring and review procedure, students not possessing requisite capabilities especially generic skills in terms of problem solving, dependency, decision-making, inventiveness, adaptability and learning as well as the rising cost per unit. That is, efficiency, effectiveness and quality of university education is at a questionable state (Mohanty, 2013; Tulsi, 2001).
Systematic supervision of administrative and academic process is a necessity towards the process principle in education. Process supervision therefore encompasses the
collection of behavioural and methodological exercise which were concentrated on behavior and undertakings rather than the outcomes (Ibrahim et al., 2011). That is, process management is a systematic tactic in which all the resources owned by the universities are used in most efficient and effective manner for the achievement of a desired performance (Sit et al., 2009). In a study of critical factors and performance measurement of total quality management, Motwani (2001) commented that process management stresses the value adding to a procedures, enhancing the productivity of every workers and improving the organizational quality. Several empirical studies have also proved positive relationship between process management and quality performance (Talib et al., 2013). Huitt (2003) grouped administrative and academic processes into: input, context and classroom practices. The input includes factors that influence teaching and learning outside the classroom; context are the lecturers’ qualities and that of the students they teach in the classroom; classroom processes which are the behaviours of the lecturers and that of the students in the classrooms and other factors or variables like the classroom environment and the relationship of both the lecturers and the students. It is a means by which the university system manages designs and enhances teaching and learning so as to reinforce its strategy, policy and satisfy completely the stakeholders’ rising need. According to EFQM (2009), sub- criteria for
process management include:
343 the idea of students’ service is nurtured
through staff training and development; staff focus approach that emphasis on enhancing the contribution of all members of staff towards school effectiveness. The third approach seeks to ensure conformity to requirement of certain strategic measureable facts of the educational process.
According to Lundquist (1998), educational process could be based on the resources that are inter-connected and undertakings in which inputs are transform into outputs. Such inputs include students’ competency and those of their lecturers. Furthermore,
Chua (2004) see educational process in higher education to include accuracy of curriculum content, instruction medium, assessment, teaching and learning, as well as content and delivery of course units. While, administration was sometimes understood to consist of three successive processes: vision, planning and policy (Krüger and Scheerens, 2012). However, administrative and academic processes begin even before the first day of the student in the classroom till his last day in the school; although numerous literature have limited academic process to curriculum, instruction and assessment.
Contribution of the study
Figure 1. Conceptual Framework
This study build on the dimentions of process management as suggested by Calvo-Mora et al. (2006) which are administrative process, educational process and research process. The findings of their study revelas that research process is negatively insignificant in process management in higher education. Therefore, this study identify administrative process and academic processes (education and research process) as dimension for process management and
course design, teaching, improving degree
program, student feedback, handling of assignment (Emiliani, 2004, Emiliani 2005).
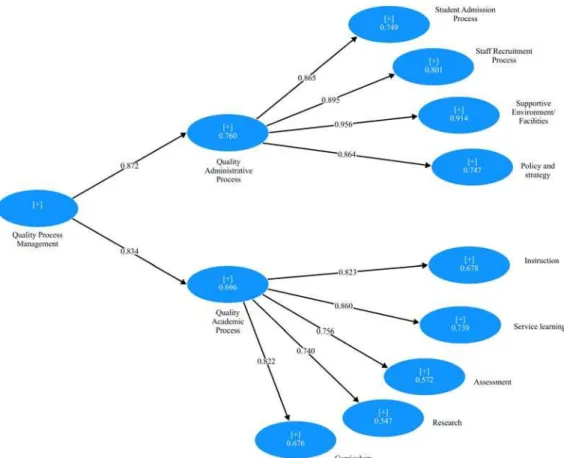
Figure 2. Quality Process Management
The dimension of process management in this study is also in line with Psomas et al. (2011) who examined the level of process management in certified companies. Using exploratory factor analysis, two factors were extracted from process management construct which they termed: core process management and the supporting quality tools. The core process management and the supporting tools are terms in this study quality academic process and quality administrative process respectively. Therefore, this study examine the administrative processes in terms of students’ admission, staff recruitment, supportive resources, facilities and environment as well as policies and
strategies while academic processes are examined viz-a-viz curriculum, instruction, service learning, assessment and research. This is shown in Figure 1.
3.
Methodology
3.1. Population and sampling
345 containing five or fewer variables with more
than three observed variables requires a minimum of 100 sample size or more. Therefore, because of low response rate among lecturers, additional 60% was added to 100 and a total of 160 lecturers were determined to be the sampled size for this study. The study adopted a multi-stage sampling technique. The public universities in north central were first stratified into federal and state universities. One federal and one state university were then randomly selected. In each of the selected university, the respondents were grouped into eight
strata according to faculties and 10 respondents were randomly selected in each of the faculty in the selected universities. A total of 160 respondents were selected for this study.
3.2. Instrumentation
Items for this study were randomly selected from previous work and literatures. The instrument are in two form: quality administrative processes which are in four dimensions and; quality academic process which has five dimensions.
Table 1. Measurements for Administrative process
S/N Dimension No. of items Source (s) Cronbach’s α
1. Staff recruitment Process 5 Sule and Ugoji (2013) Not reported 2. Students admission process 6 Chukwurah (2011) 0.75 3. Supportive
Environment/Facilities 9 Akporehe (2011); Patterson et al. (2005); Ramsden (1991) Ranges between 0.76 to 0.89 4. Policy and Strategy 10 Calvo-Mora et al. (2006) 0.78
Table 2. Measurements for quality academic process
S/N Dimension No. of items Sources Cronbach’s α
1. Curriculum 16 Jenkins (2012) .73
2. Instructions 7 Ramsden (1991) .76
3. Service learning 8 Steinberg et al. (2010) .53
4. Assessment 9 Ramsden (1991) .74
5. Research and development 7 Calvo-Mora et al. (2006) .605 The first aspect of the instrument measures
quality administrative process. It was adapted from the research of different studies reviewed which include both empirical conceptual articles. The quality administrative process in this study includes staff recruitment process, student admission, Supportive Environment/Facilities and Policy and Strategy.
The second instrument is tagged “Quality Academic Process Questionnaire” (QAPQ) which were adapted from various studies review. It was used to draw out information from the academic staffs as regards their views concerning the academic process in their respective institutions. The quality academic process has five dimensions in compliance with the Research framework.
Table 2 is the analysis of the meausres and its source.
3.3. Face and Content validity of items
Their suggestions were effected and 10 copies were further administered to lecturers who are not part of the sampled to examine their understanding of the itmes and to seek their opinion about the appropriateness of the items’ statement interms of their wordings, the instructions, general formatting and understability of the scales in order to detect if there is any difficulties that may arise in filling the questionnaire. Therefore, some suggestions made were effected before sending out the final draft.
3.4. Data collection procedures and analysis
Data were collected personally by the researchers through a cross-sectional survey. In the guide line provided by Stanley and Wise (2010), this study emphasized the ethical issues in maintaining privacy, guaranteeing anonymity, and guaranteeing confidentiality.
The data collected was analysed using SPSS and SmartPLS statistical packages. The data collected were screened before analysis. Missing data was not an issue in this study as the researchers administered the questionnaire to the respective participant and make sure the questionnaire is appropriately field in the process of collecting it. The non-response bias was tested as the returned questionnaire was grouped into early responses and late responses and the data was analyse to check if there is any significant difference in the set of responses. The mean value and the levene’s test for equality of variance shows that there is no significant difference which means that, the non response rate is not a problem in this study. As SEM_PLS was used as the analysis techniques which also handles non-normal data, normality test was not conducted in this study. The SEM-PLS has two approaches: measurement model and structural model. as this study was carried out to validate an instrument, only the measurement model are applicable in this study.
3.4. Respondents’ profile
The analysis of the respondents’ profile shows that 74.3 % of the respondents are male while 25.7 were female. The analysis also revealed that 59.41 % of the respondents are master degree holder while 38.61% are PhD degree holder. The respondents cut across eight different faculties in which management science has the highest number of respondents (20.8%) while faculty of vetinary has 4 respondents (4%) as the faculty with the least number of respondents. The participant cut across the seven cadre of academic staff positions in Nigerian universities. The highest number of respondents fall within lecturer I and lecturer II with 47 (46.5%) and 23 respondents (22.8%) respectively. The graduate assistant and professorship position has the least number of respondents with 2% and 3% respectively. The details are shown in Table 3.
4.
Findings
Smartpls 3 .1.2 (Ringle et al., 2005) was used to validate process management as third order reflective hierarchical construct. Analysis of data using partial least square are in two stages measurement model and structural model. for the validation of instrument, only the measurement model was assessed in this study. The confirmatory factor analysis was conducted to assess the properties of the measurement scales in order to evaluate the validity and reliability of the instrument. Therefore, as suggested by Hair et al. (2010), the measurement model was assessed through the indicator reliability, composite reliability (internal consistency reliability), convergent validity and discriminant validity.
347
Table 3. Demographics of participant
Profile Description Frequency Percent Valid Percent Cumulative Percent
Gender Male 75 74.3 74.3 74.3
Female 26 25.7 25.7 100.0
Qualification First Degree
Master Degree 2 60 1.98 59.41 1.98 59.41 1.98 61.39
PhD Degree 39 38.61 38.6 100.0
Faculty Arts 13 12.9 12.9 12.9
Education 13 12.9 12.9 25.7
Engineering 8 7.9 7.9 33.7
Law 12 11.9 11.9 45.5
Science 13 12.9 12.9 58.4
Social Science 17 16.8 16.8 75.2
Management Science 21 20.8 20.8 96.0
Vet. Medicine 4 4.0 4.0 100.0
Rank Graduate Assistant 2 2.0 2.0 2.0
Assistant Lecturer 13 12.9 12.9 14.9
Lecturer II 23 22.8 22.8 37.6
Lecturer I 47 46.5 46.5 84.2
Senior Lecturer 6 5.9 5.9 90.1
Associate Professor 7 6.9 6.9 97.0
Professor 3 3.0 3.0 100.0
Length of
Service 0-4 years 5- 9years 1 63 1.0 62.4 1.0 62.4 1.0 63.4
10-14 years 19 18.8 18.8 82.2
15-19 years 8 7.9 7.9 90.1
20 years and above 10 9.9 9.9 100.0
Age 31-40 years 37 36.6 36.6 36.6
41-50years 42 41.6 41.6 78.2
51-60 years 20 19.8 19.8 98.0
61 years and above 2 2.0 2.0 100.0
Table 4. Loadings and Cross Loadings
Asse
ssme
nt
Cu
rricu
lu
m Instr
uc
tion
Policy
and
strategy Res
earch
Stude
nt
Admiss. Proce
ss
Servic
e
Le
ar
ning
Staff Recru
it.
Pr
oce
ss
Sup
por
tive
Environme nt/Facil
iti
es
ASS1 0.860 0.229 0.445 0.483 0.421 0.289 0.763 0.212 0.312
ASS2 0.865 0.232 0.451 0.400 0.488 0.406 0.639 0.292 0.398
ASS3 0.709 0.408 0.458 0.164 0.325 0.057 0.588 0.056 0.027
ASS4 0.811 0.117 0.215 0.260 0.250 0.335 0.415 0.347 0.282
ASS8 0.765 0.393 0.596 0.473 0.511 0.443 0.663 0.498 0.449
CUR2 0.226 0.795 0.482 0.220 0.290 0.012 0.337 0.166 0.214 CUR6 0.519 0.818 0.538 0.589 0.472 0.250 0.563 0.372 0.457 CUR7 0.354 0.857 0.624 0.430 0.455 0.133 0.465 0.232 0.320 CUR8 0.270 0.727 0.434 0.467 0.444 0.299 0.264 0.421 0.370 CUR9 0.306 0.796 0.559 0.371 0.661 0.298 0.366 0.338 0.381 INS3 0.588 0.588 0.867 0.298 0.538 0.240 0.719 0.167 0.255 INS5 0.419 0.262 0.689 0.247 0.341 0.121 0.568 0.026 0.171 INS6 0.232 0.528 0.723 0.397 0.563 0.453 0.250 0.548 0.492 PS1 0.394 0.266 0.350 0.822 0.209 0.708 0.209 0.666 0.854 PS10 0.491 0.377 0.419 0.840 0.260 0.467 0.471 0.533 0.621 PS3 0.332 0.376 0.308 0.863 0.180 0.538 0.268 0.622 0.693 PS4 0.257 0.378 0.298 0.898 0.159 0.458 0.230 0.526 0.624 PS5 0.267 0.329 0.351 0.845 0.257 0.376 0.231 0.488 0.524 PS6 0.366 0.544 0.318 0.820 0.182 0.248 0.429 0.431 0.450 PS7 0.439 0.329 0.344 0.815 0.364 0.484 0.415 0.582 0.607 PS8 0.405 0.430 0.242 0.763 0.270 0.296 0.454 0.458 0.529 PS9 0.495 0.337 0.386 0.858 0.303 0.461 0.495 0.550 0.654 RD4 0.505 0.474 0.651 0.260 0.895 0.174 0.557 0.139 0.179 RD6 0.207 0.465 0.415 0.454 0.788 0.307 0.199 0.379 0.372 RD7 0.536 0.458 0.514 0.091 0.862 0.207 0.594 0.131 0.137 SA2 0.310 0.239 0.319 0.561 0.179 0.846 0.140 0.768 0.774 SA3 0.397 0.132 0.384 0.412 0.323 0.871 0.249 0.656 0.678 SA4 0.249 0.019 0.186 0.262 0.129 0.789 0.101 0.507 0.559 SA5 0.230 0.171 0.210 0.534 0.164 0.903 0.116 0.802 0.855 SA6 0.439 0.100 0.350 0.495 0.289 0.794 0.280 0.632 0.686 SL1 0.408 0.431 0.690 0.224 0.427 0.130 0.736 0.202 0.213 SL2 0.616 0.494 0.796 0.350 0.645 0.200 0.860 0.189 0.200 SL3 0.750 0.352 0.565 0.384 0.496 0.201 0.875 0.241 0.219 SL4 0.704 0.485 0.681 0.269 0.626 0.159 0.862 0.161 0.141 SL5 0.732 0.405 0.508 0.415 0.441 0.178 0.927 0.180 0.224 SL6 0.752 0.324 0.510 0.441 0.361 0.229 0.894 0.194 0.302 SL8 0.783 0.370 0.457 0.446 0.355 0.169 0.894 0.164 0.246 SR1 0.416 0.308 0.244 0.500 0.263 0.706 0.222 0.871 0.652 SR2 0.388 0.290 0.364 0.551 0.296 0.719 0.212 0.878 0.669 SR3 0.251 0.315 0.268 0.585 0.123 0.683 0.196 0.875 0.717 SR4 0.195 0.217 0.210 0.517 0.225 0.751 0.096 0.832 0.758 SR5 0.238 0.232 0.201 0.602 0.063 0.568 0.202 0.760 0.696 SS1 0.292 0.181 0.209 0.613 0.128 0.827 0.133 0.740 0.880
SS2 0.285 0.287 0.323 0.632 0.203 0.814 0.136 0.815 0.911
SS3 0.362 0.418 0.344 0.623 0.136 0.663 0.267 0.693 0.812
SS4 0.346 0.156 0.402 0.479 0.244 0.751 0.287 0.574 0.811
SS5 0.404 0.318 0.353 0.749 0.290 0.778 0.246 0.790 0.917
SS6 0.124 0.345 0.239 0.686 0.087 0.527 0.188 0.534 0.718
SS8 0.340 0.374 0.391 0.568 0.362 0.576 0.235 0.621 0.735
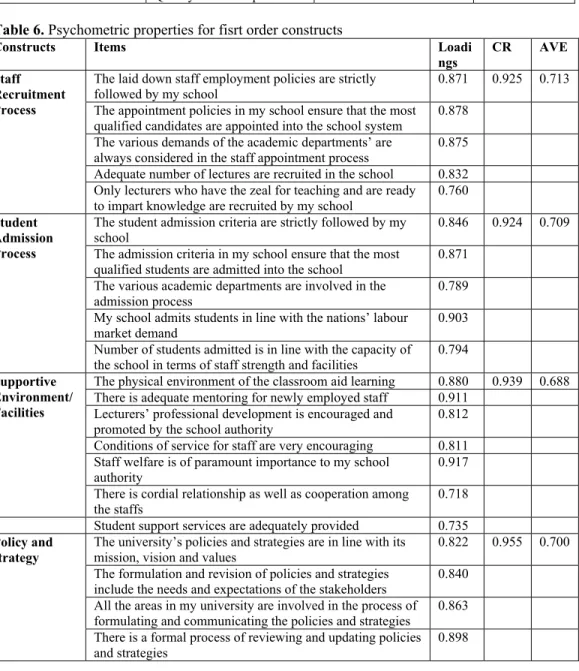
The internal consistency reliability was also assessed. The composite reliability as suggested by Hair et al. (2014) was assessed using the threshold value of 0.7. The composire reliability of the instrument in this study are between 0.806 and 0.963.
349 accounted for by the latent construct. In this
study, the AVE are within the range of 0.583 and 0.749 which is above the recommended value of 0.5 as suggested by Hair et al.
(2010). Therefore, we can conclude that there is presence of convergent validity in the measurement model of this study as shown in Tables 5 and 6.
Table 5. Reliability of the higher order constructs
Model Construct CR AVE
Third order Quality Process
management 0.843 0.728
Second order Quality administrative
process 0.935 0.783
Quality academic process 0.828 0.529
Table 6. Psychometric properties for fisrt order constructs
Constructs Items Loadi
ngs CR AVE
Staff Recruitment Process
The laid down staff employment policies are strictly
followed by my school 0.871 0.925 0.713
The appointment policies in my school ensure that the most
qualified candidates are appointed into the school system 0.878 The various demands of the academic departments’ are
always considered in the staff appointment process 0.875 Adequate number of lectures are recruited in the school 0.832 Only lecturers who have the zeal for teaching and are ready
to impart knowledge are recruited by my school 0.760
Student Admission Process
The student admission criteria are strictly followed by my
school 0.846 0.924 0.709
The admission criteria in my school ensure that the most
qualified students are admitted into the school 0.871 The various academic departments are involved in the
admission process 0.789
My school admits students in line with the nations’ labour
market demand 0.903
Number of students admitted is in line with the capacity of
the school in terms of staff strength and facilities 0.794
Supportive Environment/ Facilities
The physical environment of the classroom aid learning 0.880 0.939 0.688 There is adequate mentoring for newly employed staff 0.911
Lecturers’ professional development is encouraged and
promoted by the school authority 0.812
Conditions of service for staff are very encouraging 0.811 Staff welfare is of paramount importance to my school
authority 0.917
There is cordial relationship as well as cooperation among
the staffs 0.718
Student support services are adequately provided 0.735
Policy and
strategy The university’s policies and strategies are in line with its mission, vision and values 0.822 0.955 0.700 The formulation and revision of policies and strategies
include the needs and expectations of the stakeholders 0.840 All the areas in my university are involved in the process of
formulating and communicating the policies and strategies 0.863 There is a formal process of reviewing and updating policies
The university’s policies and strategies are structured in a
Strategic Plan 0.845
The university’s goals are set out in writing and in a clear
and quantifiable manner 0.820
The goals are communicated at all levels of the organization 0.815 The principles of quality are incorporated into all of the
university’s policies, strategies and goals 0.763 There is a procedure allowing for the deployment of the
policies and strategies and for their being turned into short term plans
0.858
Assessment The assessment process at my school enables students to
demonstrate the achievement of all the intended outcomes 0.860 0.901 0.646 There is full confidence in the security and integrity of
assessment procedures in my school 0.865 The external examiner enhances quality assessment process
in my school 0.709
Good procedures are put in place for recording and
verifying marks by the school 0.811
The assessment strategies adopted in my school have an
adequate formative function in developing student abilities 0.765
Curriculum The curriculum is relevant to graduates seeking additional
education in the same area 0.822 0.963 0.704
The curriculum is relevant to graduates seeking
employment. 0.910
The curriculum is relevant to graduates working in the field. 0.891 The curriculum is likely to enhance a high program
graduation rate. 0.844
The curriculum is likely to lead to a high quality of
instruction within the program. 0.931
The curriculum is likely to lead to a high quality assessment
within the program. 0.815
The present curricular reflect what the students will come
across after graduation 0.795
The curriculum is well designed and up to date 0.818 The curriculum integrates subject matter and high thinking
skills 0.857
The curriculum content and process objectives are situated
in real world tasks 0.727
The curriculum is designed based on a variety of research 0.796
Instruction In my school, teaching is all about providing a conducive environment in which students are encouraged to make the learning themselves
0.867 0.806 0.583
Most lecturers have the potential to bring reality to the
classrooms 0.689
Instructions are electronically integrated 0.723
Service
Learning Service learning provides experience in a new domain Service learning gives students practical experience 0.736 0.860 0.954 0.749 Service learning exposes students to diverse stakeholders 0.875
Service learning exposes students to complex organizational
problems 0.862
Service learning allows students to gain advocacy and
problem solving skills 0.927
351 satisfaction through service
Through service learning, students commit themselves to
become involved in new post university community life 0.894
Research The lecturers’ research activity envisages the students’
needs and expectations 0.895 0.886 0.722
The lecturers’ research activity envisages the companies’
needs and expectations 0.788
The academic research activity envisages the needs and
expectations of the community or the society as a whole 0.862
Table 7. Fornell-Larcker Criterion
1 2 3 4 5 6 7 8 9
1.Assessment 0.804
2. Curriculum 0.362 0.839
3. Instruction 0.565 0.617 0.764
4. Policy & strat 0.458 0.438 0.402 0.837 5. Research 0.515 0.544 0.631 0.289 0.849 6. Serv. Learn. 0.787 0.475 0.698 0.417 0.560 0.866 7. Staff Recruit. 0.351 0.323 0.306 0.653 0.230 0.219 0.844 8. Stud. Admis. 0.384 0.167 0.345 0.552 0.257 0.209 0.813 0.842 9. Supportive
Environment/Facilities 0.373 0.355 0.386 0.751 0.249 0.253 0.828 0.827 0.830 Square root of the AVE on the diagonal (bold).
When the concergent validity has been ascertained in this study, the discriminant validity according to Fornell and Larcker (1981) was assessed by comparing the squared correlations between constructs and the average variance extracted for the construct. It is evident in Table 7 that the squared correlations for each of the constructs in this study were less than the average variance extracted by the indicators measuring that construct. Therefore, we can conclude that there is adequate discriminant validity in the measurement model. On the overall assessment, we can said the instrument is satisfactorily valid and reliable for measuring process management in higher education as it fulfill all measures of reliability and validty.
5.
Discussion and Conclusion
As revealed in the analysis of data collected for this study, the loadings and crossloadings as well as the fornel-Larker criterion signifies that the items used in this study are valid. Also, the composite reliability and the
average variance extracted indicate that the instrument are relable. It is also evident from the second order analysis in this study that process management as third order construct has exhibited solid validity and reliability despite some little weaknesses. Therefore, this instrument will be a good measure of process management or any of its dimention as suggested in this study.
process management as a third order construct was reflected in quality administrative process and quality academic process which explained 76% and 70% of the overall process management respectively. This implies that quality academic process has the greatest reflection of the overall process management.
As reported in previous research conducted by Calvo-Mora et al., (2006), research and development was not significantly related to process management but in this study, when research and development were treated as second order construct to process management, it becomes significant. This justifies the inclusion research and development as a dimention under quality academic process which are also in line with Emiliani (2005). Therefore, this instrument will be very useful for researcher in the area of educational administration as well as
higher education administrators.
The major limitation in this study is that the sample size was relatively small for the development of a psychological instrument. According to Jana-Masri and Priester (2007); factor analysis requires five to ten participants per item. Our instrument has 77 items and was validated with a sample size of 101. Although, the sample size is justifiable for PLS-SEM. However, further study should be carried out with a large sample size and in different country; and such studies should also include private universities as part of the sample size. As previous studies has stressed the importance of process management towards institutional effectiveness, further studies shoud be conducted using this measures of process management to examine its effect of higher education effectiveness.
References
:Abdous, M.H. (2011). Towards a framework for business process reengineering in higher education. Journal of Higher Education Policy and Management, 33(4), 427-433. doi: 10.1080/1360080X.2011.585741
Akporehe, D.A. (2011). The impact of environment on productivity in secondary schools. African Journal of Education and Technology, 1(1), 116-122.
Calvo-Mora, A., Leal, A., & Roldán, J.L. (2006). Using enablers of the EFQM model to manage institutions of higher education. Quality Assurance in Education, 14(2), 99-122. doi: 10.1108/09684880610662006
Calvo-Mora, A., Picón, A., Ruiz, C., & Cauzo, L. (2013). The relationships between soft-hard TQM factors and key business results. International Journal of Operations & Production Management, 34(1), 115-143.
Chua, C. (2004). Perception of quality in higher education. Paper presented at the Australian universities quality forum, Melbourne.
Chukwurah, C.C. (2011). Access to higher education in nigeria: The university of calabar at a glance. Canadian Social Science, 7(3), 108-113.
Da Rosa, M.J.P., Saraiva, P.M., & Diz, H. (2003). Excellence in Portuguese higher education institutions. Total Quality Management & Business Excellence, 14(2), 189-197. doi: 10.1080/1478336032000051377
EFQM. (2009). The EFQM Excellence Model. Retrieved from: http://ww1.efqm.org/en/Home/ aboutEFQM/Ourmodels/EFQMExcellenceModel/tabid/170/Default.aspx
353 Emiliani, M.L. (2005). Using kaizen to improve graduate business school degree programs.
Quality Assurance in Education, 13(1), 37-52. doi:10.1108/09684880510578641
Fornell, C., & Larcker, D.F. (1981). Evaluating structural equation models with unobservable variables and measurement error. Journal of Marketing Research, 18(1), 39-50.
Hair, J.F., Black, W., Babin, B., & Anderson, J. (2010). Multivariate data analysis: A global perspective. New Jersey: Pearson Prentice Hall.
Hair, J.F., Hult, G.T.M., Ringle, C., & Sarstedt, M. (2014). A primer on partial least squares structural equation modeling (PLS-SEM). Washington DC: SAGE Publications, Incorporated.
Harris, R.W. (1994). Alien or Ally? Quality Assurance in Education, 2(3), 33-39. doi: doi:10.1108/EUM0000000003968
Huitt, W. (2003). A transactional model of the teaching/learning process. Educational Psychology Interactive. Retrieved from: http://www.edpsycinteractive.org/materials/ tchlrnmd.html
Ibrahim, I., Amer, A., & Omar, F. (2011). The total quality management practices and quality performance. A case study of pos malaysia berhad, kota kinabalu, sabah.
Jana-Masri, A., & Priester, P.E. (2007). The Development and Validation of a Qur’an-Based Instrument to Assess Islamic Religiosity: The Religiosity of Islam Scale. Journal of Muslim Mental Health, 2(2), 177-188. doi: 10.1080/15564900701624436
Jenkins, M.D. (2012). The Effects of State System Wide Curriculum on Retention, Graduation, Employment, and Faculty Beliefs in a Large, Urban Institution of Higher Education. (3518167 Ph.D.), Cardinal Stritch University, Ann Arbor. Retrieved from http://eserv.uum.edu.my/docview/1033339650?accountid=42599 ProQuest Dissertations & Theses Full Text database.
Kanji, G.K., Malek, A., & Tambi, B.A. (1999). Total quality management in UK higher education institutions. Total Quality Management, 10(1), 129-153. doi: 10.1080/0954412998126
Kayode, D.J., Yusoff, N. M., & Veloo, A. (2014). Assessing the effectiveness of university education in era of globalization:using the goal and strategic constituent approach. African Journal of Higher Education Studies and Development, 2, 230-252.
Krüger, M., & Scheerens, J. (2012). Conceptual Perspectives on School Leadership. In J. Scheerens (Ed.), School Leadership Effects Revisited (pp. 1-30): Springer Netherlands. Kulshreshtha, N. (2012). Total quality management. New Delhi: Enkay Publishing House. Lundquist, R. (1998). Quality improvements of teaching and learning in higher education: a
comparison with developments in industrial settings. Teaching in Higher Education, 3(1), 51-62.
Madu, C.N., & Kuei, C.H. (1993). Dimensions of quality teaching in higher institutions. Total Quality Management, 4(3), 325-338. doi: 10.1080/09544129300000046
Mohanty, R. (2013). Total quality management in university system. International Conference on Tertiary Education (ICTERC 2013) Daffodil International University, Dhaka, Bangladesh 19-21 January 2013.
Motwani, J. (2001). Critical factors and performance measures of TQM. The TQM Magazine, 13(4), 292-300.
practices, productivity and innovation. Journal of Organizational Behavior, 26(4), 379-408. doi: 10.1002/job.312
Psomas, E.L., Fotopoulos, C.V., & Kafetzopoulos, D.P. (2011). Core process management practices, quality tools and quality improvement in ISO 9001 certified manufacturing companies. Business Process Management Journal, 17(3), 437-460. doi: http://dx.doi.org/10.1108/14637151111136360
Ramsden, P. (1991). A performance indicator of teaching quality in higher education: The Course Experience Questionnaire. Studies in Higher Education, 16(2), 129-150.
Ringle, C.M., Wende, S., & Will, S. (2005). SmartPLS 2.0 (M3) Beta, Hamburg 2005.
Sahney, S., Banwet, D.K., & Karunes, S. (2004). Conceptualizing total quality management in higher education. The TQM Magazine, 16(2), 145-159.
Seng, D., & Churilov, L. (2003). Business process-oriented information support for a higher education enterprise. Paper presented at the 7th Pacific Asia Conf on Info Systems (M Lynne Markus and Trevor Wood-Harper 10 July 2003 to 13 July 2003).
Sit, W.Y., Ooi, K.B., Lin, B., & Chong, A.Y.L. (2009). TQM and customer satisfaction in Malaysia's service sector. Industrial Management & Data Systems, 109(7), 957-975. Stanley, L., & Wise, S. (2010). The ESRC's 2010 Framework for Research Ethics: fit for
research purpose? Sociological Research Online, 15(4), 12.
Steinberg, K.S., Bringle, R.G., Williams, M.J., Steinberg, K., Bringle, R., Williams, M., & Scotts Valley, C. (2010). Service-learning research primer. Scotts Valley, CA: National Service-Learning Clearinghouse.
Sule, O.E., & Ugoji, I.E. (2013). Impact of personal recruitment on organisational development: A survey of selected Nigerian workplace. International Journal of Business Administration, 4(2), 79.
Talib, F., Rahman, Z., & Qureshi, M. (2013). An empirical investigation of relationship between total quality management practices and quality performance in Indian service companies. International Journal of Quality & Reliability Management, 30(3), 280-318. Trapitsin, S., Krokinskaya, O., & Timchenko, V. (2015). Quality assessment in higher
education: Are Russian universities focused on the educational needs of students? International Journal for Quality Research, 9(2), 339-354.
Tulsi, P.K. (2001). Total quality in higher education, reforms and innovations in higher education. New Delhi: AIU
Vukšić, V.B., Bach, M.P., & KatarinaTomičić-Pupek. (2014). Process Performance Management in Higher Education. International Journal of Engineering Business Management, 6(11), 1-8. doi: 10.5772/58680
David Jimoh Kayode
University of Ilorin, Faculty of Education Department of Educational Management
Ilorin Nigeria
Nurahimah Mohd Yusoff
Universiti Utara Malaysia, Department of Educational Studies
Sintok Malaysia
Arsaythamby Veloo
Universiti Utara Malaysia, Department of Educational Studies