Abstract—High competitive pressure in the global manufac-turing industry makes efficient, effective and continuously improved manufacturing processes a critical success factor. Yet, existing analytics in manufacturing, e. g., provided by Manufacturing Execution Systems, are coined by major short-comings considerably limiting continuous process improvement. In particular, they do not make use of data mining to identify hidden patterns in manufacturing-related data. In this article, we present indication-based and pattern-based manufacturing process optimization as novel data mining approaches provided by the Advanced Manufacturing Analytics Platform. We demonstrate their usefulness through use cases and depict suitable data mining techniques as well as implementation details.
Index Terms—Analytics, Data Mining, Decision Support, Process Optimization
I. INTRODUCTION
A. Motivation
Globalization, shorter product lifecycles and rapidly changing customer needs lead to high competitive pressure in the manufacturing industry. Apart from product quality and product variety, flexibility, short lead times and a high adherence to delivery dates have become essential success factors [1]. Thus, efficient, effective and continuously opti-mized manufacturing processes are central prerequisite to perform successfully on the market [2].
Looking at other industry sectors, Business Intelligence (BI) technology is successfully applied for the optimization of workflow-based business processes, esp. in the service industry [3], [4]. This emphasizes the potential of using comprehensive analytics to improve business activities.
Regarding BI approaches in manufacturing, there are mainly two types, wide-spread in industry practice: On the one hand, pre-packaged dashboard applications based on
Manuscript received March 14, 2012; revised April 12, 2012. The au-thors would like to thank the German Research Foundation (DFG) for financial support of this project as part of the Graduate School of Excel-lence advanced Manufacturing Engineering (GSaME) at the University of Stuttgart, Germany.
C. Gröger is with the Institute of Parallel and Distributed Systems (IPVS), University of Stuttgart, 70569 Stuttgart, Germany. He is a member of the Graduate School of Excellence advanced Manufacturing Engineer-ing (GSaME) at the University of Stuttgart (phone: +49 711 685-88242; fax: +49 711 685-88424; e-mail: [email protected]).
F. Niedermann and B. Mitschang are with the Institute of Parallel and Distributed Systems (IPVS), University of Stuttgart, 70569 Stuttgart, Germany (e-mail: [email protected], [email protected]).
metrics visualization and basic reporting, typically part of Manufacturing Execution Systems (MES) [5]; on the other hand, custom BI applications that mainly focus on spread-sheet-based Online Analytical Processing (OLAP) [6]. The-se existing BI approaches are coined by the following major shortcomings, considerably limiting continuous process improvement:
Being based on isolated data extracts, they do not adopt a holistic view integrating operational and process data, e. g., from MES and Enterprise Resource Planning (ERP) Systems.
They focus on OLAP-like analysis and classical report-ing and do not employ advanced analytics techniques, esp. data mining, to extract knowledge from data.
They only provide limited means for sharing and com-bination of analysis results, for example in different sub processes of Manufacturing Process Management.
They offer no guidance for transforming analysis results into concrete process modifications – leaving this step entirely up to the subjective judgement and skills of the process analyst.
Eliminating these insufficiencies is the key motivation of the Advanced Manufacturing Analytics (AdMA) Platform, which is being developed as part of our overall work. In this article, we focus on indication-based and pattern-based op-timization as novel concepts for process-centric data mining in manufacturing provided by the AdMA Platform.
The remainder is organized as follows: First, we introduce the AdMA Platform and characterize existing data mining approaches in manufacturing in Section 2. Next, we present Indication-based and Pattern-based Manufacturing Optimi-zation in Section 3. Section 4 details the former and defines corresponding uses cases. In addition, adequate data mining techniques for a selected use case are discussed and the prototypical implementation as well as a first proof of con-cept is presented. We conclude in Section 5 and point out future work.
B. The Advanced Manufacturing Analytics Platform
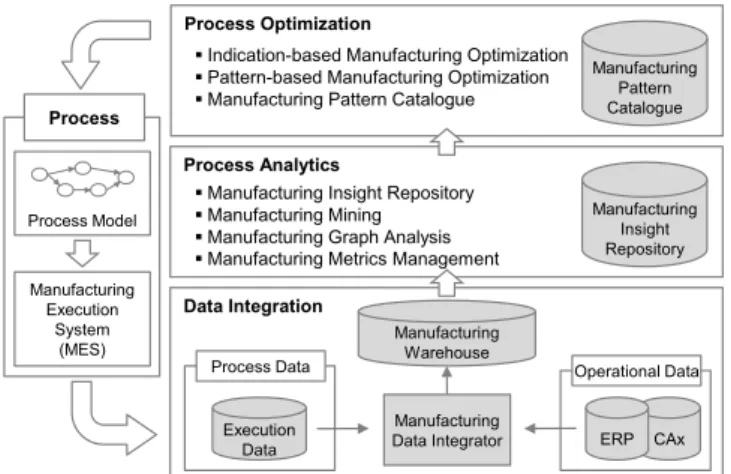
The Advanced Manufacturing Analytics Platform [7] is an integrated BI platform for holistic data-driven manufacturing process optimization. It is based on a transfer of concepts of the Deep Business Optimization Platform [8], [3], [9] to the area of manufacturing. Its conceptual architecture consists of three integrated layers sketched in Fig. 1.
Data Mining-driven
Manufacturing Process Optimization
Data Integration
Manufacturing Data Integrator Process Analytics
Process Optimization
Process
Process Model
Manufacturing Execution
System
(MES) Manufacturing Warehouse
Operational Data Process Data
Execution
Data ERP CAx
Indication-based Manufacturing Optimization
Pattern-based Manufacturing Optimization
Manufacturing Pattern Catalogue
Manufacturing Insight Repository
Manufacturing Mining
Manufacturing Graph Analysis
Manufacturing Metrics Management
Manufacturing Pattern Catalogue
Manufacturing Insight Repository
Fig. 1. Conceptual architecture of the Advanced Manufacturing Analytics Platform
The Data Integration Layer integrates process and op-erational manufacturing data in a holistic process-centric data warehouse, the Manufacturing Warehouse. In general, operational data are subject-oriented and represent data of traditional Data Warehouses, e. g., sales data. Process data are flow-oriented and comprise execution data, i. e., events recorded during process ex-ecution, and process model data [9]. The Manufacturing Warehouse abstracts heterogeneous source formats and provides a unified multidimensional view on all process aspects. Considering data provisioning, the Manufactur-ing Data Integrator matches process and operational source data and consolidates them into the Manufactur-ing Warehouse.
Various analysis techniques, esp. data mining methods and metrics calculation, are at the heart of the Process Analytics Layer. Generated insights, i. e., analysis re-sults, are stored in the Manufacturing Insight Reposito-ry as a central component for sharing, combination and reuse of analysis results, e. g., data mining models. It is oriented towards the dBOP approach in [10].
The Process Optimization Layer focuses on the applica-tion and combinaapplica-tion of insights from the Manufactur-ing Insight Repository to support the actual process im-provement. Indication-based Manufacturing Optimiza-tion as well as Pattern-based Manufacturing Optimiza-tion are presented in this article.
II. DATA MINING IN MANUFACTURING
Due to the large amounts of data generated and collected during manufacturing execution, manufacturing is a promis-ing area of application for data minpromis-ing to extract knowledge for optimization purposes [11]. Yet, data mining approaches in manufacturing practice are rare compared to various suc-cessful data mining applications in the service industry, e.g. in banking, telecommunications or retailing. Thus, we con-ducted a meta-analysis of research literature for data mining in manufacturing [12], [11], [13], [14]. Existing data mining approaches in manufacturing mainly address the following fields of application:
Quality analysis of products to correlate output quality and system parameters, esp. machine settings, in order to identify causes for deteriorating product quality, e. g., in [15], [16].
Failure analysis of production resources, esp. machines, to analyse causes of errors and prevent break downs in the future, e. g., in [17], [18].
Maintenance analysis to enhance the availability of pro-duction resources, e. g., by optimized maintenance planning, e. g., in [19], [20].
Production planning and scheduling analysis to improve planning quality, e. g., by a higher capacity utilisation of production resources, e. g., in [21], [22].
A multiplicity of existing approaches focuses on quality analysis and failure analysis with the semiconductor industry as one important field for implementations due to its high degree of automation and the multiplicity of parameters affecting product quality [12]. In general, existing approach-es are typically based on manually integrated and isolated process data extracts to analyse certain partial aspects of manufacturing processes in individual industry-specific cases, e. g., selected machines or particular quality measures, missing a holistic view on the process.
Our literature survey hence clearly shows a significant need for research on universal data integration and data storage concepts for data mining in manufacturing to gener-ate versatile pre-configured and truly process-centric data mining applications that can be adapted to heterogeneous manufacturing environments and different branches. An initial approach to standardized data mining in manufactur-ing is the Fraunhofer ProDaMi-Suite [23] mainly focusmanufactur-ing on quality analysis and failure analysis aspects.
III. HOLISTIC PROCESS-CENTRIC DATA MINING IN THE ADMA PLATFORM
The AdMA Platform addresses the above mentioned limi-tations of existing data mining approaches by two means: First it defines a universal holistic data basis, the Manufac-turing Warehouse [24], that integrates all data pertaining to manufacturing process performance from various source systems, i. e., operational and process data. Second, on this basis, the AdMA Platform provides generalized process-centric data mining use cases for indication-based and pat-tern-based optimization.
Indication-based Manufacturing Optimization (IbMO) is based on the adaption of the idea in [25] for standardized data mining functionalities on workflow audit data. IbMO uses pre-configured manufacturing-specific data mining models to explain and predict certain process attributes. Consequently, hints respectively indications are presented to the user that enable him to infer corresponding process im-provements.
Indication-based Manufacturing
Optimization
Explication
Root Cause Analysis
(RCA)
Structure Analysis
Prediction
Ex-ante Prediction
Real-time Prediction
Metric-oriented RCA
Cluster-oriented Structure
Analysis
Metric-oriented Real-time Prediction
Failure-oriented Real-time Prediction Failure-oriented
RCA
Concrete Use Case Generic Use Case
Fig. 2. Use cases for Indication-based Manufacturing Optimization typical optimization options, i. e., best practices, and encap-sulate necessary analytics, esp. data mining models. One pattern for example describes the optimal selection of re-sources for a production step using multiple regression. Resource attributes like the experience of an employee are linked with performance indicators, e. g., the execution dura-tion of a producdura-tion step, in a regression model to predict the likely performance and select the best resource available.
IbMO as well as PbMO can be applied ex-ante in the a priori design, real-time during the execution and ex-post in the a posteriori analysis of a manufacturing process. In the following sections we focus on IbMO, esp. the use case of root cause analysis, since PbMO still requires significant research efforts, esp. considering the definition of appropri-ate optimization patterns in manufacturing.
Both the Manufacturing Warehouse and the data mining use cases for IbMO and PbMO are designed to be flexibly adaptable to heterogeneous manufacturing environments during the instantiation of the AdMA Platform in a concrete application environment. The essential conceptual difference to existing data mining approaches is the holistic view on the manufacturing process comprising all production steps, resources as well as all input and output relations of the whole process from the creation of the production order until the finishing of the product in order to optimize the overall manufacturing process in an integrated manner.
In general, our work can be seen as an application of pro-cess mining [26] to manufacturing. At this, we do not focus on the classic process mining disciplines, namely discovery and conformance of process models, but on the enhancement of existing process models in order to improve them. In contrast to traditional enhancement approaches, we use not only process data but also operational data.
IV. INDICATION-BASED MANUFACTURING OPTIMIZATION
A. Conceptual use cases
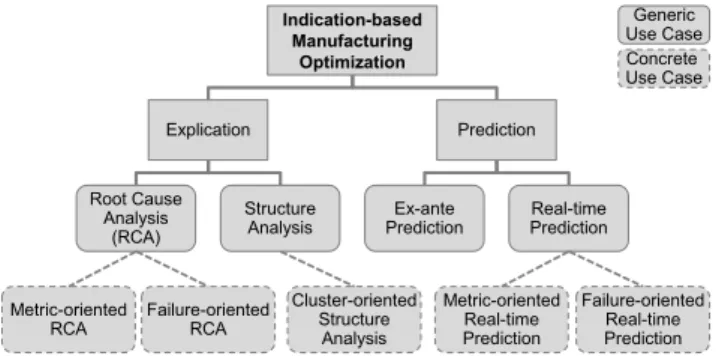
Based on industry interviews and literature analysis [25], [4], [27] we defined four generic data mining use cases for IbMO (see Fig. 2).
Each generic use case can be refined regarding the target group of users and further functional aspects to define vari-ous concrete use cases. The AdMA Platform focuses on three main target groups of users:
Production analysts who analyse manufacturing pro-cesses ex-post in depth from an engineering or manage-rial perspective.
Production managers responsible for the planning, exe-cution and supervision of individual manufacturing pro-cesses.
Production workers taking part in the execution of pro-cesses, i. e., in single production steps.
We differentiate two types of generic use cases, namely
explication and prediction use cases. The former comprise the identification of interesting characteristics of executions of a manufacturing process to explain their causes and cir-cumstances. Explication use cases are typically employed ex-post and can be targeted or untargeted. In general, a tar-geted use case requires user-defined process characteristics as a starting point compared to an untargeted use case. In this context, process characteristics refer to all attributes describing an execution of a process, e. g., metrics, machines or participating employees, as provided by the Manufactur-ing Warehouse.
Root cause analysis (RCA) is a targeted explication use case which aims at the data mining-based analysis of select-ed process characteristics definselect-ed by the user to provide comprehensible and interpretable explication models, e. g., decision trees. As a starting point, we defined the metric-oriented RCA as a concrete use case. The metric-oriented RCA aims at explaining categorized metrics of process in-stances. In general, categorization associates defined value ranges to nominal categories. Metrics are categorized be-cause typically only certain ranges not single values are relevant for RCA [25]. The user selects a pre-calculated process metric of a specific process, e. g., lead time, and assigns relevant value ranges with corresponding categories to it. That is, lead times of the selected process that are
high-er than value X could be “too high”, lead times between X
and Y could be “OK” and lead times less than Y could be
“good”. Metrics are provided by the Manufacturing War e-house whereas the standard set of basic manufacturing met-rics can be extended by user-defined metmet-rics. By categoriza-tion the metric is transformed into a nominal attribute, the class label or dependent attribute, and classification tech-niques [28] are employed to identify influence factors for the different categories, e. g., reasons for excessive lead times. The metric-oriented RCA is relevant for production manag-ers and production analysts as they are concerned with the ex-post optimization of the whole process. Another concrete use case could be the failure-oriented RCA. In contrast to a classical data mining-based failure analysis the failure-oriented RCA operates across the overall manufacturing process comprising all production steps to cross correlate all influence factors, e. g., different machines, different vendors for input material and different workers.
Structure analysis is an untargeted explication use case, i. e., there are no initial pre-defined process characteristics of importance for the user. In general, structure analysis is about the automatic identification of striking or typical exe-cutions of a selected process to infer influence factors and circumstances. A concrete structure analysis use case is the
Table I. Data mining techniques for classification
Classification Technique Interpretability Robustness
Decision Tree Induction High Low
Bayesian Classification Low High
Decision Rules Generation High Low
Neural Networks Low High
Support Vector Machines Low High
the basis of an automatically or manually defined selection of attributes describing process executions provided by the Manufacturing Warehouse. Due to the complexity of cluster-ing results, the cluster-oriented structure analysis is mainly relevant for production analysts.
In general, use cases for both RCA and structure analysis play a central role in improvement efforts as part of Lean Production or Six Sigma approaches, e. g. by supporting the 5-Why method for problem solving and continuous im-provement [29], [30].
Prediction use cases focus on the forecast of certain pro-cess characteristics. Thus, they are always targeted as the user has to pre-define relevant characteristics to predict. Prediction can be done ex-ante and real-time. Ex-ante pre-diction comprises the forecast of characteristics of processes before their first execution, i. e., during process planning and design. As there is no process execution data available for the novel process, similarity inspections of existing process-es have to be conducted to derive corrprocess-esponding predictions. This is not detailed in this article. In the following, we look at real-time prediction, i. e., forecasting of process charac-teristics during the actual execution of the process. Based on the current state of a running process as well as information about completed executions in the past, data mining-driven predictions can be made. A concrete use case for real-time prediction is the metric-oriented real-time prediction. The user selects a metric and defines whether numeric or nominal forecasts should be made. The former refers to the forecast of exact values using numeric prediction techniques, e. g., regression [28], the latter focuses on predicting categorized metrics in analogy to the metric-oriented RCA. On this ba-sis, predictions can be made at certain defined stages of the process, e. g., after the completion of each production step. Each stage defines a restricted data basis for the generation of prediction and classification models using data of past process executions as training data. These models are then employed to make predictions about the process in execu-tion. Metric-oriented real-time prediction is valuable for all target groups including production workers on the shop floor whereas each target group uses its own specific metric selec-tion. In analogy to the failure-oriented RCA we could image a failure-oriented real-time prediction as well to forecast likely failures during process execution.
Generally speaking, prediction use cases enable a proac-tive production management minimizing the possibility of error emergence and performance deviations [31]. Moreo-ver, they support built-to-order scenarios, e. g. by precise real-time forecasts of production and delivery times for customers [32].
Taking the above use cases as a starting point, we talked to manufacturing companies about existing data sources in manufacturing and novel analytics. Regarding IbMO the metric-oriented RCA was rated as most valuable additional function especially due to wide-spread metric-oriented dash-board applications in manufacturing practice. They favour data mining-based amendments for metric prediction and metric explication. Hence, our current prototypical imple-mentation focuses on the metric-oriented RCA for produc-tion managers and producproduc-tion analysts based on the Manu-facturing Warehouse. Our interviews considering GUI issues
revealed that esp. production managers prefer dashboard-like interfaces. Moreover, it was repeatedly emphasized that corresponding explication models should be as simply as possible to generate and to understand.
Based on these requirements and the upper functional de-scription of the metric-oriented RCA, in the following, we systematize the selection of appropriate data mining tech-niques and detail our prototypical implementation.
B. Selection of data mining technique
As stated above, the metric-oriented RCA is based on classification techniques. Typically, classification is used for forecasting tasks, e. g., the prognosis of a credit rating at which a training phase with existing ratings is executed and the generated model is used in an application phase for fore-casting. In contrast, the metric-oriented RCA is solely based on the training phase with the categorized metric as a class label. The aim is to generate a model which is presented to the user for explanatory purposes.
In order to identify suitable classification techniques, two conceptual criteria are crucial:
The interpretability of the generated models from a user point of view.
The technical robustness.
The latter can be high or low regarding issues of overfit-ting and sensitivity to noisy data or outliers. The former can be high or low as well, depending on the type of the generat-ed model, i. e., pattern. Black-box patterns are effectively
incomprehensible for the user as they don’t provide a struc-tural description, e. g., support vector machines. In contrast, structural patterns are comprehensible as their construction reveals the structure of the problem, e. g., decision rules [25].
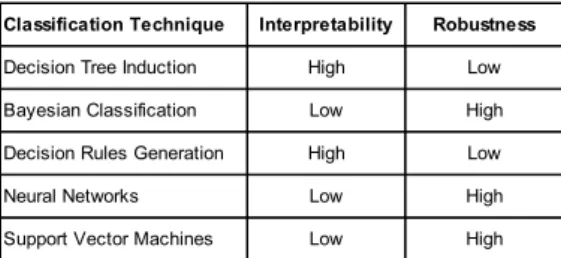
Table I shows major classification techniques as well as a qualitative rating for their robustness and interpretability based on a literature review, esp. [28], [25].
Most importantly, the metric-oriented RCA requires a high interpretability of the employed data mining technique as the generated models are not used for forecasts but consti-tute the actual result presented to the user. Moreover, a high robustness is desirable to minimize the impact of noisy data and prevent overfitting, that is, an overadaption of the gen-erated model to the given training data.
Bayesian classification, neural networks as well as support vector machines generate black-box patterns, thus, their interpretability is comparably low and hence they are not suited for the metric-oriented RCA.
Data Integration Analytics Presentation
Pattern Detection
Manufacturing Warehouse Cockpit
Decision Tree Induction
Data Transformation
Denormalization Filtering
Fig. 3. Technical layers for root cause analysis
nonleaf node represents a test on an attribute, each branch denotes an outcome of the test and each leaf node shows a class label. In general, decision trees can be converted into a set of decision rules as well, by traversing the path from the root node to a leaf node [28].
Decision rule generation itself alludes to the direct genera-tion of decision rules without generating a decision tree. An exemplary decision rule could be: If employee E takes part in production step S and machine M is used in production step T then lead times are too high.
For the implementation of the metric-oriented RCA we re-ly on decision tree induction as suitable classification tech-nique due to its high interpretability and the possibility to deduce decision rules. Yet, additional concepts, esp. pruning methods, have to be employed to improve the robustness of decision tree algorithms.
C. Prototypical Implementation and First Proof of Concept
Our current prototype implements a basic version of the manufacturing warehouse as well as the metric-oriented RCA and is based on a dashboard-like GUI. The user selects a process and corresponding metrics, e. g., lead time or First Pass Yield, which are represented as speedometers showing coloured value ranges for each category. That’s enough to start the metric-oriented RCA. Considering configuration options, the user can activate tree pruning as well as attribute filtering. Both simplify the generated tree to enhance its interpretability.
In the following, we give a short overview of the
proto-type’s architecture that we introduced in [7]. On this basis, we detail on data transformation and pattern detection as the essential components for the realization of the metric-oriented RCA. Finally, we present a first proof of concept.
Our implementation consists of three technical layers required for the metric-oriented RCA (see Fig. 3): The Data Integra-tion Layer comprises a relational version of the Manufacturing Warehouse. Moreover, we rely on Java using the WEKA data mining Framework [33] to im-plement not only the Presenta-tion Layer, i. e., the Cockpit, but the actual Analytics Layer as well. The latter comprises Data Transformation, i. e., Denor-malization and Filtering, as well as Pattern Detection, i. e., Deci-sion Tree Induction.
In general, the multidimensional Manufacturing Ware-house takes an activity-centric view with production step executions as central facts characterized by various dimen-sions. Obligatory flow dimensions describe the process flow over time and comprise necessary information about time and process aspects, like the start of a production step and the manufacturing process it belongs to. Optional context dimensions comprise additional information regarding em-ployed resources like machines, manufacturing aids and
production workers as well as input output information like occurred failures, processed input material and generated environmental emissions.
Both pattern detection and data transformation take a dy-namic view on the data basis. That is, they only assume a set of core attributes provided by flow dimensions. All other attributes provided by context dimensions, e. g., information on employed machines, are treated dynamically, i. e., they are automatically used when they are available. This is be-cause concrete data sources vary significantly in heterogene-ous manufacturing environments, thus, different warehheterogene-ouse models result in individual cases.
Based on the concrete relational Manufacturing Ware-house schema, the metric-oriented RCA requires data denormalization, data filtering and decision tree induction.
Generally speaking, classification is based on training da-ta, i. e., tuples with so called independent attributes and an additional class label, the dependent attribute. Classification then computes a model, in our case a decision tree, to de-scribe the correlation between the dependent attribute and the independent attributes. In the case of the metric-oriented RCA, the dependent attribute is the categorized metric with one nominal value per process execution. All available at-tributes in the Manufacturing Warehouse which potentially are of explanatory nature for the user regarding the process executions are automatically used as independent attributes, e. g., information about employed machines and workers. It is important to notice that further metrics, e g., wait time, are excluded from the selection of independent attributes as they do not represent actual influence factors, only aggregated hints.
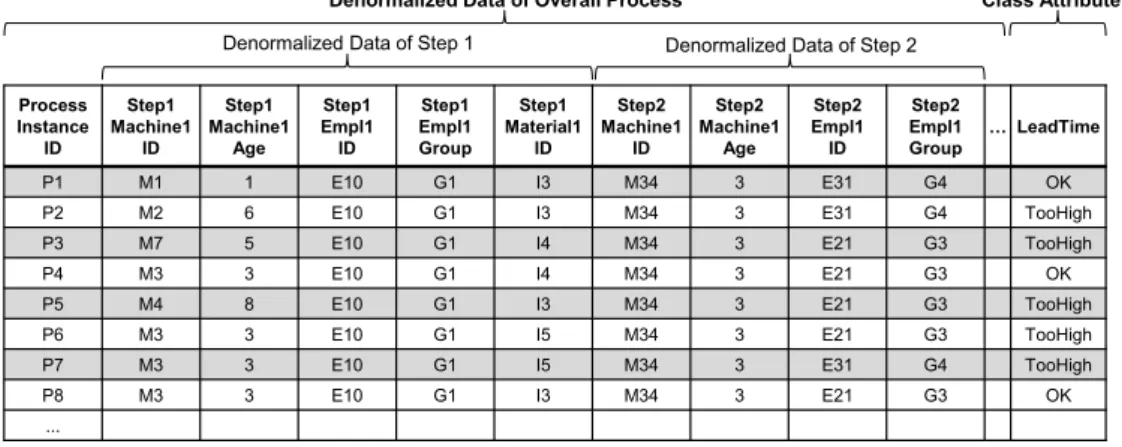
The data provided by the Manufacturing Warehouse have to be denormalized to get one tuple per process execution as input for filtering and decision tree induction. Denormaliza-tion comprises three steps:
1. All data concerning the execution of each step of the whole process are denormalized. That is, information from all dimensions describing the execution of a step like input material or employed machines is denormal-ized. In this context, it has to be taken into account that each step is associated with different dimensions in a many-to-many relation, because, for example, an arbi-trary number of machines and workers can be employed in a step. Thus, denormalization has to be implemented dynamically without knowing the denormalized rela-tional target structure in advance.
2. The denormalized step execution data are merged at the level of the whole process to get one tuple per process execution comprising all production steps.
3. The class attribute, i. e., the categorized metric value for each process execution, is added.
LT too high
Step_1_Machine_1_Age
Step_1_Material_1_ID
Step_2_Empl_1_Group
LT too high
LT too high
LT OK = G4 != G4
= I5 != I5
> 3 <= 3
Fig. 5. Exemplary decision tree of a metric-oriented root cause analysis Process
Instance ID
Step1 Machine1
ID
Step1 Machine1
Age
Step1 Empl1 ID
Step1 Empl1 Group
Step1 Material1
ID
Step2 Machine1
ID
Step2 Machine1
Age
Step2 Empl1 ID
Step2 Empl1 Group
…LeadTime
P1 M1 1 E10 G1 I3 M34 3 E31 G4 OK
P2 M2 6 E10 G1 I3 M34 3 E31 G4 TooHigh
P3 M7 5 E10 G1 I4 M34 3 E21 G3 TooHigh
P4 M3 3 E10 G1 I4 M34 3 E21 G3 OK
P5 M4 8 E10 G1 I3 M34 3 E21 G3 TooHigh
P6 M3 3 E10 G1 I5 M34 3 E21 G3 TooHigh
P7 M3 3 E10 G1 I5 M34 3 E31 G4 TooHigh
P8 M3 3 E10 G1 I3 M34 3 E21 G3 OK
...
Class Attribute
Denormalized Data of Step 2 Denormalized Data of Step 1
Denormalized Data of Overall Process
Fig. 4. Exemplary denormalized input data for decision tree induction
emissions like CO2 generation or power consumption of production steps are omitted. The categorized metric lead time takes the values “OK” and “TooHigh” and is added as class attribute based on the metric value for each process execution.
In our prototype we implemented data denormalization using dynamically generated SQL statements in combination with relational views to define and populate the denormal-ized target data structure.
Based on the denormalized data structure data filtering re-fers to the reduction of attributes used for decision tree in-duction. The aim is to focus on core attributes that signifi-cantly influence the value of the class attribute to simplify the resulting decision tree and thus enhance its comprehen-sibility from a user point of view. For the sake of simplicity, we use the standard WEKA attribute selection filter [33] to implement data filtering in our prototype as it does not re-quire any parameterization by the user.
For the actual decision tree induction we rely on WEKA’s
implementation of the classic C4.5 algorithm [34] as it can handle continuous and discrete attributes and includes suita-ble pruning techniques. To improve the understandability of the generated decision tree, we construct binary trees which have exactly two branches per nonleaf node.
To demonstrate the overall applicability, we did a first proof of concept of our prototype as part of two master the-ses [35], [24]. Based on case study investigations, esp. [36], we defined a sample scenario for a typical manufacturing process, the production of steel springs for the automotive industry. Moreover, we identified exemplary factors influ-encing time and quality aspects, like the use of old machines. We generated corresponding synthetic data to populate the Manufacturing Warehouse and conducted metric-oriented RCAs on lead times and on quality rates of the process. An exemplary simplified decision tree based on the depicted denormalized input data is shown in Fig. 5. It represents the result of a metric-oriented RCA on lead times. From this decision tree, the following exemplary decision rules result:
If the first machine in step 1 is older than 3 years, then lead times are typically too high.
If the first machine in step 1 is not older than 3 years but input material I5 is used, then lead times are typically too high.
If the first machine in step 1 is not older than 3 years and input material I5 is not used but the first employee in step 2 does not belong to group G4, then lead times are typically too high.
These decision rules represent valid indications for pro-cess optimization, e. g., not to use machines older than 3 years in step 1 to avoid high lead times. Our initial proof of concept shows the fundamental feasibility and usefulness of Indication-based Manufacturing Optimization on the basis of the Manufacturing Warehouse and encourages further de-velopment and evaluation based on industry scenarios.
V. CONCLUSION AND FUTURE WORK
In this article we detailed Indication-based Manufacturing Optimization as a novel data mining-driven approach for process optimization provided by the Advanced Manufactur-ing Analytics Platform. We defined conceptual use cases and described implementation details.
In our future work, we plan to refine and implement fur-ther use cases for indication-based optimization. Moreover, we are going to work on the definition and formalization of manufacturing-specific optimization patterns and develop a corresponding optimization methodology. The aim is to also establish pattern-based optimization in manufacturing build-ing on our current work.
REFERENCES
[1] F. Jacob and G. Strube. “Why Go Global? The Multinational Imper
a-tive," in Global production. E. Abele, T. Meyer, U. Naeher, G. Strube and R. Sykes, Eds. Berlin u.a.: Springer, 2008, pp. 2–33.
[2] N. Slack, S. Chambers and R. Johnston. "Operations Management," 6th ed. Harlow: Financial Times Prentice Hall, 2010.
[3] F. Niedermann, S. Radeschütz and B. Mitschang. “Business Process Optimization Using Formalized Optimization Patterns," in Proceed-ings of Business Information Systems 2011. Berlin: Springer, 2011, pp. 123–135.
[4] M. z. Muehlen and R. Shapiro. “Business Process Analytics," in
Handbook on Business Process Management 2. J. Vom Brocke and M. Rosemann, Eds. Berlin: Springer, 2010, pp. 137–158.
[5] J. Kletti, Ed. "Manufacturing Execution Systems – MES," Berlin: Springer, 2007.
[6] T. Connolly, C. E. Begg and R. Holowczak. "Business database systems," New York: Addison-Wesley, 2008.
[7] C. Gröger, F. Niedermann, H. Schwarz and B. Mitschang. “Suppor t-ing Manufacturt-ing Design by Analytics. Continuous Collaborative Process Improvement enabled by the Advanced Manufacturing Ana-lytics Platform," to appear in Proceedings of CSCWD 2012. 2012. [8] F. Niedermann, S. Radeschütz and B. Mitschang. “Deep Business
Optimization: A Platform for Automated Process Optimization," in
INFORMATIK 2010 Proceedings of ISSS and BPSC 2010. Bonn: Gesellschaft für Informatik, 2010, pp. 168–180.
[9] F. Niedermann and H. Schwarz. “Deep Business Optimization: Making Business Process Optimization Theory Work in Practice," in
Proceedings of the 12th International Conference, BPMDS 2011, and 16th International Conference, EMMSAD 2011, CAiSE 2011. Berlin: Springer, 2011, pp. 88–102.
[10] F. Niedermann, H. Schwarz and B. Mitschang. “Managing Insights - A Repository for Process Analytics, Optimization and Decision Sup-port," in Proceedings of the International Conference on Knowledge Management and Information Sharing (KMIS) 2011. Paris: SciTe-Press, 2011, to appear.
[11] K. Wang, S. Tong and B. Eynard. “Review on Application Data
Mining in Product Design and Manufacturing," in Proceedings of the Fourth International Conference on Fuzzy Systems and Knowledge Discovery : FSKD 2007. Los Alamitos: IEEE Computer Society, 2007, pp. 613–618.
[12] J. A. Harding, M. Shahbaz, Srinivas and A. Kusiak. “Data Mining in
Manufacturing: A Review," Journal of Manufacturing Science and Engineering, vol. 128 (4), pp. 969–976, 2006.
[13] M. Polczynski and A. Kochanski. “Knowledge Discovery and Anal
y-sis in Manufacturing," Quality Engineering, vol. 22 (3), pp. 169– 181, 2010.
[14] K. Wang. “Data Mining in Manufacturing: The Nature and Implic
a-tions," in Knowledge enterprise: intelligent strategies in product de-sign, manufacturing, and management. K. Wang, G. L. Kovacs and M. Wozny, Eds. New York: Springer, 2006, pp. 1–10.
[15] S. Oh, J. Han and H. Cho. “Intelligent Process Control System for Quality Improvement by Data Mining in the Process Industry," in Da-ta Mining for Design and Manufacturing: Methods and Applica-tions. Braha. D, Ed. Dordrecht: Kluwer Academic Publishers, 2001, pp. 289–310.
[16] V. A. Skormin, V. I. Gorodetski and I. J. Popyack. “Data Mining Technology for Failure of Prognostic of Avionics," IEEE Transac-tions on Aerospace and Electronic Systems, vol. 38 (2), pp. 388–403, 2002.
[17] W. C. Chen, S. S. Tseng and C. Y. Wang. “A novel manufacturing defect detection method using association rule mining techniques,"
Expert Systems with Applications, vol. 29 (4), pp. 807–815, 2005.
[18] L. Shen, F. E. H. Tay, L. S. Qu and Y. Shen. “Fault Diagnosis Using
Rough Set Theory," Computers in Industry, vol. 43 (1), pp. 61–72, 2000.
[19] D. Batanov, N. Nagarur and P. Nitikhunkasem. “EXPERT-MM: A
knowledge-based system for maintenance management," Artificial In-telligence in Engineering, vol. 8 (4), pp. 283–291, 1993.
[20] C. J. Romanowski and R. Nagi. “Analysing Maintenance Data Using
Data Mining Methods," in Data Mining for Design and Manufactur-ing: Methods and Applications. Braha. D, Ed. Dordrecht: Kluwer Academic Publishers, 2001, pp. 235–254.
[21] R. Belz and P. Mertens. “Combining knowledge-based systems and simulation to solve rescheduling problems," Decision Support Sys-tems, vol. 17 (2), pp. 141–157, 1996.
[22] Srinivas, J. A. Harding and M. Shahbaz. “Agent Oriented Planning Using Data Mined Knowledge," in ICE2004. Nottingham: Centre for Concurrent Enterprising, University of Nottingham, 2004, pp. 301– 307.
[23] H.-B. Kuntze, T. Bernard, G. Bonn and C. W. Frey. “Entscheidung
s-unterstützung im Produktionsumfeld mit Data-Mining-Werkzeugen," in Automation 2008. Tagung Baden-Baden, 3. und 4. Juni 2008.
Düsseldorf: VDI-Verlag, 2008, pp. 349–352.
[24] J. Schlaudraff. “Design and implementation of an integrated data layer for manufacturing process data. Master thesis, University of Stuttgart," Stuttgart, 2011.
[25] M. Castellanos, F. Casati, D. Umeshwar and S. Ming-Chien. “A Comprehensive and Automated Approach to Intelligent Business Processes Execution Analysis," Distributed and Parallel Databases, vol. 16 (3), pp. 239–273, 2004.
[26] W. v. d. Aalst. "Process mining - Discovery, conformance and en-hancement of business processes,” Heidelberg: Springer, 2011. [27] D. Grigori, F. Casati, M. Castellanos, U. Dayal and M. S. M. Sayal.
“Business Process Intelligence," Computers in Industry, vol. 53 (3), pp. 321–343, 2004.
[28] J. Han and M. Kamber. "Data Mining: Concepts and Techniques," 2nd ed. San Francisco: Morgan Kaufmann, 2006.
[29] J. M. Nicholas. "Competitive manufacturing management. Continu-ous improvement, lean production, customer-focused quality," Bos-ton: Irwin, 1998.
[30] R. D. Snee. “Six–Sigma: the evolution of 100 years of business
improvement methodology," International Journal of Six Sigma and Competitive Advantage, vol. 11 (1), pp. 4–20, 2004.
[31] Lee. J. “E-manufacturing—fundamental, tools, and transformation,"
Robotics and Computer Integrated Manufacturing, vol. 19 (6), pp. 501–507, 2003.
[32] T. Berlec, P. Potocnik, E. Govekar and M. Starbek. “Forecasting lead
times of production orders in sme's," Iranian Journal of Science and Technology, vol. 34 (B5), pp. 111–134, 2010.
[33] M. Hall, E. Frank, G. Holmes, B. Pfahringer, P. Reutemann and I. H. Witten. “The WEKA Data Mining Software: an Update," SIGKDD Explorations, vol. 11 (1), pp. 10–18, 2009.
[34] R. Quinlan. "C4.5: Programs for Machine Learning.". San Mateo: Morgan Kaufmann Publishers, 1993.
[35] C. Gröger. “Design and prototypical implementation of a Manufa
c-turing Analytics reference architecture. Master thesis, University of Stuttgart," Stuttgart, 2011.