Haemorrhage: A Nationwide Cohort Study in The
Netherlands
Joost F. von Schmidt auf Altenstadt1, Chantal W. P. M. Hukkelhoven2, Jos van Roosmalen1,3,
Kitty W. M. Bloemenkamp1*
1Department of Obstetrics, Leiden University Medical Centre, Leiden, The Netherlands,2The Netherlands Perinatal Registry, Utrecht, The Netherlands,3Department of Medical Humanities, EMGO Institute for Health and Care Research, VU University Medical Centre, Amsterdam, The Netherlands
Abstract
Background:Postpartum haemorrhage is a leading cause of maternal morbidity and mortality worldwide. Identifying risk indicators for postpartum haemorrhage is crucial to predict this life threatening condition. Another major contributor to maternal morbidity and mortality is eclampsia. Previous studies show conflicting results in the association between pre-eclampsia and postpartum haemorrhage. The primary objective of this study was to investigate the association between pre-eclampsia and postpartum haemorrhage. Our secondary objective was to identify other risk indicators for postpartum haemorrhage in the Netherlands.
Methods:A nationwide cohort was used, containing prospectively collected data of women giving birth after 19 completed weeks of gestation from January 2000 until January 2008 (n = 1 457 576). Data were extracted from the Netherlands Perinatal Registry, covering 96% of all deliveries in the Netherlands. The main outcome measure, postpartum haemorrhage, was defined as blood loss of$1000 ml in the 24 hours following delivery. The association between pre-eclampsia and postpartum haemorrhage was investigated with uni- and multivariable logistic regression analyses.
Results:Overall prevalence of postpartum haemorrhage was 4.3% and of pre-eclampsia 2.2%. From the 31 560 women with pre-eclampsia 2 347 (7.4%) developed postpartum haemorrhage, compared to 60 517 (4.2%) from the 1 426 016 women without pre-eclampsia (odds ratio 1.81; 95% CI 1.74 to 1.89). Risk of postpartum haemorrhage in women with pre-eclampsia remained increased after adjusting for confounders (adjusted odds ratio 1.53; 95% CI 1.46 to 1.60).
Conclusion:Women with pre-eclampsia have a 1.53 fold increased risk for postpartum haemorrhage. Clinicians should be aware of this and use this knowledge in the management of pre-eclampsia and the third stage of labour in order to reach the fifth Millenium Developmental Goal of reducing maternal mortality ratios with 75% by 2015.
Citation:von Schmidt auf Altenstadt JF, Hukkelhoven CWPM, van Roosmalen J, Bloemenkamp KWM (2013) Pre-Eclampsia Increases the Risk of Postpartum Haemorrhage: A Nationwide Cohort Study in The Netherlands. PLoS ONE 8(12): e81959. doi:10.1371/journal.pone.0081959
Editor:Andrew Dewan, Yale School of Public Health, United States of America ReceivedApril 8, 2013;AcceptedOctober 18, 2013;PublishedDecember 18, 2013
Copyright:ß2013 von Schmidt auf Altenstadt et al. This is an open-access article distributed under the terms of the Creative Commons Attribution License, which permits unrestricted use, distribution, and reproduction in any medium, provided the original author and source are credited.
Funding:The authors have no support or funding to report.
Competing Interests:The authors have declared that no competing interests exist. * E-mail: [email protected]
Introduction
Postpartum haemorrhage (PPH) accounts for 25–35% of all maternal deaths worldwide. [1,2] Unfortunately, varying defini-tions exist. The World Health Organization defines PPH as blood loss$500 ml in the first 24 hours after delivery, although in high resources settings a definition of$1000 ml blood loss seems more suitable. [3–6] Main causes of PPH are uterine atony, retained placenta, maternal soft tissue trauma and coagulopathy. [7–9]
Even though in high income countries the maternal mortality ratio is much lower than in low income countries, still 13% results from PPH. [2] Because of low maternal mortality ratios severe acute maternal morbidity has gained interest as a new quality indicator of obstetric care. In a nationwide cohort study in the Netherlands the incidence of major obstetric haemorrhage was 4.5 per 1000 deliveries and the case fatality rate was 1:201 (0.5%). [10]
Clarification of the association between the two most important causes of maternal mortality and morbidity will help improve their prevention and management. Therefore, our objective was to investigate the association between PE and PPH. Our secondary objective was to determine the prevalence and risk indicators for PPH among pregnant women in the Netherlands.
Materials and Methods
Database
We used data from the Netherlands Perinatal Registry, a linked nationwide registry that includes maternal, obstetric, postpartum and neonatal information of each delivery from January 2000 until January 2008. [24–26] Approximately 96% of all births in the Netherlands are entered into this registry.
Definitions
Main outcome measure, PPH, was defined as blood loss of $1000 ml in the 24 hours following delivery. PE was defined as a minimum diastolic blood pressure of 90 mmHg with the presence of proteinuria after 20 weeks of gestation, according to the recommendation of the International Society for the Study of Hypertension in Pregnancy. [27] The registration form contains a field for maximum diastolic blood pressure and an option for proteinuria "yes" or "no" with a field for the amount of proteinuria. The definition of PE was based on the presence of proteinuria rather than$0.3 g/day, since 24.0% of women with proteinuria had a missing field for "amount of proteinuria". Women in primary care are referred to secondary care if proteinuria is present or diastolic blood pressure is over 95 mmHg or if the combination of more than 90 mmHg with complaints exists. In primary care all women with a diastolic blood pressure of 90 mmHg are checked more frequently and controlled for proteinuria according to existing guidelines. [28] In addition we defined severe PE as eclampsia or PE with blood pressure $110 mmHg or proteinuria $5 grams or gestational age of less than 32 weeks.
Characteristics
We evaluated maternal, pregnancy, labour and postpartum characteristics. Maternal characteristics included age at the time of delivery, categorised into six groups:,20, 20–24, 25–29, 30–34, 35–39 or $40 years. Parity was grouped as either nulliparous, parous (para 1–4), or grand multiparous (para $5). Ethnicity included the categories European descent and non-European descent, in which the options Dutch and other European represented the European descent group. Socioeconomic status was categorised into high, middle or low by using mean household income levels of a neighborhood, which was determined with the first four digits of the postal code, using data from the Netherlands Institute for Social Research. [29]
Pregnancy characteristics were multiple pregnancy (defined as "yes" or "no"), and gestational age, categorised as early preterm (#31 weeks), late preterm (32–36 weeks), term (37–41 weeks) or post term ($42 weeks) birth.
Labour characteristics included fetal presentation, defined as vertex, breech or other (transverse, face and other presentations). Onset of labour was defined as whether or not induction or elective caesarean section was performed. Furthermore, duration of ruptured membranes was grouped as , or $12 hours. We defined augmented labour as "yes" or "no" and prolonged expulsive phase of labour as,or$60 minutes. Mode of delivery was categorised as spontaneous delivery, assisted vaginal delivery (vacuum, forcipal or breech extraction), elective (planned) or
emergency (unplanned) caesarean section. In the Netherlands, caesarean sections are recorded differently (planned/unplanned) compared to other countries (elective/emergency). Our system is based on an intention to treat mechanism, implying that a woman is identified as planned (elective) if she was intended to deliver by caesarean, even if she presents in labour. [30] Genital tract injury was defined as perineal tear, episiotomy or both. First degree perineal tears were not classified as genital tract injury. We classified the use of anaesthetics hierarchically, considering the possibility of receiving different types during delivery. Options were: no or primary care medication (non-opioid analgesics and sedatives), opioids, epidural during labour, epidural or spinal anaesthesia at caesarean section or general anaesthesia. If a woman had been given multiple options she was assigned to the highest category.
Postpartum characteristics consisted of manual placenta remov-al ("yes" or "no") and birth weight, categorised into#999, 1000– 1999, 2000–2999, 3000–3999 or$4000 gram.
Statistical analysis
Contingency tables were created to assess frequencies and percentages of the characteristics and the main outcome measure among women with and without PE. Differences were tested with x2-statistics. The characteristics of the excluded women with missing values on PE or PPH were investigated. Univariable logistic regression analysis was performed on all characteristics to identify risk indicators for PPH. The reference category of each variable represented the largest number of women in the population.
The association between (severe) PE and PPH was studied with uni- and multivariable logistic regression, adjusting for maternal age, parity, ethnicity, socioeconomic status, multiple pregnancy, and gestational age. All these indicators have a pathofysiologic explanation for confounding the association of PE with PPH. [31,32] We also assessed presence of effect modification between multiple pregnancy and PE using the likelihood-ratio test.
Even though mode of delivery and induction of labour are important variables in the association of PE and PPH, they are intermediate factors in the causal pathway of the association and were therefore not considered as confounders. [31,32] For that reason we performed subgroup analysis on women with non-induced spontaneous delivery and investigated the other sub-groups for the association between PE and PPH [33].
Seeing an increasing trend of PPH over time the International Postpartum Hemorrhage Collaborative Group recommends countries to publish its yearly prevalence. [6,17,18,34] Also the prevalence of PE has been shown to increase, therefore we analysed yearly prevalences of both PE and PPH. [20] We performed Cochran-Armitage and Jonckheere-Terpstra tests to evaluate possible trends.
Statistical analysis was performed using SAS (version 9.3; SAS Institute, Cary, NC).
Ethics statement
The presented data are anonymised and cannot be related to individual women. The privacy committee of the Netherlands Perinatal Registry approved this study. Further consent and ethical approval is not needed in the Netherlands for this type of study.
Results
478 missing PE, 47 885missing PPH and 7 114 missing PE and PPH; respectively 6.7%, 2.9% and 0.4% of the total population). Tables 1, 2, and 3 show the prevalence of maternal, pregnancy, labour and postpartum characteristics among all women and women with and without PE or PPH, together with corresponding odds ratios (ORs) for PPH.
Overall prevalence of PE was 2.2%. Women with PE were more often nulliparous, had more often multiple pregnancies and had lower gestational age at birth (table 1). Furthermore, women
with PE more often had elective caesarean section, induction and/ or augmentation of labour, a shorter expulsive phase and less often delivered spontaneously (table 2). The groups also differed significantly in genital tract injury, anaesthetic use and manual placenta removal (tables 2 and 3).
In our study population 4.3% of the women suffered from PPH (table 1). From the 31 560 women with PE 2 347 (7.4%) developed PPH, compared to 60 517 (4.2%) from the 1 426 016 women without PE (OR 1.81; 95% CI 1.74 to 1.89, p,0.001).
Table 1.Maternal and pregnancy characteristics of the study population (n = 1.457.576) and the association between these characteristcs and postpartum haemorrhage.
Pre-eclampsia Postpartum haemorrhage Unadjusted odds
Yes* No* Yes* No* Total*
ratio for postpartum haemorrhage
Characteristic n (%) n (%) n (%) n (%) n (%) OR (95% CI)
Pregnant women 31560 (2.2) 1426016 (97.8) 62864 (4.3) 1394712 (95.7) 1457576 (100.0) Maternal characteristics
Maternal age, years{
#19 535 (1.7) 23340 (1.6) 770 (1.2) 23105 (1.7) 23875 (1.6) 0.70 (0.66 to 0.75) 20–24 3519 (11.2) 143912 (10.1) 5149 (8.2) 142282 (10.2) 147431 (10.1) 0.76 (0.74 to 0.78) 25–29 9841 (31.2) 411110 (28.8) 17163 (27.3) 403788 (29.0) 420951 (28.9) 0.90 (0.88 to 0.92) 30–34 11332 (35.9) 563918 (39.6) 25903 (41.2) 549347 (39.4) 575250 (39.5) 1.00 reference 35–39 5342 (16.9) 248610 (17.4) 12091 (19.2) 241861 (17.3) 253952 (17.4) 1.07 (1.04 to 1.09) $40 989 (3.1) 34907 (2.4) 1780 (2.8) 34116 (2.4) 35896 (2.5) 1.13 (1.08 to 1.19)
Missing 2 219 8 213 221
Parity{
0 22006 (69.7) 643195 (45.1) 32592 (51.9) 632609 (45.4) 665201 (45.6) 1.27 (1.25 to 1.29) 1–4 9338 (29.6) 770926 (54.1) 29783 (47.4) 750481 (53.8) 780264 (53.5) 1.00 reference $5 214 (0.7) 11762 (0.8) 481 (0.8) 11495 (0.8) 11976 (0.8) 1.07 (0.98 to 1.16)
Missing 2 133 8 127 135
Ethnicity (European descent)`
No 5002 (15.9) 216407 (15.3) 8914 (14.2) 212495 (15.3) 221409 (15.3) 0.90 (0.88 to 0.92) Yes 26475 (84.1) 1200916 (84.7) 53712 (85.8) 1173679 (84.7) 1227391 (84.7) 1.00 reference
Missing 83 8693 238 8538 8776
Socioeconomic status{
High 6812 (21.9) 333703 (23.7) 15720 (25.4) 324795 (23.6) 340515 (23.7) 1.09 (1.07 to 1.11) Medium 14069 (45.2) 647662 (46.0) 28165 (45.5) 633566 (46.0) 661731 (46.0) 1.00 reference Low 10258 (32.9) 426359 (30.3) 18071 (29.2) 418546 (30.4) 436617 (30.3) 0.97 (0.95 to 0.98)
Missing 421 18292 908 17805 18713
Pregnancy characteristics
Multiple pregnancy{
No 29446 (93.3) 1400362 (98.2) 59492 (94.6) 1370316 (98.3) 1429808 (98.1) 1.00 reference Yes 2114 (6.7) 25654 (1.8) 3372 (5.4) 24396 (1.7) 27768 (1.9) 3.07 (2.96 to 3.17) Gestational age, weeks{
#31+6 2277 (7.3) 14846 (1.0) 1360 (2.2) 15763 (1.1) 17123 (1.2) 2.01 (1.91 to 2.11) 32+0– 36+6 8086 (25.8) 70628 (5.0) 4435 (7.1) 74279 (5.4) 78714 (5.4) 1.37 (1.33 to 1.41) 37+0– 41+6 20680 (65.9) 1262219 (89.0) 52339 (83.7) 1230560 (88.7) 1282899 (88.5) 1.00 reference $42+0 342 (1.1) 70116 (4.9) 4409 (7.0) 66049 (4.8) 70458 (4.9) 1.54 (1.49 to 1.59)
Missing 175 8207 321 8061 8382
*Missing values of postpartum haemorrhage and pre-eclampsia are exluded.
{X2test between pre-eclampsia and no pre-eclampsia, P #0.0001.
`
Table 2.Labour characteristics of the study population (n = 1.457.576) and the association between these characteristcs and postpartum haemorrhage.
Pre-eclampsia Postpartum haemorrhage Unadjusted odds ratio for
Yes* No* Yes* No* Total* postpartum haemorrhage
Characteristic n (%) N (%) n (%) n (%) n (%) OR (95% CI)
Pregnant women 31560 (2.2) 1426016 (97.8) 62864 (4.3) 1394712 (95.7) 1457576 (100.0) Presentation{
Vertex 28405 (90.1) 1346629 (94.5) 59701 (95.0) 1315333 (94.3) 1375034 (94.4) 1.00 reference Breech 2742 (8.7) 69527 (4.9) 2496 (4.0) 69773 (5.0) 72269 (5.0) 0.80 (0.77 to 0.83) Other 382 (1.2) 9327 (0.7) 618 (1.0) 9091 (0.7) 9709 (0.7) 1.54 (1.42 to 1.66)
Missing 31 533 49 515 564
Onset of labour{
Non-induced labour 6700 (21.3) 1146966 (80.5) 46120 (73.6) 1107546 (79.5) 1153666 (79.2) 1.00 reference Induced labour 17438 (55.4) 193983 (13.6) 12945 (20.6) 198476 (14.2) 211421 (14.5) 1.52 (1.49 to 1.55) Elective caesarean 7334 (23.3) 83639 (5.9) 3624 (5.8) 87349 (6.3) 90973 (6.2) 1.02 (0.99 to 1.06)
Missing 88 1428 175 1341 1516
Ruptured membranes, hours{
,12 25617 (86.1) 1134348 (82.9) 47867 (78.5) 1112098 (83.2) 1159965 (83.0) 1.00 reference $12 4132 (13.9) 233257 (17.1) 13117 (21.5) 224272 (16.8) 237389 (17.0) 1.35 (1.32 to 1.37)
Missing 1811 58411 1880 58342 60222
Augmentation of labour{
No 22931 (72.7) 1141004 (80.0) 45180 (71.9) 1118755 (80.2) 1163935 (79.9) 1.00 reference Yes 8629 (27.3) 285012 (20.0) 17684 (28.1) 275957 (19.8) 293641 (20.1) 1.52 (1.50 to 1.55) Expulsive phase, minutes{
,60 27553 (88.0) 1186426 (84.0) 48349 (77.8) 1165630 (84.4) 1213979 (84.1) 1.00 reference $60 3767 (12.0) 225148 (16.0) 13780 (22.2) 215135 (15.6) 228915 (15.9) 1.52 (1.49 to 1.55)
Missing 240 14442 735 13947 14682
Mode of delivery{
Spontaneous delivery 14784 (46.9) 1088924 (76.4) 46376 (74.0) 1057332 (75.9) 1103708 (75.8) 1.00 reference Assisted delivery 3959 (12.6) 144854 (10.2) 9383 (15.0) 139430 (10.0) 148813 (10.2) 1.49 (1.46 to 1.52) Elective caesarean 7334 (23.3) 83639 (5.9) 3624 (5.8) 87349 (6.3) 90973 (6.2) 0.98 (0.95 to 1.08) Emergency caesarean 5453 (17.3) 107304 (7.5) 3275 (5.2) 109482 (7.9) 112757 (7.7) 0.72 (0.70 to 0.74)
Missing 30 1295 206 1119 1325
Genital tract injury{
Episiotomy (no)/perineal tear (no)
23376 (74.1) 1024303 (71.9) 37681 (60.0) 1009998 (72.4) 1047679 (71.9) 1.00 reference
Episiotomy (no)/perineal tear (yes)
364 (1.2) 23953 (1.7) 1679 (2.7) 22638 (1.6) 24317 (1.7) 1.92 (1.83 to 2.01)
Episiotomy (yes)/perineal tear (no)
7714 (24.5) 371807 (26.1) 22933 (36.5) 356588 (25.6) 379521 (26.0) 1.69 (1.66 to 1.71)
Episiotomy (yes)/perineal tear (yes)
84 (0.3) 5473 (0.4) 522 (0.8) 5035 (0.4) 5557 (0.4) 2.68 (2.46 to 2.92)
Missing 22 480 49 453 502
Anaesthesia{
No/primary care medication13797 (43.7) 1075885 (75.4) 45774 (72.8) 1043908 (74.8) 1089682 (74.8) 1.00 reference Opioid analgesics 3449 (10.9) 104489 (7.3) 5939 (9.4) 101999 (7.3) 107938 (7.4) 1.28 (1.24 to 1.31) Epidural during labour 2892 (9.2) 77721 (5.5) 5219 (8.3) 75394 (5.4) 80613 (5.5) 1.27 (1.24 to 1.31) Spinal or epidural at
caesarean
8795 (27.9) 151714 (10.6) 4970 (7.9) 155539 (11.2) 160509 (11.0) 0.75 (0.73 to 0.77)
General anaesthesia 2627 (8.3) 16207 (1.1) 962 (1.5) 17872 (1.3) 18834 (1.3) 1.32 (1.24 to 1.40) *Missing values of postpartum haemorrhage and pre-eclampsia are excluded
The group women with missing values for PE contained more PPH (6.6% compared with 4.3% in the total population), while missing values for PPH showed slightly more PE (2.5% compared with 2.2% in the total population). Investigating the missing values showed no clear tendency for either PPH or PE. Therefore missing data is not expected to be adherent to either the exposure or the outcome measure; the missing data is assumed to be randomly distributed [35]
Table 4 shows the adjusted association between PE and PPH in all women and in a subgroup of women with non-induced spontaneous delivery. Univariably, PE increased the risk of PPH 1.81 fold (95% CI 1.74 to 1.89). After adjustment for confounders we observed a slightly lower but still statistically significant increased risk for PPH (OR 1.53, 95% CI 1.46 to 1.60). In this model non-European descent ethnicity and low socioeconomic status lost their statistical significance. In the subgroup analysis of women with non-induced spontaneous delivery PE increased the risk for PPH (adjusted OR 1.91, 95% CI 1.71 to 2.13; other subgroup analyses are shown in footnotes table 4). Distinguishing the severity of PE showed women with mild PE have a higher increased risk for PPH (adjusted OR 1.67; 95% CI 1.58 to 1.77) than women with severe PE (adjusted OR 1.32; 95% CI 1.23 to 1.42), while the subgroup of non-induced spontaneous deliveries showed reversed results (mild PE, adjusted OR 1.76, 95% CI 1.55 to 2.01; severe PE, adjusted OR 2.36; 95% CI 1.92 to 2.88).
We found no evidence of effect modification between PE and multiple pregnancy.
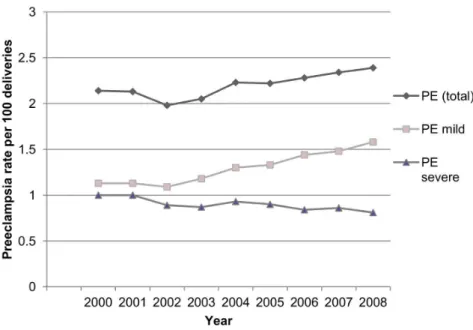
Figure 1 and 2 show the yearly percentages of PE (total, mild and severe) and PPH. There is a statistically significant increase of PE (P,0.0001) and PPH (P,0.0001) over time. We observed a rising trend of mild PE, while the proportion of severe PE gradually declined (P,0.0001).
Discussion
Principal findings
Our study shows an adjusted 1.53 fold increased risk (95% CI 1.46 to 1.60) for developing PPH in women with PE.
Women with PE were more often older, nulliparous, had multiple pregnancies, a lower gestational age and a lower socioeconomic status. These indicators are also associated with increased risk for PPH, which could explain a slight decrease in risk for PPH after adjustment for confounders. [8,11–15,22,36–39] Remarkably non-induced women with PE who delivered vaginally revealed an even stronger adjusted association with PPH (adjusted OR 2.29, 95% CI 2.06 to 2.55). Except for women undergoing elective caesarean section all other subgroups showed women with PE had an increased risk for PPH, suggesting the association is independent for onset of labour or mode of delivery. The observed shift in risk when assessing the severity of PE could indicate a positive side-effect in the management of PE; induction possibly reduces the risk for PPH in women with severe PE.
Our nationwide study population had a prevalence of 2.2% for PE and 4.3% for PPH, similar rates are seen internationally (United States [20], Canada [17,40–42], Scandinavia [43–45], United Kingdom [46], Australia [47,48]). A worrying finding is the rising trend of both PE and PPH. The increase in PE could be explained by a rising prevalence of risk indicators for PE, e.g. high body mass index, hypertension, diabetes mellitus, high maternal age. [17,18,20,34,49] The decreasing trend of severe PE may be attributed to a more aggressive management of PE over the years. The increase in PPH has been studied in many other high resource countries. [6,17,18,34] They state this finding could be explained by an increase in risk indicators (e.g. maternal age, multiple pregnancies, induction of labour, caesarean section). However adjustment for these indicators did not explain the observed trend. Table 3.Postpartum characteristics of the study population (n = 1.457.576) and the association between these characteristcs and postpartum haemorrhage.
Pre-eclampsia Postpartum haemorrhage
Unadjusted odds ratio for
Yes* No* Yes* No* Total*
postpartum haemorrhage
Characteristic n (%) n (%) n (%) n (%) n (%) OR (95% CI)
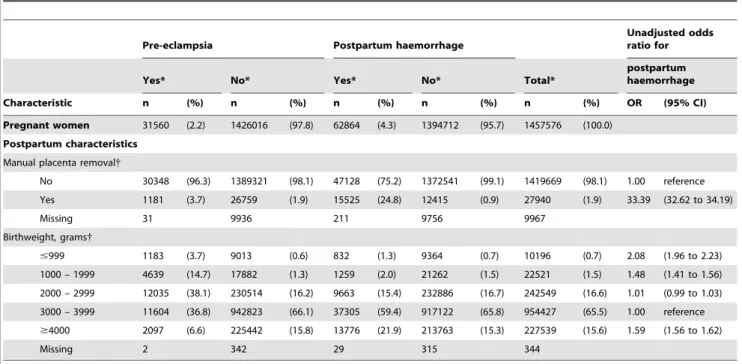
Pregnant women 31560 (2.2) 1426016 (97.8) 62864 (4.3) 1394712 (95.7) 1457576 (100.0) Postpartum characteristics
Manual placenta removal{
No 30348 (96.3) 1389321 (98.1) 47128 (75.2) 1372541 (99.1) 1419669 (98.1) 1.00 reference Yes 1181 (3.7) 26759 (1.9) 15525 (24.8) 12415 (0.9) 27940 (1.9) 33.39 (32.62 to 34.19)
Missing 31 9936 211 9756 9967
Birthweight, grams{
#999 1183 (3.7) 9013 (0.6) 832 (1.3) 9364 (0.7) 10196 (0.7) 2.08 (1.96 to 2.23)
1000 – 1999 4639 (14.7) 17882 (1.3) 1259 (2.0) 21262 (1.5) 22521 (1.5) 1.48 (1.41 to 1.56) 2000 – 2999 12035 (38.1) 230514 (16.2) 9663 (15.4) 232886 (16.7) 242549 (16.6) 1.01 (0.99 to 1.03) 3000 – 3999 11604 (36.8) 942823 (66.1) 37305 (59.4) 917122 (65.8) 954427 (65.5) 1.00 reference $4000 2097 (6.6) 225442 (15.8) 13776 (21.9) 213763 (15.3) 227539 (15.6) 1.59 (1.56 to 1.62)
Missing 2 342 29 315 344
*Missing values of postpartum haemorrhage and pre-eclampsia are excluded.
{
[17,18,34] Another possibility could be an increasing awareness for PPH with subsequently better recognition and registration.
Strengths and weaknesses of the study
A strength of this study is the large population based database with a nationwide and near complete inclusion of all deliveries with detailed information on maternal, pregnancy, labour and postpartum characteristics. Despite the retrospective design data were prospectively collected. To our knowledge this is the largest cohort study on the relation between PE and PPH.
Another positive aspect of this study is the fact that our definitions for PE and PPH are not based on International Classification Disease (ICD) codes. Inaccuracies may occur when
translating definitions to ICD-codes, since they are not thoroughly defined. ICD-codes neglect to take amount of blood loss, blood pressure or amount of proteı¨nuria into account, while diseases may be defined differently between countries, regions or even hospitals. [6] Therefore registration is not unified and coding might be subject to clinical interpretation of the clinician. This also presents our first limitation of the study. Even though our definition is derived from obligated objective items, we had to base the definition of PPH on estimation of blood loss by the caregiver, either weighted or visual. Visual estimation has been shown to underestimate blood loss, suggesting a higher prevalence of PPH than the observed 4.3%. [5,50,51] Furthermore, our overall definition of PE was based on the presence of proteinuria rather Table 4.Multivariate analysis on the association between pre-eclampsia and postpartum haemorrhage and subgroup of women with non-induced spontaneous delivery.
Total cohort Subgroup non-induced spontaneous delivery{
Adjusted odds ratio for postpartum
haemorrhage* Adjusted odds ratio for postpartum haemorrhage*
Risk indicator OR (95% CI) OR (95% CI)
Pre-eclampsia
No 1.00 reference 1.00 reference
Yes 1.53 (1.46 to 1.60) 1.91 (1.71 to 2.13)
Maternal age, years
#19 0.62 (0.58 to 0.67) 0.63 (0.57 to 0.68)
20–24 0.71 (0.69 to 0.73) 0.71 (0.68 to 0.74)
25–29 0.86 (0.84 to 0.88) 0.85 (0.83 to 0.88)
30–34 1.00 reference 1.00 reference
35–39 1.09 (1.07 to 1.11) 1.08 (1.05 to 1.12)
$40 1.15 (1.09 to 1.21) 1.13 (1.05 to 1.21)
Parity
0 1.36 (1.34 to 1.39) 1.48 (1.45 to 1.51)
1–4 1.00 reference 1.00 reference
$5 0.95 (0.87 to 1.05) 0.85 (0.75 to 0.97)
Ethnicity
European descent 1.00 reference 1.00 reference
Non-European descent 1.02 (0.99 to 1.04) 1.04 (1.01 to 1.07)
Socioeconomic status
High 1.07 (1.05 to 1.09) 1.08 (1.05 to 1.11)
Medium 1.00 reference 1.00 reference
Low 1.00 (0.98 to 1.02) 1.01 (0.99 to 1.04)
Multiple pregnancy
No 1.00 reference 1.00 reference
Yes 2.88 (2.77 to 3.00) 2.36 (2.18 to 2.54)
Gestational age, weeks
#31+6 1.53 (1.44 to 1.62) 2.15 (1.98 to 2.34)
32+0– 36+6 1.05 (1.02 to 1.09) 1.16 (1.11 to 1.22)
37+0– 41+6 1.00 reference 1.00 reference
$42+0 1.56 (1.51 to 1.61) 1.68 (1.58 to 1.79)
*Adjusted for pre-eclampsia, maternal age, parity, ethnicity, socioeconomic status, multiple pregnancy and gestational age.
{
Adjusted risk of pre-eclampsia for postpartum haemorrhage in other subgroups: Subgroup induced assisted delivery OR 2.02 (95% CI; 1.68 to 2.44). Subgroup non-induced emergency caesarean section OR 1.55 (95% CI; 1.16 to 2.06). Subgroup non-induced spontaneous delivery OR 1.46 (95% CI; 1.36 to 1.58). Subgroup non-induced assisted delivery OR 1.61 (95% CI; 1.41 to 1.84). Subgroup induced emergency caesarean section OR 1.40 (95% CI; 1.17 to 1.68). Subgroup elective caesarean section OR 0.98 (95% CI; 0.86 to 1.12).
than a measured amount. Since dipstick urinalysis of protein is not 100% accurate, [52] we performed a sensitivity analysis in women with a known amount of proteinuria, now defining PE with the amount of proteinuria instead of the presence ($0.3 g/day). This showed robustness of our findings (adjusted OR 1.49; 95% CI 1.42 to 1.57). Caution is justified in interpreting our results based on severity of PE. As there is a high percentage of missing values for proteinuria some severe PE cases could have been misclassified as mild. Yet other studies show similar results in the observed trends. [20]
Another limitation is the 6.7% women whose information on PE was missing. Characteristics of these women did not clearly correspond to either the PE or the non-PE group. A biased estimation of the association between PE and PPH is not expected, as complete case analysis with adjustment for covariates covering randomly distributed missing data (MAR), has been shown to estimate unbiased results. [35]
The perinatal registry does not contain valid or complete information on body mass index, previous PPH, previous caesarean section and certain medical disorders (e.g. coagulopa-thy, diabetes mellitus, cardiovascular diseases). These risk indica-tors have an increased risk for PE, PPH or both, therefore possibly confounding the observed association. [8,11,19,53] However the role of body mass index on PPH is not clear yet. [54] Another possible and not registered confounder is magnesium sulphate, since it could, hypothetically, increase blood loss by vasodilatation, a tocolytic effect predisposing to uterine atony, prolonged bleeding time through platelet activity inhibition and red cell deformity and it is used in the Netherlands for the management of (pre-) eclampsia (as prevention in severe PE women (defined as blood pressure $110 mmHg diastolic or $110 mmHg systolic or proteinuria $5 grams or the presence of symptoms prognostic for eclampsia) or as treatment in women with eclampsia). Rouse et al determined an increased risk for PPH in hypertensive disorders
Figure 1. Annual rates of pre-eclampsia (PE), 2000–2008.
doi:10.1371/journal.pone.0081959.g001
Figure 2. Annual rates of postpartum haemorrhage (PPH), 2000–2008.
which disappeared after correction for magnesium sulphate. [55] However a recent published systematic review showed no significantly increased risk for PPH. [56]
Findings in relation to other studies
Association pre-eclampsia and postpartum haemor-rhage. Most other studies evaluate multiple risk indicators for PPH, in which PE is one of many. Results are however inconsistent, varying from no significant association after adjust-ment for confounders to a two to five fold increased risk [8,11,12,14–16,22,37,38,55,57]. Nevertheless, results are difficult to compare since various definitions for PPH are used in combination with different ways to estimate blood loss values. Only one study focused on the relation of PE and PPH. In a cohort study of 315 085 singleton pregnancies, Eskild et al showed an increased risk for PPH in women with PE ($500 ml blood loss, OR 1.94 95% CI 1.87 to 2.02 and for$1500 ml blood loss OR 2.20, 95% CI 1.99 to 2.45) [21]. Similar results were found in nulliparous women with a vaginal mode of delivery. However they did not adjust for age, ethnicity, gestational age or socioeconomic status. Neither did they evaluate subgroups of women with and without induction of labour.
Other risk indicators for postpartum haemorrhage.
Comparing our findings with other studies apart from PE as risk indicator, we see similar increased risks for older women, multiple pregnancy, birth weight $4000 grams, prolonged ruptured membranes and prolonged expulsive phase. [8,11–16,22,36–39,58] In contrast with other studies, only great grand multiparas (para $10) had an increased risk for PPH (OR 1.57, 95% CI 1.12 to 2.20) when compared with multiparas (para 1–4). Other studies showed similar results, suggesting a possible linear relationship. [8,59,60]
An unexpected finding was the decreased risk for PPH after emergency caesarean sections. Other studies showed increased risks, which is more likely since this group often suffers from predisposing indicators for PPH, such as prolonged labour. [8,15,37,57,61] Possibly, emergency caesarean sections were misclassified as elective due to the intention to treat reporting of caesarean deliveries in the Netherlands. [30] In addition, PPH may be underreported in caesarean sections, [62] which can be expected more often in emergency situations. This could have confounded the risk of PPH in preeclampsia in our total group of women, however, the increased risk persisted in the subgroup-analysis of women who had non-induced spontaneous deliveries.
Meaning of the study
This study indicates a strong relationship between the two most important causes of maternal mortality and morbidity worldwide: PE and PPH. This is an important finding in relation to the alarming notion that there is a rising incidence of both PE and PPH. Even though this study shows an efficient management for PE, the rising overall prevalence of PE and PPH indicates these problems have not been resolved. [17,18,20,34] Optimising
prevention and management of these conditions continues being of utmost importance. A higher awareness is indicated during the third stage of labour in a women with PE. Also other preventive and therapeutic measures should be considered, such as easy access to second-line uterotonics, materials for tamponade and packed cells.
Considering the complexity of PE with vascular changes and hemoconcentration in conjunction with the consequences of PPH leading to transfusion, embolisation or surgery, a combination of these two conditions forms a strong indication for a multidisci-plinary approach, consisting of obstetric, anaesthetic, radiological and internal support.
Future research
The most important question arising while studying the literature was the variation in risk of indicators for PPH. This can be attributed to the heterogeneity of all studies on PPH, consisting of varying study populations, definitions and statistical analyses performed. A uniform research definition is important to create comparable studies on PPH. With more homogenous studies prediction models for PPH could be formed, from which clinical implications can be drawn. Future research should therefore be on a universally acceptable definition and on prediction models for PPH with internal and external validations. Further research in the pathogenesis of PE is also important in discerning the association of PE and PPH.
Finally, the observed trends in both PE and PPH should be investigated more detailed to discern whether the Dutch nation-wide data can explain these discomforting findings. A study investigating trends for PPH in the Netherlands is currently in production.
Conclusions
In conclusion, our study shows an association between PE and PPH; women with PE have a 1.53 fold increased risk for PPH in the Netherlands. Clinicians should be aware of this increased risk and use this knowledge in the management of PE and the third stage of labour in order to reach the fifth Millennium Develop-mental Goal.
Acknowledgments
The authors would like to thank the Netherlands Perinatal Registry (PRN) for granting us the opportunity to analyze and publish its data. We would also like to thank Dr Frederike J. de Weger for her help with data analysis.
Author Contributions
Conceived and designed the experiments: JFS CWPMH JvR KWMB. Performed the experiments: JFS CWPMH. Analyzed the data: JFS CWPMH JvR KWMB. Contributed reagents/materials/analysis tools: CWPMH. Wrote the paper: JFS CWPMH JvR KWMB.
References
1. Bhutta ZA, Chopra M, Axelson H, Berman P, Boerma T, et al. (2010) Countdown to 2015 decade report (2000–2010): taking stock of maternal, newborn and child survival. Lancet 376: 2032–44. 10.1016/S0140-6736(10)60678-2 [doi].
2. Khan KS, Wojdyla D, Say L, Gulmezoglu AM, Van Look PF (2006) WHO analysis of causes of maternal death: a systematic review. Lancet 367: 1066– 1074. S0140-6736(06)68397-9 [pii];10.1016/S0140-6736(06)68397-9 [doi]. 3. World Health Organization (2009) WHO guidelines for the management of
postpartum haemorrhage and retained placenta. Geneva: WHO Press. Available: http://apps.who.int/rhl/guidelines/postpartum_haemorrhage/en/. Accessed December 12th 2012.
4. RCOG (2011) Prevention and management of postpartum haemorrhage (Green-top 52). London: RCOG. Available: http://www.rcog.org.uk/files/ rcog-corp/GT52PostpartumHaemorrhage0411.pdf. Accessed December 12th 2012.
5. Stafford I, Dildy GA, Clark SL, Belfort MA (2008) Visually estimated and calculated blood loss in vaginal and cesarean delivery. Am J Obstet Gynecol 199: 519–7. S0002-9378(08)00501-2 [pii];10.1016/j.ajog.2008.04.049 [doi]. 6. Knight M, Callaghan WM, Berg C, Alexander S, Bouvier-Colle MH, et al.
Collaborative Group. BMC Pregnancy Childbirth 9: 55. 1471-2393-9-55 [pii];10.1186/1471-2393-9-55 [doi].
7. Doran JR, O’Brien SA Jr, Randall JH (1955) Repeated postpartum hemorrhage. Obstet Gynecol 5: 186–192.
8. Al-Zirqi I, Vangen S, Forsen L, Stray-Pedersen B (2008) Prevalence and risk factors of severe obstetric haemorrhage. BJOG 115: 1265–1272. BJO1859 [pii];10.1111/j.1471-0528.2008.01859.x [doi].
9. Oyelese Y, Ananth CV (2010) Postpartum hemorrhage: epidemiology, risk factors, and causes. Clin Obstet Gynecol 53: 147–156. 10.1097/GRF.0b013e3181cc406d [doi];00003081-201003000-00016 [pii].
10. Zwart JJ, Richters JM, Ory F, Bloemenkamp KW, van Roosmalen J et al. (2008) Severe maternal morbidity during pregnancy, delivery and puerperium in the Netherlands: a nationwide population-based study of 371,000 pregnancies. BJOG 115: 842–850. BJO1713 [pii];10.1111/j.1471-0528.2008.01713.x [doi]. 11. Combs CA, Murphy EL, Laros RK Jr (1991) Factors associated with postpartum
hemorrhage with vaginal birth. Obstet Gynecol 77: 69–76.
12. Sheiner E, Sarid L, Levy A, Seidman DS, Hallak M (2005) Obstetric risk factors and outcome of pregnancies complicated with early postpartum hemorrhage: a population-based study. J Matern Fetal Neonatal Med 18: 149–154. N458603137265X73 [pii];10.1080/14767050500170088 [doi].
13. Bais JM, Eskes M, Pel M, Bonsel GJ, Bleker OP (2004) Postpartum haemorrhage in nulliparous women: incidence and risk factors in low and high risk women. A Dutch population-based cohort study on standard (.or = 500 ml) and severe (. or = 1000 ml) postpartum haemorrhage. Eur J Obstet Gynecol Reprod Biol 115: 166–172. 10.1016/j.ejogrb.2003.12.008 [doi];S0301211503006390 [pii]. 14. Magann EF, Evans S, Hutchinson M, Collins R, Howard BC, et al. (2005)
Postpartum hemorrhage after vaginal birth: an analysis of risk factors. South Med J 98: 419–422.
15. Stones RW, Paterson CM, Saunders NJ (1993) Risk factors for major obstetric haemorrhage. Eur J Obstet Gynecol Reprod Biol 48: 15–18.
16. Naef RW III, Chauhan SP, Chevalier SP, Roberts WE, Meydrech EF, et al. (1994) Prediction of hemorrhage at cesarean delivery. Obstet Gynecol 83: 923– 926.
17. Joseph KS, Rouleau J, Kramer MS, Young DC, Liston RM, et al. (2007) Investigation of an increase in postpartum haemorrhage in Canada. BJOG 114: 751–759. BJO1316 [pii];10.1111/j.1471-0528.2007.01316.x [doi].
18. Lutomski JE, Byrne BM, Devane D, Greene RA (2012) Increasing trends in atonic postpartum haemorrhage in Ireland: an 11-year population-based cohort study. BJOG 119: 306–314. 10.1111/j.1471-0528.2011.03198.x [doi]. 19. Steegers EA, von Dadelszen P, Duvekot JJ, Pijnenborg R (2010) Pre-eclampsia.
Lancet 376: 631–644. S0140-6736(10)60279-6 [pii];10.1016/S0140-6736(10)60279-6 [doi].
20. Wallis AB, Saftlas AF, Hsia J, Atrash HK (2008) Secular trends in the rates of preeclampsia, eclampsia, and gestational hypertension, United States, 1987– 2004. Am J Hypertens 21: 521–526. ajh200820 [pii];10.1038/ajh.2008.20 [doi]. 21. Eskild A, Vatten LJ (2009) Abnormal bleeding associated with preeclampsia: a population study of 315,085 pregnancies. Acta Obstet Gynecol Scand 88: 154– 158. 906894794 [pii];10.1080/00016340802613242 [doi].
22. Ohkuchi A, Onagawa T, Usui R, Koike T, Hiratsuka M, et al. (2003) Effect of maternal age on blood loss during parturition: a retrospective multivariate analysis of 10,053 cases. J Perinat Med 31: 209–215. 10.1515/JPM.2003.028 [doi].
23. Young BC, Levine RJ, Karumanchi SA (2010) Pathogenesis of preeclampsia. Annu Rev Pathol 5: 173–192. 10.1146/annurev-pathol-121808-102149 [doi]. 24. Meray N, Reitsma JB, Ravelli AC, Bonsel GJ (2007) Probabilistic record linkage
is a valid and transparent tool to combine databases without a patient identification number. J Clin Epidemiol 60: 883–891. S0895-4356(06)00500-2 [pii];10.1016/j.jclinepi.2006.11.021 [doi].
25. Stichting Perinatale Registratie Nederland. (2008) Perinatal Care in The Netherlands 2006.
26. Tromp M, Ravelli AC, Meray N, Reitsma JB, Bonsel GJ (2008) An efficient validation method of probabilistic record linkage including readmissions and twins. Methods Inf Med 47: 356–363. 08040356 [pii].
27. Brown MA, Lindheimer MD, De Swiet M, Van Assche A, Moutquin JM (2001) The classification and diagnosis of the hypertensive disorders of pregnancy: statement from the International Society for the Study of Hypertension in Pregnancy (ISSHP). Hypertens Pregnancy 20: IX-XIV. 10.1081/PRG-100104165 [doi];10.1081/PRG-100104165 [pii].
28. KNOV NLC (2003) Verloskundige Indicatielijst. Diemen: Verloskundig Vademecum. Available:http://www.knov.nl/docs/uploads/Verloskundig_ Vademecum_2003.pdf. Accessed December 12th 2013.
29. The Netherlands Institute for Social Research (SCP) (2006) Status scores. 30. van Dillen J, Diesch M, Schutte J, Zwart J, van Roosmalen J, et al. (2009)
Comparing grades of urgency for classification of cesarean delivery. Int J Gynaecol Obstet 107: 16–18. S0020-7292(09)00253-7 [pii];10.1016/ j.ijgo.2009.05.001 [doi].
31. Hernan MA, Clayton D, Keiding N (2011) The Simpson’s paradox unraveled. Int J Epidemiol 40: 780–785. dyr041 [pii];10.1093/ije/dyr041 [doi]. 32. Schisterman EF, Cole SR, Platt RW (2009) Overadjustment bias and
unnecessary adjustment in epidemiologic studies. Epidemiology 20: 488–495. 10.1097/EDE.0b013e3181a819a1 [doi];00001648-200907000-00004 [pii]. 33. VanderWeele TJ, Mumford SL, Schisterman EF (2012) Conditioning on
intermediates in perinatal epidemiology. Epidemiology 23: 1–9. 10.1097/ EDE.0b013e31823aca5d [doi];00001648-201201000-00001 [pii].
34. Callaghan WM, Kuklina EV, Berg CJ (2010) Trends in postpartum hemorrhage: United States, 1994–2006. Am J Obstet Gynecol 202: 353-356. S0002-9378(10)00022-0 [pii];10.1016/j.ajog.2010.01.011 [doi].
35. Groenwold RH, Donders AR, Roes KC, Harrell FE, Jr., Moons KG (2012) Dealing with missing outcome data in randomized trials and observational studies. Am J Epidemiol 175: 210–217. kwr302 [pii];10.1093/aje/kwr302 [doi]. 36. Magann EF, Evans S, Hutchinson M, Collins R, Lanneau G, et al. (2005) Postpartum hemorrhage after cesarean delivery: an analysis of risk factors. South Med J 98: 681–685.
37. Bateman BT, Berman MF, Riley LE, Leffert LR (2010) The epidemiology of postpartum hemorrhage in a large, nationwide sample of deliveries. Anesth Analg 110: 1368–1373. ANE.0b013e3181d74898 [pii];10.1213/ANE.0b013e3181d74898 [doi].
38. Combs CA, Murphy EL, Laros RK Jr (1991) Factors associated with hemorrhage in cesarean deliveries. Obstet Gynecol 77: 77–82.
39. Sosa CG, Althabe F, Belizan JM, Buekens P (2009) Risk factors for postpartum hemorrhage in vaginal deliveries in a Latin-American population. Obstet Gynecol 113: 1313–1319. 10.1097/AOG.0b013e3181a66b05 [doi];00006250-200906000-00018 [pii].
40. Allen VM, Joseph K, Murphy KE, Magee LA, Ohlsson A (2004) The effect of hypertensive disorders in pregnancy on small for gestational age and stillbirth: a population based study. BMC Pregnancy Childbirth 4: 17. 10.1186/1471-2393-4-17 [doi];1471-2393-10.1186/1471-2393-4-17 [pii].
41. British Columbia Reproductive Care Program (2006) BCRCP Guideline 11 Hypertension in pregnancy. Available: http://www.perinatalservicesbc.ca/ Guidelines/Guidelines/maternal/obstetrics/default.htm. Accessed February 20th 2013.
42. Xiong X, Demianczuk NN, Saunders LD, Wang FL, Fraser WD (2002) Impact of preeclampsia and gestational hypertension on birth weight by gestational age. Am J Epidemiol 155: 203–209.
43. Dahlstrom BL, Engh ME, Bukholm G, Oian P (2006) Changes in the prevalence of pre-eclampsia in Akershus County and the rest of Norway during the past 35 years. Acta Obstet Gynecol Scand 85: 916–921. 748296054 [pii];10.1080/ 00016340500442449 [doi].
44. Hernandez-Diaz S, Toh S, Cnattingius S (2009) Risk of pre-eclampsia in first and subsequent pregnancies: prospective cohort study. BMJ 338: b2255. 45. Catov JM, Ness RB, Kip KE, Olsen J (2007) Risk of early or severe
pre-eclampsia related to pre-existing conditions. Int J Epidemiol 36: 412–419. dyl271 [pii];10.1093/ije/dyl271 [doi].
46. Knight M (2013) The prevalence of pre-eclampsia is 2.9%, coming from the eclampsia study of the UK Obstetric Surveillance System (UKOSS). Oxford: personal communication on February 28th 2013.
47. Ford JB, Roberts CL, Simpson JM, Vaughan J, Cameron CA (2007) Increased postpartum hemorrhage rates in Australia. Int J Gynaecol Obstet 98: 237–243. S0020-7292(07)00131-2 [pii];10.1016/j.ijgo.2007.03.011 [doi].
48. Le M, Tran B (2010) Perinatal Statistics in Western Australia, 2008: Twenty-sixth Annual Report of the Western Australian Midwives’ Notification System. Department of Health, Western Australia. Available: http://www.health.wa. gov.au/publications/subject_index/p/pregnancy.cfm. Accessed February 20th 2013.
49. Stichting Perinatale Registratie Nederland (2012) Grote Lijnen 10 jaar Perinatale Registratie Nederland. Available: http://www.perinatreg.nl/ verloskunde_in_nederland_grote_lijnen?noCache = 584;1365175549. Accessed February 20th 2013.
50. Prasertcharoensuk W, Swadpanich U, Lumbiganon P (2000) Accuracy of the blood loss estimation in the third stage of labor. Int J Gynaecol Obstet 71: 69– 70. S0020-7292(00)00294-0 [pii].
51. Bose P, Regan F, Paterson-Brown S (2006) Improving the accuracy of estimated blood loss at obstetric haemorrhage using clinical reconstructions. BJOG 113: 919–924. BJO1018 [pii];10.1111/j.1471-0528.2006.01018.x [doi].
52. Waugh JJ, Clark TJ, Divakaran TG, Khan KS, Kilby MD (2004) Accuracy of urinalysis dipstick techniques in predicting significant proteinuria in pregnancy. Obstet Gynecol 103: 769–777. 10.1097/01.AOG.0000118311.18958.63 [doi]; 103/4/769 [pii].
53. Blomberg M (2011) Maternal obesity and risk of postpartum hemorrhage. Obstet Gynecol 118: 561-568. 10.1097/AOG.0b013e31822a6c59 [doi]; 00006250-201109000-00010 [pii].
54. Paglia MJ, Grotegut CA, Johnson LN, Thames B, James AH (2012) Body mass index and severe postpartum hemorrhage. Gynecol Obstet Invest 73: 70–74. 000329335 [pii];10.1159/000329335 [doi].
55. Rouse DJ, Leindecker S, Landon M, Bloom SL, Varner MW, et al. (2005) The MFMU Cesarean Registry: uterine atony after primary cesarean delivery. Am J Obstet Gynecol 193: 1056–1060. S0002–9378(05)01164-6 [pii];10.1016/ j.ajog.2005.07.077 [doi].
56. He´man L, Linden P (2011) Does magnesium sulfate increase the incidence of postpartum hemorrhage? A systematic review. Open Journal of Obstetrics and Gynecology, 1, 168–173. 10.4236/ojog.2011.14032 [doi].
57. Skjeldestad FE, Oian P (2012) Blood loss after cesarean delivery: a registry-based study in Norway, 1999–2008. Am J Obstet Gynecol 206: 76–77. S0002-9378(11)00953-7 [pii];10.1016/j.ajog.2011.07.036 [doi].
59. Shechter Y, Levy A, Wiznitzer A, Zlotnik A, Sheiner E (2010) Obstetric complications in grand and great grand multiparous women. J Matern Fetal Neonatal Med 23: 1211–1217. 10.3109/14767051003615459 [doi]. 60. Maymon E, Ghezzi F, Shoham-Vardi I, Hershkowitz R, Franchi M, et al.(1998)
Peripartum complications in grand multiparous women: para 6-9 versus para. or = 10. Eur J Obstet Gynecol Reprod Biol 81: 21–25. S0301211598001523 [pii].
61. Hager RM, Daltveit AK, Hofoss D, Nilsen ST, Kolaas T, et al. (2004) Complications of cesarean deliveries: rates and risk factors. Am J Obstet Gynecol 190: 428–434. 10.1016/j.ajog.2003.08.037 [doi];S0002937803010937 [pii]. 62. Roberts CL, Ford JB, Thompson JF, Morris JM (2009) Population rates of