Combination of Autoantibody Signature with
PSA Level Enables a Highly Accurate
Blood-Based Differentiation of Prostate Cancer
Patients from Patients with Benign Prostatic
Hyperplasia
Petra Leidinger1, Andreas Keller2, Lisa Milchram4, Christian Harz1, Martin Hart1*, Angelika Werth6, Hans-Peter Lenhof3, Andreas Weinhäusel4, Bastian Keck5, Bernd Wullich5, Nicole Ludwig1☯, Eckart Meese1☯
1Department of Human Genetics, Medical School, Saarland University, Building 60, 66421 Homburg/Saar, Germany,2Chair for Clinical Bioinformatics, Saarland University, Building E.2.1, 66123 Saarbrücken, Germany,3Center for Bioinformatics, Saarland University, Building E.1.1, 66123 Saarbrücken, Germany, 4Austrian Institute of Technology GmbH, Health & Environment Department, 1220 Wien, Austria, 5University Clinic of Urology, Friedrich-Alexander-University Erlangen-Nürnberg, 91054 Erlangen, Germany,6Medical Practice of Urology, 66877 Ramstein-Miesenbach, Germany
☯These authors contributed equally to this work.
*martin.hart@uks.eu
Abstract
Although an increased level of the prostate-specific antigen can be an indication for prostate cancer, other reasons often lead to a high rate of false positive results. Therefore, an addi-tional serological screening of autoantibodies in patients’sera could improve the detection of prostate cancer. We performed protein macroarray screening with sera from 49 prostate cancer patients, 70 patients with benign prostatic hyperplasia and 28 healthy controls and compared the autoimmune response in those groups. We were able to distinguish prostate cancer patients from normal controls with an accuracy of 83.2%, patients with benign pros-tatic hyperplasia from normal controls with an accuracy of 86.0% and prostate cancer pa-tients from papa-tients with benign prostatic hyperplasia with an accuracy of 70.3%. Combining seroreactivity pattern with a PSA level of higher than 4.0 ng/ml this classification could be improved to an accuracy of 84.1%. For selected proteins we were able to confirm the differ-ential expression by using luminex on 84 samples. We provide a minimally invasive serolog-ical method to reduce false positive results in detection of prostate cancer and according to PSA screening to distinguish men with prostate cancer from men with benign prostatic hyperplasia.
a11111
OPEN ACCESS
Citation:Leidinger P, Keller A, Milchram L, Harz C, Hart M, Werth A, et al. (2015) Combination of Autoantibody Signature with PSA Level Enables a Highly Accurate Blood-Based Differentiation of Prostate Cancer Patients from Patients with Benign Prostatic Hyperplasia. PLoS ONE 10(6): e0128235. doi:10.1371/journal.pone.0128235
Academic Editor:Mohammad Saleem, Hormel Institute, University of Minnesota, UNITED STATES
Received:June 17, 2014
Accepted:April 24, 2015
Published:June 3, 2015
Copyright:© 2015 Leidinger et al. This is an open access article distributed under the terms of the
Creative Commons Attribution License, which permits unrestricted use, distribution, and reproduction in any medium, provided the original author and source are credited.
Data Availability Statement:All relevant data are within the paper and its Supporting Information files.
Funding:The authors received no specific funding for this work.
Introduction
Prostate cancer is one of the most lethal cancers in men worldwide and the second most fre-quent cancer-related cause of death in the United States. In 2012, prostate cancer was estimated to account for more than 417,000 new cases and 92,000 cancer-related deaths in Europe [1]. Mostly, more than two-thirds of all prostate cancers are diagnosed in men aged 65 years and older.[2] Prostate cancer is often characterized by a gradual development and progress.[3] Ac-cording to histological patterns of carcinoma cells the prostate cancer progress is graded by the Gleason scoring: well-differentiated carcinoma cells (Gleason score 2–4), moderately differen-tiated carcinoma cells (Gleason score 5–7), and poorly differentiated carcinoma cells (Gleason score 8–10).[4] Prostate cancer patients with Gleason score 8 to 10 run a more than three times higher risk of dying from prostate cancer within 10 years than patients with Gleason score 2 to 4 (8.3%).[5] Indeed, the disease is curable when it is early detected.[2]
Approximately, two-thirds of US men aged 50 and older are regularly—or at least once—
screened for prostate cancer.[6] Digital rectal examination (DRE), and prostate-specific antigen (PSA) screening have become well-established methods in prostate cancer diagnostic. Howev-er, DRE requires long-time experience in cancer detection. Furthermore, DRE is not a sensitive tool for early disease. It often detects cancer at late stages.[7]
PSA, a serine protease, is an organ specific molecule produced by the prostatic epithelium. PSA tests introduced in the 1980s provide the opportunity to detect cancer without a positive DRE result. According to the US Food and Drug Administration, which allowed PSA testing as diagnostic tool in 1994 a PSA, level greater than 4 ng/ml is regarded as a critical value. A PSA level less than 4 ng/ml corresponds to normal range. PSA can be detected either as“free”(free PSA) or“bound”(PSA-ACT) form in patients´ sera.[8] Stenman and coworkers revealed that men with a high level of bound PSA run a higher risk of suffering from prostate cancer whereas the level of free PSA was shown to be lower in prostate cancer patients than in men with benign prostatic hyperplasia.[9] Partin et al. were able to detect prostate cancer with a sensitivity of 95% and a specificity of 20% by a free PSA screening.[10] Although PSA screenings decrease the mortality rate of prostate cancer patients, the screening method is inefficient and leads to limitations, which often result in a high rate of false positive results followed by unnecessary prostate biopsies [11–13]. Furthermore, older men commonly have a higher PSA level not cor-responding to any prostate disease.[14] High PSA levels are also detectable in patients suffering from benign prostatic hyperplasia.[15] Hence, further screening methods with higher efficien-cy for cancer are necessary.
Biomarkers have developed into a necessary clinical tool. Especially, cancer markers have to fulfill several criteria. They have to have a high sensitivity and specificity, be easy to detect, eco-nomical, and significantly expressed. Current studies showed the potential of autoantibody screening in different types of cancer, e.g., lung cancer, breast carcinoma, ovarian tumor, and me-ningioma.[16–19] Autoantibodies reveal the possibility of early detection and successive therapy. The onset of autoantibody also allows a more detailed look into molecular processes in early dis-ease development. We recently described a blood testing method using autoantibodies to identify lung cancer with a sensitivity of 97.9% and a specificity of 97.0%.[20] Moreover, Wang and co-workers established a phage-protein microarray to identify autoantibodies in prostate cancer. [21] In their study, they detect prostate cancer with a specificity of 88.2% and a sensitivity of 81.6%. Indeed, the study also detected several proteins with less homology to known proteins.
patients, and controls. We also show that immunogenic antigens can be helpful to differentiate prostate cancer patients from benign prostatic hyperplasia patients. Additionally, patients suf-fering from benign prostatic hyperplasia can be separated from controls. Furthermore, we fo-cused on the following question: Can the combination of PSA and autoantibody testing improve the sensitivity and the specificity for the diagnosis of prostate cancer?
PSA testing as a single diagnostic method often leads to false positive results. New biomark-er may provide an opportunity to enhance the sensitivity and the specificity for prostate cancbiomark-er. Specific autoantibody screening along with the PSA test may be a useful diagnostic tool to de-tect prostate cancer at early stage and to reduce prostate cancer-related mortality. Moreover, the identification of novel immunogenic antigens may be a first step towards the development of new therapies.
Materials and Methods
Study population
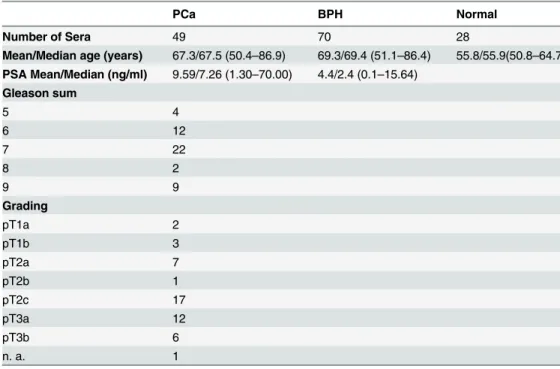
Blood samples of prostate cancer patients and patients with benign prostatic hyperplasia were obtained from the Department of Urology, Saarland University Hospital. Blood samples from healthy donors were obtained from the Department of Hemostaseology and Transfusion Medi-cine, Saarland University Hospital. Serum was prepared from serum monovettes and stored in 2 ml aliquots at -70°C. All samples were obtained with patients´ written informed consent prior to participation. The study including the consent procedure was approved by the local ethics committee (Re.-No. 3755). In total, 147 sera were analyzed, originating from 49 prostate cancer (PCa) patients, 70 benign prostatic hyperplasia (BPH) patients and 28 healthy male vol-unteers. Detailed information on all patients and healthy individuals is provided inTable 1.
Protein macroarray screening
We screened high-density protein macroarrays containing 38,016E.coliexpressed proteins of
the hex1 (human fetal brain cDNA expression) library with pools of 150 sera of patients with
Table 1. Detailed information on all patients and healthy individuals.
PCa BPH Normal
Number of Sera 49 70 28
Mean/Median age (years) 67.3/67.5 (50.4–86.9) 69.3/69.4 (51.1–86.4) 55.8/55.9(50.8–64.7) PSA Mean/Median (ng/ml) 9.59/7.26 (1.30–70.00) 4.4/2.4 (0.1–15.64)
Gleason sum
5 4
6 12
7 22
8 2
9 9
Grading
pT1a 2
pT1b 3
pT2a 7
pT2b 1
pT2c 17
pT3a 12
pT3b 6
n. a. 1
different tumor and non-tumor diseases, including two pools of PCa sera (5 sera per pool) and one pool of 5 BPH sera.[22] A total of 1,827 clones, that were positive for autoantibodies in at least one serum pool, were selected and spotted in duplicates on subarray filters. These sub-macroarrays were screened with 49 PCa, 70 BPH and 28 normal sera (seeS1 Fig).
In brief, macroarrays were washed two times in TBSTT (TBS, 0.05% Tween 20, 0.5% Triton X-100) and four times in TBS. After blocking with 3% non-fat dry milk in TBST (TBS, 0.05% Tween 20), macroarrays were incubated over night with diluted sera (1:1000). After incubation, sera were stored for a second round of incubation. The macroarrays were subjected to three washing steps with TBST followed by incubation with 70°C stripping solution. Afterwards macroarrays were washed two times in TBST and four times in TBS. After incubation with blocking solution macroarrays were subjected to the second round of serum incubation. Macroarrays were washed three times in TBST, and incubated with secondary antibody (rabbit anti-human IgG, IgA, IgM-Cy5 (H+L), Dianova, 1:1000). Finally, macroarrays were washed four times in TBST, two times in TBS and dried overnight. Signals were detected by scanning with Typhoon 9410 scanner (GE Healthcare).
Image analysis and statistics
Spot intensity values were computed by ARCADIA, an image analysis software that we devel-oped specifically for protein array evaluation [20]. In brief, the image of the macroarray was di-vided in subgrids. Those subgrids were further didi-vided in spot areas containing one protein spot. Finally, the intensity of each spot was calculated as the mean value of all pixels of the re-spective protein spot.
We carried out standard quantile normalization to minimize array-to-array variations. Es-pecially for features at the edge of the array we observed slightly decreasing quality. The respec-tive features would however potentially bias the analysis. Thus, respecrespec-tive spots have been marked as not available. Next, we excluded 169 protein spots that were absent on more than 10 analyzed macroarrays. The remaining 1,658 clones were used for the classifications by a linear Support Vector Machine (SVM).
Validation
In order to validate autoantibodies against immunogenic clones, we purchased respective clones from Source Bioscience, i.e., D02594, E19574, L16556, A22594, and C11549. Inserts were sequenced from 5’and 3’ends to confirm identity and length of the represented antigens. Sequence data revealed, that clone D02594 was a hybrid of the two proteins YBX1 and PDP1, representing at its 5’end the first 275aa of YBX1 and at its 3’end the last 91aa (starting at aa446) of PDP1 with an unknown linker sequence in between. This protein was excluded from further analysis. The other 4 clones were confirmed to include sequences of RPS27A, RPL15, DDX54 and RPL7. To determine presence of autoantibodies against these antigens, we used the Xmap technology (Luminex, Austin, TX, USA). In short, his-tagged antigens were express-ed inE.coliaccording to supplier’s recommendations, purified using Ni-NTA agarose beads
and coupled to magnetic microspheres according to manufacturer’s instruction with minor modifications. Fiftyμl of a beadmix containing 1000 coupled microspheres per assayed protein
was incubated with sera of patients and controls (1:400 diluted in 100 mM Tris-HCl pH 7.0, 1%BSA 300 mM, NaCl 0.1%Tween-20) for 2h at RT on a shaker. Bound autoantibodies were detected using a 1:1 mixture of 2.5μg/ml R-Phyco AffiniPure F(ab')2 Frag Gt Anti-Hmn IgG
[Fcγ] (Jackson ImmunoResearch Cat.No. 109-116-098) and 2.5μg/ml of R-Phyco AffiniPure F
(ab')2 Frag Gt Anti-Hmn IgG [F(ab')2] (Jackson ImmunoResearch Cat.No. 109-116-097). After 1hr incubation with secondary antibodies, beads were washed three-times with
PBS-Tween 0.05% and measured with Luminex Flexmap 3D. Besides standard hypothesis tests such as t-test or analysis of variance, the AUC has been calculated. Finally, the measurements were correlated to the Gleason score and PSA levels.
Results
A total of 1,827 cDNA clones were screened with 147 serum samples, including 49 PCa sera, 70 BPH sera, and 28 sera from healthy men (Table 1). Out of these sera we selected an age-matched subset that included 44 PCa and BPH sera, each with a median age of 67 years. In ad-dition we compared subsets of 36 sera from PCa patients with PSA level>4 ng/ml and of 33
sera of BPH patients also with PSA level>4 ng/ml.
Frequency of immunogenic clones
To minimize array-to-array variations the 147 analyzed macroarrays were normalized using standard quantile normalization. We choose a spot intensity threshold of 50 for the determina-tion of positive seroreactivity. We excluded all cDNA clones that showed lack of seroreactivity on more than 10 of the 147 arrays. Out of the remaining 1658 cDNA clones, 1612 clones re-acted with at least one PCa serum. The frequency of seroreactivity varied from 2.3% for the cDNA clone the reacted least with the PCa sera, to 97.7% for the most reactive cDNA clone. We found 1613 clones that reacted with at least one BPH serum. The frequency of seroreactiv-ity varied from 2.3% to 95.5%. Interestingly, 1,533 clones reacted with normal sera (frequencies from 3.6% to 96.4%. The comparison of the above mentioned clones revealed an overlap of 1,485 clones between PCa, BPH and normal sera. Those clones might be so called natural auto-antibodies that are present in each serum of healthy persons at remarkable constant levels and characterized by minimal individual quantitative variations.[23] The Venn diagram inFig 1
shows the distribution of the reacting clones.
with at least one PCa serum, 12 clones only reactive with at least one BPH serum, and 5 clones only reactive with at least one normal serum. Regarding the seroreactivity frequencies of each serum group the results were somewhat disappointing as at most only seven of 49 PCa sera re-acted with the PCa specific antigens, at most only seven of the 70 BPH sera rere-acted with the BPH specific antigens, and only one normal serum reacted with the 5 specific antigens found only in normal sera. Therefore, it seems that these antigens might reflect individual variations.
Information content of immunogenic clones
As considering only the seroreactivity frequencies per serum group seems not to be a good measure, we calculated for each cDNA clone the area under the receiver operator
Fig 1. Distribution of the reacting clones.The Venn diagram shows the distribution of the 1658 reacting clones for the three serum groups (PCa, BPH, Normal). Most of the clones are reactive in all three groups whereas a small number of clones is just reactive in every single group.
characteristics curve (AUC) as described in Materials and Methods section. The AUC is a mea-sure for the information content of each antigen for the separation of two different serum groups from each other. Here it became evident, that clones that react with more than one serum group can, however, have a high information content for certain separations.
The AUC values of the 1,658 analyzed clones, including 461 in-frame clones, are summa-rized inTable 2. We ranked the cDNA clones according to the information content they con-tributed to the different classification tasks. Clones with an AUC value>0.7 or<0.3 were
considered to be very informative for a given classification task.
For the discrimination of PCa and normal sera, 199 clones (12%) were considered to be in-formative, including 52 in-frame clones. Among the informative clones, 78 clones showed AUC values>0.7, including 32 in-frame clones and 121 clones showed AUC values<0.3,
in-cluding 20 in-frame clones. The out-of-frame clone D20552 with a sequence homology to the brain creatine kinase (CKB) showed the lowest AUC value (AUC = 0.142) for the discrimina-tion of PCa and normal sera. This clone was also informative for the discriminadiscrimina-tion of BPH and normal sera (AUC = 0.190) but not for the discrimination of PCa and BPH sera
(AUC = 0.466). The out-of-frame clone E03526 with sequence homology to dimethylarginine dimethylaminohydrolase 1 (DDAH1) showed the highest AUC value (AUC = 0.811). Again, this clone was also informative for the discrimination of BPH and normal sera (AUC = 0.760) but not for the discrimination of PCa and BPH sera (AUC = 0.558).
The clone D02594 with sequence homology to nuclease sensitive element binding protein 1 (YBX1) was the in-frame clone with the lowest AUC value (AUC = 0.209) and the clone A06579 with sequence homology to protein (peptidyl-prolyl cis/trans isomerase) (PIN4) was the in-frame clone with the highest AUC value (AUC = 0.806).
For the discrimination of BPH and normal sera, 110 clones (6.63%), including 24 in-frame clones were considered to be informative. Among them, 39 clones showed AUC values>0.7,
including 5 in-frame clones and 71 clones showed AUC values<0.3, including 6 in-frame
clones. The out-of-frame clone C18596 showed the lowest AUC value (AUC = 0.144) for the discrimination of BPH and normal sera, i.e., this clone showed a stronger immune response with sera of BPH patients compared to normal sera. This clone was also informative for the dis-crimination of PCa and normal sera (AUC = 0.236) and showed stronger immune response in sera of PCa patients compared to normal sera. However, for the discrimination of BPH sera and PCa sera the clone C18596 reached only an AUC value of 0.528 and had therefore less
Table 2. Distribution of clones according to the AUC values that were determined for the classification of PCa vs. Normal, BPH vs. Normal, PCa vs. BPH, and PCa (PSA>4.0) vs. BPH (PSA>4.0).
PCA vs. Normal BPH vs. Normal PCA vs. BPH PCa (PSA>4.0) vs. BPH (PSA>4.0)
AUC value No.(all) No.(in-frame) No.(all) No.(in-frame) No.(all) No.(in-frame) No.(all) No.(in-frame)
0.0–0.1 0 0 0 0 0 0 0 0
0.1–0.2 7 0 5 1 0 0 4 2
0.2–0.3 114 20 66 5 5 2 77 26
0.3–0.4 263 65 266 40 187 74 270 80
0.4–0.5 443 117 536 135 642 205 473 156
0.5–0.6 484 145 531 178 588 133 453 113
0.6–0.7 269 82 215 84 223 45 290 70
0.7–0.8 76 31 39 18 13 2 82 12
0.8–0.9 2 1 0 0 0 0 9 2
sum 1658 461 1658 461 1658 461 1658 461
information content for this separation. The out-of-frame clone E13519 with a sequence ho-mology to oxidase (cytochrome c) assembly 1-like (OXA1L) showed the highest AUC value (AUC = 0.782) specific for the discrimination of BPH and normal sera, i.e., higher immunoge-nicity in normal sera than in BPH sera. However, this clone had no information content for the separation of PCa from normal sera (AUC = 0.646) and for the separation of BPH from PCa (AUC = 0.446). For the discrimination of BPH and normal sera the clone E19574 with se-quence homology to the pseudogene similar to ubiquitin and ribosomal protein S27a precursor was identified as the most informative in-frame clone with AUC<0.3, i.e., higher immune
re-sponse in sera of BPH patients than in normal sera (AUC = 0.175). The in-frame clone L16556 with sequence homology to ribosomal protein L15 (RPL15) was identified as the most informa-tive in-frame clone with AUC>0.7, i.e., higher immunogenicity in normal sera compared to
sera of BPH patients (AUC = 0.773).
When comparing PCa and BPH sera, 99.3% (1646 clones) of the immunogenic clones showed AUC values between 0.3 and 0.7, which means they are non-informative. Only 18 in-formative clones (1.09%), including four in-frame clones, remained. Among them, 5 clones showed AUC values<0.3 and 13 clones showed AUC values>0.7. The out-of-frame clone
N22510 with a sequence homology to MARCKS-like 1 (MARCKSL1) showed the highest AUC value (AUC = 0.773) for the discrimination of PCa and BPH. The clone A22594 showed the lowest AUC value (AUC = 0.266). Both clones were also informative for the discrimination of BPH and normal sera, but not for PCa sera vs. normal sera. The latter clone A22594 was in-frame and thereby the clone with the lowest AUC. The clone C11549 with sequence homology to 60S ribosomal protein L7 was the in-frame clone with the highest AUC value
(AUC = 0.710).
For the discrimination of sera from patients with different diseases of the same organ, i.e., PCa or BPH, we also took the pre-operative PSA value into account. Therefore, we selected 36 PCa sera and 33 BPH sera with PSA4.0 ng/ml from the initial study population. The overlap to the before mentioned age-matched serum cohort was 32 PCa and 17 BPH sera. The follow-ing classification revealed 166 informative clones, includfollow-ing 42 frame clones. Among the in-formative clones, 81 clones showed AUC values<0.3, including 28 in-frame clones and 91
clones showed AUC values>0.7, including 14 in-frame clones. In the discrimination PCa
ver-sus BPH, each with PSA4.0 ng/ml, the out-of-frame clones N12603 and N22510 showed the best AUC values of 0.174 and 0.838, respectively. Clone N12603 has sequence homology to cholinergic receptor nicotinic alpha (CHRNA2) and clone N22510 to MARCKS-like 1 (MARCKSL1). Interestingly, the latter clone N22510 was also the clone with the highest AUC value for the separation PCa versus BPH, independent of the PSA level.
The clones A18602 (sequence homology to ribosomal protein S2 (RPS2)) and J04520 (se-quence homology to Y box binding protein 1 (YBX1)) were the in-frame clones with the best AUC values of 0.188 and 0.818, respectively.
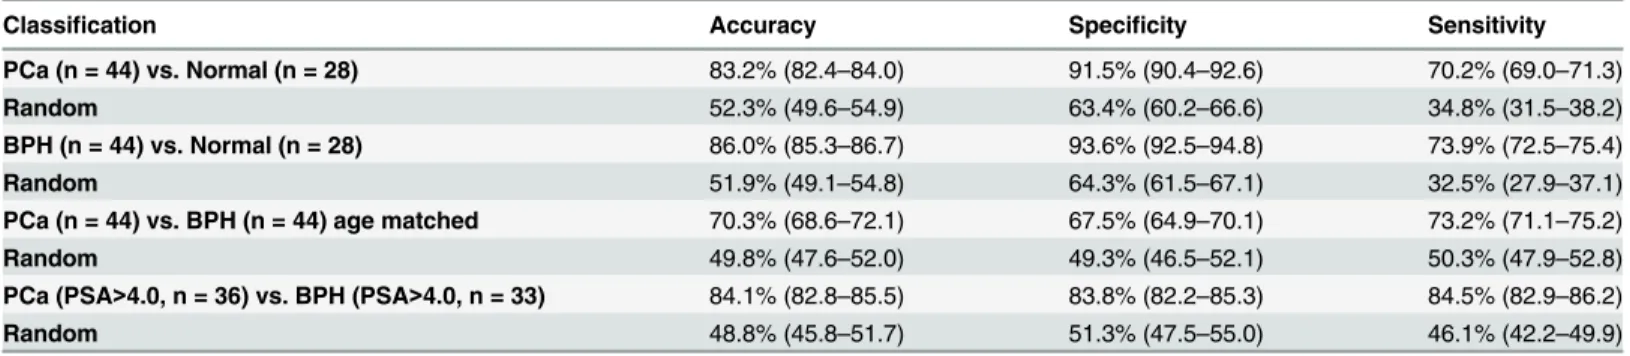
Classification results
As detailed in the Materials and Methods section, classification was carried out by a linear Sup-port Vector Machine (SVM). Here, 20 repetitions of a standard 10-fold cross validation were performed and mean sensitivity, specificity, and accuracy for four classification tasks was cal-culated. All classification results are detailed inTable 3. The best results were obtained for the classification BPH versus normal with an accuracy of 86%. The classification PCa versus nor-mal yielded an accuracy of 83.2%. The worst classification accuracy of 70.3% was obtained for the age matched samples PCa versus BPH. But, considering the PSA level of>4.0 clearly
Validation
Since high-throughput technologies frequently lead to false positive biomarker results, valida-tion by independent technology is essential. From the previous analyses we picked five clones: D02594, E19574, L16556, A22594, and C11549. These correspond to proteins RPS27A, RPL15, DDX54 and RPL7. Since re-sequencing demonstrated that clone D02594 was a hybrid of the two proteins YBX1 and PDP1, it was left out from the statistical analysis. The clones were screened with a cohort of 84 individuals, including 27 PCa patients, 30 BPH patients and 27 controls. An analysis of variance showed significant results for DDX54 (p = 0.03) and RPL7 (p = 0.04). A third clone, RPL15, slightly exceeded the significance threshold (p = 0.074).
In the screening experiments, DDX54 showed an increased median seroreactivity in control sera (44.9) and PCa patients (44.6) compared to BPH (41.2) patients. This higher reactivity in controls compared to BPH patients has been confirmed by the validation analysis (Fig 2A). For the second protein, RPL7, the initial results increased autoantibodies in BPH patients (44.8) compared to PCa patients (39.0). This trend was also observed in the validation experiments (Fig 2B). Although slightly not statistically significant, the overall trend of higher seroreactivity against RPL15 in normal samples compared to both PCa and BPH patients was successfully re-produced in validation (Fig 2C). By correlating the protein expression to the PSA levels we did not observed significant results.
Discussion
There is common consensus that PSA screening has decreased the mortality rate of PCa pa-tients for years. Nevertheless, PSA testing is still a contentious issue for it often leads to false re-sults, overdiagnosis, and false therapy going along with high costs.[24] The identification of further biomarkers, e.g., PCA3, GSTP1, AMACR, or miRNAs, reveals the opportunity to im-prove prostate cancer detection.[25] Additionally, new biomarkers may enhance monitoring and give a more detailed view into cancer progress and development.
In our study, we present a combination of autoantibody signature with PSA level. We screened a set of 1,827 cDNA clones with 49 PCa sera, 70 BPH sera, and 28 sera from healthy individuals by protein macroarray analysis. Additionally, we compared seroactivity of PCa pa-tients, BPH patients and controls by calculating AUC values. AUC values<0.3 and>0.7 were
considered as informative. In total, we identified 199 informative clones (including 52 in-frame-clones) for the classification of PCa versus normal, 110 informative clones (including 24 in-frame-clones) for the classification of BPH versus normal, and only 18 informative clones (including 4 in-frame-clones) for the classification of PCa versus BPH. Considering only PCa
Table 3. Mean values of Accuracy, Specificity and Sensitivity for the classifications of PCa vs. Normal, BPH vs. Normal, PCa vs. BPH, and PCa (PSA>4.0) vs. BPH (PSA>4.0).
Classification Accuracy Specificity Sensitivity
PCa (n = 44) vs. Normal (n = 28) 83.2% (82.4–84.0) 91.5% (90.4–92.6) 70.2% (69.0–71.3)
Random 52.3% (49.6–54.9) 63.4% (60.2–66.6) 34.8% (31.5–38.2)
BPH (n = 44) vs. Normal (n = 28) 86.0% (85.3–86.7) 93.6% (92.5–94.8) 73.9% (72.5–75.4) Random 51.9% (49.1–54.8) 64.3% (61.5–67.1) 32.5% (27.9–37.1) PCa (n = 44) vs. BPH (n = 44) age matched 70.3% (68.6–72.1) 67.5% (64.9–70.1) 73.2% (71.1–75.2)
Random 49.8% (47.6–52.0) 49.3% (46.5–52.1) 50.3% (47.9–52.8)
PCa (PSA>4.0, n = 36) vs. BPH (PSA>4.0, n = 33) 84.1% (82.8–85.5) 83.8% (82.2–85.3) 84.5% (82.9–86.2) Random 48.8% (45.8–51.7) 51.3% (47.5–55.0) 46.1% (42.2–49.9)
and BPH sera with PSA levels>4.0 ng/ml we detected 166 clones (including 42
in-frame-clones) for the classification of PCa versus BPH.
We were able to separate sera from PCa patients and controls with an accuracy of 83.2%, a sensitivity of 70.2%, and a specificity of 91.5%. BPH sera and normal sera were separated with an accuracy of 86.0%, a sensitivity of 73.9%, and a specificity of 93.6%. The worst classification accuracy with 70.3% was obtained for PCa versus BPH. Interestingly, the classification result
Fig 2. Seroreactivity against DDX54, RPL7 and RPL15 in protein macroarray and Luminex validation.Box-Whisker plots for reactivity against DDX54 (A), RPL7 (B) and RPL15 (C) with serum of patients with benign prostate hyperplasia (BPH), prostate carcinoma (PCa) and healthy controls (N) in protein macroarray (left panels) and luminex validation (right panels). For each group, the boxes indicate the 2. and 3. quartile of seroreactivity, the whiskers show minimum and maximum value. The horizontal black lines indicate the median seroreactivity in the group. Similar seroreactivity trends are indicated by square brackets.
improves after taken the PSA level of>4.0 ng/ml into consideration. Here, we separated PCa
sera and BPH sera with an accuracy of 84.1%, a sensitivity of 84.5%, and a specificity of 83.8%. This is of importance because this method allows separating malignant disease from
benign disease.
Our results are based on specific reactions of the immune system. Beside PSA and other bio-markers cancer-associated antigens may be very specific marker and suitable as diagnostic tool. The immune system recognizes cancer cells by producing specific autoantibodies against these cancer-associated antigens. Autoantibodies can be easily detected in patients`sera. Moreover, they have a long half-life and are detectable at low costs.[26] The identified antigens detected in the sera of PCa patients and BPH patients may serve as biomarkers or as targets for future therapy for patients with different prostate diseases. The antigens we found may play a func-tional role in the development of prostate cancer. In total, we found 12 phage-peptide clones with homology to known proteins. Clones with homology to CKB, DDAH1, YBX1, PIN4, OXA1L, pseudogene similar to ubiquitin and ribosomal protein S27a precursor, and RPL15 were informative for the discrimination of normal sera and PCa and BPH, respectively. Clones with homology to 60S ribosomal protein L7, and MARCKS1 were informative for the discrimi-nation of PCa sera and BPH sera. Clones with homology to CHRNA2, RPS2, YBX1, and MARCKS1 were informative for the discrimination of PCa sera and BPH sera taken the PSA level into consideration. Interestingly, the phage-peptide clone with a homolog sequence to MARCKSL1 was very informative for the classification of PCa versus BPH with and without considering the PSA level. MARCKSL1 is a member of the MARCKS family, a group of pro-teins involved in the calmodulin (CaM) signaling pathway, the protein kinase C (PKC) signal-ing pathway, and in the regulation of the actin cytoskeleton.[27] MARCKS can be associated with cancer development and tumorgenesis.[28] MARCKS was previously been reported to be a target of miRNA-21 in prostate cancer cells.[29] Further studies have to elucidate the exact role of MARCKS in the development of prostate cancer. It may be exploited as future diagnos-tic tool to distinguish between malignant state and benign state.
In addition, further phage-peptide clones with homology to YBX1, RPL15 and CHRNA2 have been associated with cancer and other disease. YBX1 has been associated with several human cancers, e.g., colorectal cancer, breast cancer, and glioblastome multiforme.[30–32] RPL15 is overexpressed and seems to be involved in cell proliferation in gastric cancer.[33] CHRNA2 is located on chromosome 8p, a chromosomal region with 484 detected genes. Sever-al of these genes are supposed to be tumor-suppressor genes or oncogenes.[34] Future studies have to disclose their role in prostate cancer progress and development. In our study, we pro-vide epro-vidence that blood testing discriminates PCa and BPH patients’sera from control sera with high specificity and sensitivity.
Moreover, our results of a combined autoantibody screening along with PSA testing allow a high discrimination of PCa patients and BPH patients. The results may pave the way for a new diagnostic tool that enables characteristic patterns for patients with PCa and BPH respectively. Although prostate biopsy is favored as a histological diagnosis of prostate cancer for patients with a PSA level greater than 4 ng/ml, in almost one of two patients symptoms occur caused by biopsy, like fever, haematuria, haematochezia or haemoejaculate and often results in loss of tol-eration for repeating biopsy.[2,35] Moreover, diagnostic methods, which are able to distinguish between malignant state and benign state, also reduce the risk of patients`undertreatment and overtreatment.
Supporting Information
S1 Fig. General Workflow of the Protein macroarray screening.
(TIF)
Acknowledgments
The analyzed sera were kindly provided by Dr. B. Stephan (Institute of Clinical Haematology and Transfusion Medicine, Saarland University, Homburg, Germany) and Prof. Dr. B. Wullich (Department of Urology, University Hospital of Erlangen, Germany). We thank Dr. Claudia Andres, Dr. Sabrina Heisel, Veronika Klein and Stefanie Rheinheimer for technical assistance.
Author Contributions
Conceived and designed the experiments: PL BW NL EM BK. Performed the experiments: PL LM CH MH. Analyzed the data: AK A. Werth HPL A. Weinhäusel BW BK. Contributed re-agents/materials/analysis tools: AK HPL A. Werth BW BK. Wrote the paper: PL AK CH MH HPL NL EM.
References
1. Ferlay J, Steliarova-Foucher E, Lortet-Tieulent J, Rosso S, Coebergh JW, Comber H, et al. Cancer inci-dence and mortality patterns in Europe: estimates for 40 countries in 2012. European journal of cancer. 2013; 49(6):1374–403. doi:10.1016/j.ejca.2012.12.027PMID:23485231.
2. National Comprehensive Cancer Network. NCCN Clinical Practice Guidelines in Oncology. Prostate Cancer Early Detection. Available:http://www.nccn.org/professionals/physician_gls/PDF/prostate_ detection.pdf. Accessed 2010 February 3.
3. Wolf AM, Wender RC, Etzioni RB, Thompson IM, D'Amico AV, Volk RJ, et al. American Cancer Society guideline for the early detection of prostate cancer: update 2010. CA Cancer J Clin. 2010; 60(2):70–98. Epub 2010/03/05. caac.20066 [pii] doi:10.3322/caac.20066PMID:20200110.
4. Humphrey PA. Gleason grading and prognostic factors in carcinoma of the prostate. Mod Pathol. 2004; 17(3):292–306. Epub 2004/02/21. doi:10.1038/modpathol.3800054 3800054[pii]. PMID:14976540. 5. Lu-Yao GL, Albertsen PC, Moore DF, Shih W, Lin Y, DiPaola RS, et al. Outcomes of localized prostate
cancer following conservative management. JAMA. 2009; 302(11):1202–9. Epub 2009/09/17. 302/11/ 1202 [pii] doi:10.1001/jama.2009.1348PMID:19755699.
6. Sirovich BE, Schwartz LM, Woloshin S. Screening men for prostate and colorectal cancer in the United States: does practice reflect the evidence? JAMA. 2003; 289(11):1414–20. Epub 2003/03/15. joc22030 [pii]. PMID:12636464.
7. Smith DS, Catalona WJ. Interexaminer variability of digital rectal examination in detecting prostate can-cer. Urology. 1995; 45(1):70–4. Epub 1995/01/01. PMID:7529449.
9. Christensson A, Bjork T, Nilsson O, Dahlen U, Matikainen MT, Cockett AT, et al. Serum prostate specif-ic antigen complexed to alpha 1-antspecif-ichymotrypsin as an indspecif-icator of prostate cancer. J Urol. 1993; 150(1):100–5. Epub 1993/07/01. PMID:7685416.
10. Partin AW, Brawer MK, Subong EN, Kelley CA, Cox JL, Bruzek DJ, et al. Prospective evaluation of per-cent free-PSA and complexed-PSA for early detection of prostate cancer. Prostate Cancer Prostatic Dis. 1998; 1(4):197–203. Epub 2002/12/24. doi:10.1038/sj.pcan.4500232 4500232[pii]. PMID: 12496895.
11. Catalona WJ, Smith DS, Ratliff TL, Dodds KM, Coplen DE, Yuan JJ, et al. Measurement of prostate-specific antigen in serum as a screening test for prostate cancer. N Engl J Med. 1991; 324(17): 1156–61. Epub 1991/04/25. doi:10.1056/NEJM199104253241702PMID:1707140.
12. Cohen L, Fouladi RT, Babaian RJ, Bhadkamkar VA, Parker PA, Taylor CC, et al. Cancer worry is asso-ciated with abnormal prostate-specific antigen levels in men participating in a community screening pro-gram. Cancer Epidemiol Biomarkers Prev. 2003; 12(7):610–7. Epub 2003/07/19. PMID:12869399. 13. Schmid HP, Prikler L, Semjonow A. Problems with prostate-specific antigen screening: a critical review.
Recent Results Cancer Res. 2003; 163:226–31; discussion 64–6. Epub 2003/08/09. PMID:12903857. 14. Madu CO, Lu Y. Novel diagnostic biomarkers for prostate cancer. J Cancer. 2010; 1:150–77. Epub
2010/10/27. PMID:20975847.
15. Linton HJ, Marks LS, Millar LS, Knott CL, Rittenhouse HG, Mikolajczyk SD. Benign prostate-specific antigen (BPSA) in serum is increased in benign prostate disease. Clin Chem. 2003; 49(2):253–9. Epub 2003/02/01. PMID:12560348.
16. Chapman CJ, Murray A, McElveen JE, Sahin U, Luxemburger U, Tureci O, et al. Autoantibodies in lung cancer: possibilities for early detection and subsequent cure. Thorax. 2008; 63(3):228–33. Epub 2007/ 10/13. thx.2007.083592 [pii] doi:10.1136/thx.2007.083592PMID:17932110.
17. Comtesse N, Zippel A, Walle S, Monz D, Backes C, Fischer U, et al. Complex humoral immune re-sponse against a benign tumor: frequent antibody rere-sponse against specific antigens as diagnostic tar-gets. Proc Natl Acad Sci U S A. 2005; 102(27):9601–6. Epub 2005/06/29. 0500404102 [pii] doi:10. 1073/pnas.0500404102PMID:15983380.
18. Erkanli A, Taylor DD, Dean D, Eksir F, Egger D, Geyer J, et al. Application of Bayesian modeling of au-tologous antibody responses against ovarian tumor-associated antigens to cancer detection. Cancer Res. 2006; 66(3):1792–8. Epub 2006/02/03. 66/3/1792 [pii] doi:10.1158/0008-5472.CAN-05-0669 PMID:16452240.
19. Piura E, Piura B. Autoantibodies to tumor-associated antigens in breast carcinoma. J Oncol. 2008; 2010:264926. Epub 2010/11/30. doi:10.1155/2010/264926PMID:21113302.
20. Leidinger P, Keller A, Heisel S, Ludwig N, Rheinheimer S, Klein V, et al. Identification of lung cancer with high sensitivity and specificity by blood testing. Respir Res. 2010; 11:18. Epub 2010/02/12. 1465-9921-11-18 [pii] doi:10.1186/1465-9921-11-18PMID:20146812.
21. Wang X, Yu J, Sreekumar A, Varambally S, Shen R, Giacherio D, et al. Autoantibody signatures in prostate cancer. N Engl J Med. 2005; 353(12):1224–35. Epub 2005/09/24. 353/12/1224 [pii] doi:10. 1056/NEJMoa051931PMID:16177248.
22. Adams MD, Dubnick M, Kerlavage AR, Moreno R, Kelley JM, Utterback TR, et al. Sequence identifica-tion of 2,375 human brain genes. Nature. 1992; 355(6361):632–4. Epub 1992/02/13. doi:10.1038/ 355632a0PMID:1538749.
23. Poletaev A, Osipenko L. General network of natural autoantibodies as immunological homunculus (Immunculus). Autoimmun Rev. 2003; 2(5):264–71. Epub 2003/09/11. S1568997203000338 [pii]. PMID:12965177.
24. Schroder FH, Hugosson J, Roobol MJ, Tammela TL, Ciatto S, Nelen V, et al. Prostate-cancer mortality at 11 years of follow-up. N Engl J Med. 2012; 366(11):981–90. Epub 2012/03/16. doi:10.1056/ NEJMoa1113135PMID:22417251.
25. Tosoian J, Loeb S. PSA and beyond: the past, present, and future of investigative biomarkers for pros-tate cancer. ScientificWorldJournal. 2010; 10:1919–31. Epub 2010/10/05. doi:10.1100/tsw.2010.182 PMID:20890581.
26. Lobo ED, Hansen RJ, Balthasar JP. Antibody pharmacokinetics and pharmacodynamics. J Pharm Sci. 2004; 93(11):2645–68. Epub 2004/09/25. doi:10.1002/jps.20178PMID:15389672.
27. Ramsden JJ. MARCKS: a case of molecular exaptation? Int J Biochem Cell Biol. 2000; 32(5):475–9. Epub 2000/03/29. S1357272599001521 [pii]. PMID:10736562.
29. Li T, Li D, Sha J, Sun P, Huang Y. MicroRNA-21 directly targets MARCKS and promotes apoptosis re-sistance and invasion in prostate cancer cells. Biochem Biophys Res Commun. 2009; 383(3):280–5. Epub 2009/03/24. S0006-291X(09)00543-9 [pii] doi:10.1016/j.bbrc.2009.03.077PMID:19302977. 30. Gao Y, Fotovati A, Lee C, Wang M, Cote G, Guns E, et al. Inhibition of Y-box binding protein-1 slows
the growth of glioblastoma multiforme and sensitizes to temozolomide independent O6-methylguanine-DNA methyltransferase. Mol Cancer Ther. 2009; 8(12):3276–84. Epub 2009/12/10. 1535-7163.MCT-09-0478 [pii] doi:10.1158/1535-7163.MCT-09-0478PMID:19996271.
31. Jurchott K, Kuban RJ, Krech T, Bluthgen N, Stein U, Walther W, et al. Identification of Y-box binding protein 1 as a core regulator of MEK/ERK pathway-dependent gene signatures in colorectal cancer cells. PLoS Genet. 2010; 6(12):e1001231. Epub 2010/12/21. doi:10.1371/journal.pgen.1001231 PMID:21170361.
32. Yang JY, Ha SA, Yang YS, Kim JW. p-Glycoprotein ABCB5 and YB-1 expression plays a role in in-creased heterogeneity of breast cancer cells: correlations with cell fusion and doxorubicin resistance. BMC Cancer. 2010; 10:388. Epub 2010/07/24. 1471-2407-10-388 [pii] doi:10.1186/1471-2407-10-388 PMID:20649952.
33. Wang H, Zhao LN, Li KZ, Ling R, Li XJ, Wang L. Overexpression of ribosomal protein L15 is associated with cell proliferation in gastric cancer. BMC Cancer. 2006; 6:91. Epub 2006/04/13. 1471-2407-6-91 [pii] doi:10.1186/1471-2407-6-91PMID:16608517.
34. Tabares-Seisdedos R, Rubenstein JL. Chromosome 8p as a potential hub for developmental neuro-psychiatric disorders: implications for schizophrenia, autism and cancer. Mol Psychiatry. 2009; 14(6): 563–89. Epub 2009/02/11. p20092 [pii] doi:10.1038/mp.2009.2PMID:19204725.