Pak. J. Anal. Environ. Chem. Vol. 11, No. 1 (2010) 42–52
Characterization of Humic Acid from the River Bottom
Sediments of Burigonga: Complexation Studies of
Metals with Humic Acid
Mohammad Arifur Rahman*, Md. Abu Hasan, Abdur Rahim
and A. M. Shafiqul Alam
Department of Chemistry, University of Dhaka, Dhaka-1000, Bangladesh
--- Abstract
In order to characterize and study of the complexation of humic acid with metal ions, sediment samples were collected from five different places in the Buriganga River. The Humic Acids were extracted with the standard procedure provided by the International Humic Substance Society (IHSS). The extracted Humic Acids were characterized with FTIR, EDX and CHNS analyzer and a comparison between the standard and extracted HA was carried out. High C/N ratios (71.48-87.36) are observed in the CHNS analysis. A complexation study of the Humic Acid with iron (III) and cadmium (II) was also carried out using EDX, UV-Visible spectrophotometer and AAS techniques. The coagulation behavior was observed with Jar test. From the study, it was found that iron and cadmium could make a complex at pH 6.0 which was confirmed by EDX (Electron Dispersive x-ray).
Keywords: Humic acid; Iron; Cadmium; Complex; Buriganga river.
---
Introduction
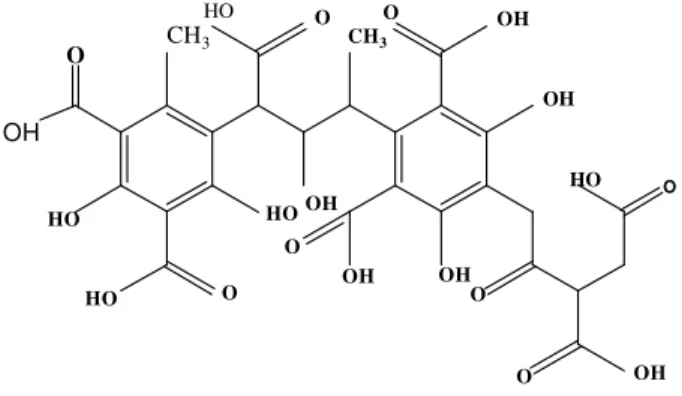
Humic substances are commonly described as heterogeneous compounds containing both a large proportion of oxygen containing functional group (essentially carboxylic and phenolic) that make them and segregated aromatic and aliphatic moieties that give them surface active and hydrophobic-binding properties [3]. The structure of the humic acid is presented in Fig. 1. In many cases they act as the major buffering system, which has serious implications for acidification of lakes and rivers. Moreover, the structures, molar masses and functional groups of humic acid vary depending on origin and age [1, 2].
Humic acid represent the dominant part of dissolved organic matter in freshwater supplies [4]. The elimination of metals and humic acid in drinking water treatment is mainly performed coagulation with hydrolyzed metal species.
Considerable attention has then been focused on this removal step as uncoagulated humic materials lead to severe in the following treatment stages. Indeed, Membrane fouling, trihalomethanes formations during chlorine disinfection, or biological re-growth in the distribution network, have all been linked to the presence of residual humic substance in the clarified water [5]. Three main mechanisms are generally invoked to explain the removal of humic acid and metals by coagulation: charge neutralization/complexation preferentially applies at acidic pH and finds experimental support from stoichiometric relationships between coagulant demand and dissolved organic matter concentration, and from suspension restabilization upon overdosing [6].On the other hand, under conditions favouring metal hydroxide precipitation, physical ensmeshment and/ or adsorption onto the freshly formed
precipitate are assumed to play a major role in humic substance elimination [7].
O
OH
CH3
HO O
HO
O
OH
HO O
OH O
HO
O OH
O OH
OH O
CH3 OH
HO
Figure 1. Structure of Humic Acid.
The river Buriganga, which runs by the side of the Dhaka city, is at present one of the most polluted rivers in Bangladesh. The amount of untreated wastes, both domestic and industrial, being released in the Buriganga is tremendous and increasing day by day. So, the structure of humic acid in the river Buriganga would be different. Therefore, it is required to determine the structure of humic acid of the Buriganga River in Bangladesh.
Humic substances have been documented to interact in some manner with over 50 elements from the periodic table. These include nutrients, toxic metals, radionuclide (including the transuranium series) and the halogens. Furthermore, humic substances contain long-lived (almost stable populations) of free radicals, which are capable of reducing inorganic species such as Fe(III), Cd(II), Hg(II), Cr(VI), and Pu(VI) to name a few. High concentration of iron in the river water made scaling in the boiler of water purification system. Cadmium is not only heavy metal but also toxic in nature. It is one of the most harmful elemental pollutants and is of particular concern because of its toxicities to humans. Pollutant cadmium in water may arise from industrial discharges and mining wastes. The iron and cadmium complexes would be deposited in the bottom of the river. This iron and cadmium free surface water can be used for the municipal water supply system. Therefore, the study of the interaction of Fe (III)
and Cd (II) with humic acid is very much important.
There are many investigations of
complexation of metals with humic acid [2, 8, 9]. Moreover, many characterization studies also carried out in different countries. However, molar masses and functional groups of humic acid varied with origin and its surrounding environment. Since the Buriganga is very much polluted river in Bangladesh its humic acid structure might be different. So, the structure of humic acid and its interaction with metals would be different. No information is available regarding the structure of humic acid and complexation study of humic acid with metals of the Buriganga River. Therefore, it is required to determine the structure of humic acid and study of the metals and humic acid complexation of the Buriganga River.
This work involves with the characterization of humic acid of the Buriganga River and its complexation study with iron (III) and cadmium (II).
Experimental
Sampling
The river bottom sediments in the Burigonga River were collected in 0.15m depth from the surface of the river bottom sludge on 24th
July (rainy season) of 2008 at 30oC atmospheric temperature from five sampling
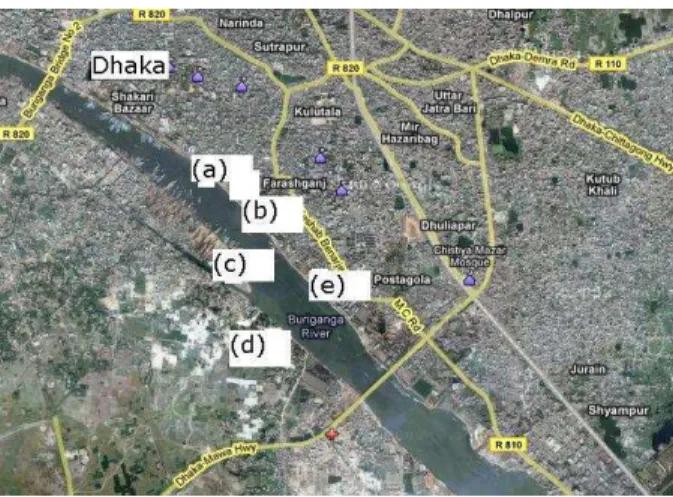
stations. The sampling areas(23o42’N 90o24’E to 23o92’N 90o53’E) are as follows: a.
Bibi Shaheb’s Ghat, b. Forashgonj Ghat, c. Shahid Shaheb’s Ghat, d. Shagorer Dock and e.
Talukder Ghat. The sampling sites are located near to Dhaka. The sampling areas are presented in (Fig. 2).
Chemicals and apparatus
Figure 2. The Sampling areas in the Buriganga River.
Extraction procedure
In order to extract humic acid from the river bottom sediments, extraction procedures of humic acid were applied to the sediment samples following a standard procedure recommended by the International Humic Substances Society (IHSS) [10]. First, a broken piece of shell and a small dust were removed from the dried sediments. Then the sediment clods (approximately 300 g) were broken up by a glass rod in the conical beaker, and the pH of sediments was set between 1 and 2 by the addition of 1 mol/L HCl at room temperature. The sediments were added into 600 mL of 0.1 mol/L HCl, and their suspensions were shaken with the horizontal shaker (180 rpm) for 1 hour and were stirred magnetically for two hours under nitrogen atmosphere. The supernatant solutions were separated from the residues including humic acid with the low speed centrifugation (1000 rpm). The residues including humic acid were added into 200 mL of 0.1 mol/L HCl. The suspensions were stirred in a similar way. The supernatant solutions were separated from the sediments with the centrifugation (1000 rpm) and were acidified with 6 mol/L HCl to pH 1 for the precipitation of humic acid. After standing for at least 12 hours, the precipitates centrifuged were redissolved in 0.1 mol/L potassium ion. The supernatant solutions were separated from the residues with the centrifugation, and 6 mol/L HCl was added into the supernatants until pH 1 for the re-precipitation of humic acid. After standing for 12 hours, the precipitates of humic acid were separated and collected with the centrifugation. Next, the
precipitates were suspended into 0.1 mol/L HCl and 0.3 mol/L (HF) and were shaken for 12 hours. Finally, humic acid was separated with the centrifugation.
Characterization of humic acid
Fourier Transform Infrared (FTIR) spectrometer (SHIMADZU KN S72-120, Japan) KBr–pellet technique (0.3 mg sample to 30mg KBr) was used for the characterization of humic acid. The spectra resolution was 4cm-1 and 100scans were averaged. Before making the pellets, the samples were dried in the desiccators to remove moisture completely and to avoid unexpected O-H peak for accumulated water molecules in the sample [11]. CHNS Analyzer (‘Elementar, Germany) was used to evaluate the elements of standard (BDH, England) and extracted (Buriganga river) humic acids. The elemental composition of the extracted humic acid was studied by means of Energy Dispersive X-ray (EDX, Princeton Gamma Tech Imix-PC with ultra-thin window detector) at 20keV energy [12].
Complexation study of humic acid and metals
In order to evaluate the complexation efficiency of humic acid with metals accurately 25mg standard humic acid was taken in 1L deionized water for preparing 25 mg/L humic acid. Then 0.5 M NaHCO3 (E Merck, Germany) was
also added into the suspension to provide a carbonate alkalinity similar to that of natural waters. Before the coagulant injection, the pH of synthetic waters was adjusted to pH 6 by drop wise addition of 0.1 M HCl [1]. The coagulant, commercial Ferric Chloride (FeCl3) (BDH,
England) and Cadmium Sulfate (3CdSO4. 7H2O)
(BDH, England) of various concentrations (3x10⁻⁴ M - 7x10⁻⁴) M were injected into 20.0 mL humic acid solution. The solutions (25mgL-1) of humic acid and the various metal concentrations (3x10⁻⁴ -7x10⁻⁴ M) of iron and cadmium salt were prepared in 10-3 M phosphate buffer solution (pH= 6.0±0.2). The buffer solution was used as a blank [11].
settle in graduated conic plastic holder for 24 hours. About 10 mL of supernatant was withdrawn with graduated pipette from upper of solution retained after complex formation. pH, conductivity, concentration and absorbance were monitored of the supernatant with the pH meter (Hanna 210), Conductometer (EYLA), Atomic Absorption Spectrophotometer (AA Analyst 800, Perkin Elmer, USA) and UV- visible spectrometer (UV-160A, SHIMADZU, Japan) with a resonance of 254.0 and 436.0 nm respectively [13]. For the comparison study, pH and molar conductance of (3x10⁻⁴ M - 7x10⁻⁴) M of ferric chloride and cadmium sulfate solution were monitored before and after complexation. Finally, the coagulated complex was separated with filter paper (Fisher, QL 100). The complex of humic acid and metals were dried with oven at 50-60o C. Then the complexes were characterized with EDX analyzer.
Results and Discussion
Preliminary observation of extracted humic acid
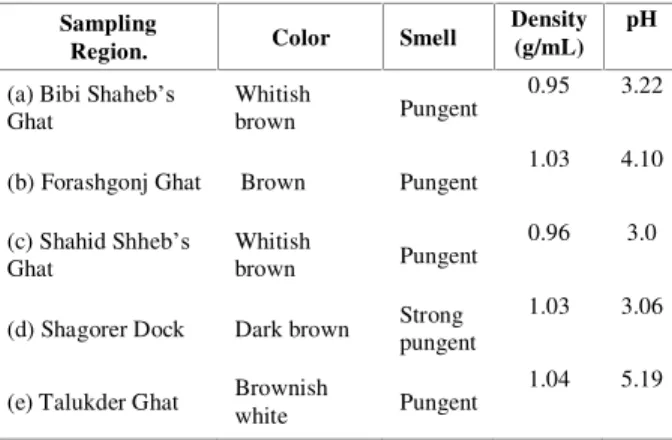
The extracted humic acid was preliminary examined. The results were presented in the Table 1. From the results, it was found that the colours of the extracted humic acid were varied with place to place though the smells of all the humic acid were pungent. It is due to the origin and age of humic acids produced on sediments in the different places of Buriganga River. However, they were all acidic in nature and its density varied from 0.95 to 1.04. The pH of humic acid was varied from 3.0 to 5.19. All these physical properties imply that the extracted humic acids constituents would be different with locations of the Buriganga River.
Table 1. Preliminary observations of the extracted humic acids.
Sampling
Region. Color Smell
Density (g/mL)
pH
(a) Bibi Shaheb’s
Ghat
Whitish
brown Pungent
0.95 3.22
(b) Forashgonj Ghat Brown Pungent
1.03 4.10
(c) Shahid Shheb’s
Ghat
Whitish
brown Pungent
0.96 3.0
(d) Shagorer Dock Dark brown Strong pungent
1.03 3.06
(e) Talukder Ghat Brownish
white Pungent
1.04 5.19
Characterization of humic acid
For the characterization of the extracted humic acid, the spectrum of the FTIR was recoded. The FTIR spectrums are presented in the (Fig. 3). The summarized results are presented in the Table 2. From the FTIR spectrum, there were signals found at 3300, 3200, 2960, 2920, 2600, 1725, 1650, 1400, 1070, 1010, 1000, 880, 860, 850, 840, 830, 700, 640 cm-1 respectively for different extracted humic acid. The infrared spectrum showed the structural composition of the humic acid present in the Buriganga River. This results indicated that the humic acids of Buriganga River might contain the phenolic hydroxyl groups, hydroxyl group, conjugated double bond of aromatic family (C=C), and free carboxyl groups. The humin had stronger absorption band of CH and CH3 in aliphatic group than that found in
humic acid. From the literature and the types of vibration found in Table 2, it can be concluded that the extracted humic acid contains a variety of functional groups, including carboxylic acid (COOH), phenolic hydroxy (OH), enolic (OH), alcoholic (OH), quinone, hydroxyl quinone, lactone, and ether [14].
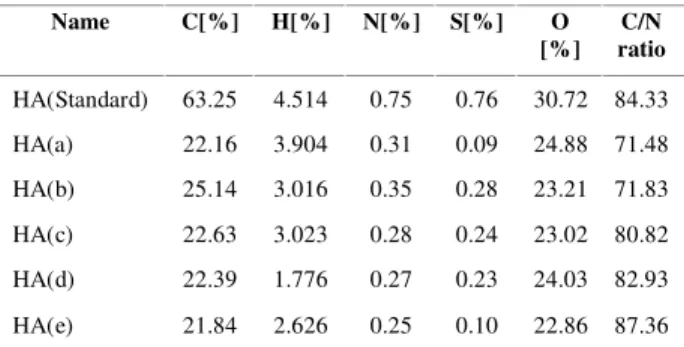
The elemental composition of the standard humic acid (peat, BDH, England) and the extracted humic acid (Buriganga River) were analyzed with CHNS analyzer. The percentage of C, H, N and S is presented in the Table 3. The organic C/N ratios can be used to help identify the origin of the organic matter in sediments. The C/N ratios of 5-8 indicate unaltered algal organic matter, whereas C/N ratios of 25-35 indicate fresh land-derived organic matter [3]. Though interpretation of C/N ratios was done with caution C/N ratios for the five samples (sample: a, b, c, d and e) were from 71.48 to 87.36. These high C/N values indicated that the humic acid present in the sediment of Buriganga River contained higher organic carbon than nitrogen.
Wave number (cm-1)
Figure 3. FTIR spectra of different extracted humic acid (sampling stations: a, b, c, d & e).
Table 2. Summarized FTIR spectra of extracted humic acid in the
zone 4000- 400cm-1 for the different sampling stations (Sample: a,
b, c, d and e).
Wave no. (cm-1) Region
(cm-1)
Type of vibration
3280(a),3300(b),3280(c), 3280(d),3300(e)
3400-3200, 3570-3450
H- bonded OH group
3000(d)
3050-3000
Aromatic C-H stretching
2960(a),2920(b),2920(c),296 0(d),2950(e)
2960-2850
Stretching of CH2,
CH3 group
2960(a),2930(b),2960(c),256 0(d),2600(e)
3000-2500
OH stretch of H-bonded -COOH
1725(e)
1725-1700
-C=O stretching of COOH
1550(a),1560(b),1580(d),155 0(e)
1610-1550
Carboxylate anion
1650(a),
1650(b),1640(c),1655(d),162 5(e)
1650-1450
Aromatic C=C stretching
1400(a),1400(b),1400(c),140 0(d),1400(e)
1485-1340
CH deformation of
CH3
1260(d),1250(e)
1265-1200
Symmetric –COO
-stretching
1120(a),1130(d)
1126-1100
C-O stretching of COOH
1070(a) ~1100,~
1050
-C-O stretching in aliphatic OH
700,830,880(a),700,860,880 (b)
840-690 Aromatic disubstituted
Table 3. Elemental composition of the standard and extracted humic acid.
Name C[%] H[%] N[%] S[%] O
[%] C/N ratio
HA(Standard) 63.25 4.514 0.75 0.76 30.72 84.33
HA(a) 22.16 3.904 0.31 0.09 24.88 71.48
HA(b) 25.14 3.016 0.35 0.28 23.21 71.83
HA(c) 22.63 3.023 0.28 0.24 23.02 80.82
HA(d) 22.39 1.776 0.27 0.23 24.03 82.93
HA(e) 21.84 2.626 0.25 0.10 22.86 87.36
N.B: a, b, c, d and e represents the sample of humic acids (HA).
Complexation study of Fe (III) and Cd (II) with humic acid
Chemical analysis
In the case of iron complexation with humic acid, at the concentration of iron 0.3 x 10⁻³ M, the pH of the solution was 5.76 and the conductance of the solution was 4.19 mS/cm. However, after complex formation, the concentration of iron in the supernatant was reduced to 4.48 x 10⁻⁷M. Moreover, the pH of the supernatant solution became 6.75 and the conductivity was also reduced to 2.68. On the other hand, increasing of concentration of Fe(III), the pH of the solution was reduced to 4.87. However, the conductivity of the solution was increased before complexation. After complexation, the pH of the supernatant was increased to 6.51, the iron content was 13.60 x10⁻⁷ and the conductivity was 2.89. This implies that the complex formation between Fe (III) and humic acid was occurred at the acidic pH of the solution. However, according to the literature the basic pH was not maintained to form complex between metal and humic acid. This result is presented in the Table 4.
From the Table 4, it is observed that the concentration of iron in supernatants decreases (4.48 x 10⁻⁷ to 3.94 x 10⁻⁷M) with increases of initial concentration (0.3 x 10⁻³M to 0.5 x 10⁻³M) of iron solution. This means coagulation was occurred slowly in this region (from the low change of concentration 4.48 x 10⁻⁷M to 3.94 x 10
-7
M). Then the concentration of iron in supernatant sharply increases (9.84x 10⁻⁷M to 13.60x 10⁻⁷M) for the initial concentration (0.6 x 10⁻³M to 0.7 x
10-3M). In this region coagulation was occurred in fewer amounts. In fine it can be said that coagulation behavior is maximum in the 0.5 x 10
-3
M to 0.6 x 10⁻³M of iron (III) chloride and humic acid (25 mg/L) at pH 6.0.
Table 4. Variation of pH and Conductivity with the change of concentration of Iron (III) in HA solution.
Before complexation After complexation
Concent-ration of iron(III) Solution (x10-3)M
pH Conduc-tivity (mS/cm)
Concent-ration of iron in supernatant (x 10-7) M
pH Conduc-tivity (mS/cm)
0.3 5.76 4.19 4.48 6.75 2.68
0.4 5.52 6.09 4.12 6.71 2.58
0.5 5.35 7.79 3.94 6.69 2.77
0.6 5.40 6.19 9.84 6.63 2.78
0.7 4.87 10.39 13.60 6.51 2.89
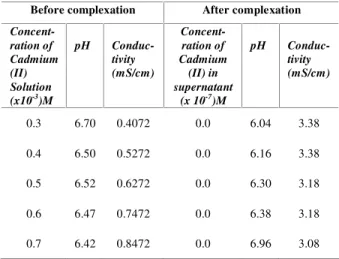
In the case of cadmium complexation with humic acid, similar experiments were carried out with variation of cadmium concentration. This result is presented in the Table 5. From the Table, it was found that the pH of the supernatant was slightly decreased however, the conductivity was increased after complex formation. The increase of conductivity was due to the release of sodium from the humic acid solution. Since 0.5 M NaHCO3 was
added into the suspension to provide a carbonate alkalinity similar to that of natural waters. Moreover, the concentration of cadmium was decreased for all the concentrations.
Table 5. Variation of pH and conductivity with the change of concentration of Cadmium (II) in HA solution.
Before complexation After complexation
Concent-ration of Cadmium (II) Solution (x10-3)M
pH Conduc-tivity (mS/cm)
Concent-ration of Cadmium (II) in supernatant
(x 10-7)M
pH Conduc-tivity (mS/cm)
0.3 6.70 0.4072 0.0 6.04 3.38
0.4 6.50 0.5272 0.0 6.16 3.38
0.5 6.52 0.6272 0.0 6.30 3.18
0.6 6.47 0.7472 0.0 6.38 3.18
0.7 6.42 0.8472 0.0 6.96 3.08
Complexation study with UV-Visible
Spectrophotometer
After the formation of metal humic complexes, the concentration of humic acid in the supernatant solution was measured with UV-Visible Spectrophotometer. Before quantify the humic acid using two ëmax (ë1= 254.0 nm and ë2= 436.0 nm), a calibration curve was prepared
with different concentrations of humic acid. Two ëmax was used in this experiment. It was
due to fact that ëmax: 254.0 nm for colorless
substances and ëmax: 436.0 nm for colored
moiety present in the humic acid. From this experiment, the degree of complexation of metal: humic acid was evaluated using the following equation:
Complexation: (Ao-A)/Ao x 100 (%)
Where, Ao is the initial concentration of
humic acid.
A is the final concentration of humic acid after complex formation.
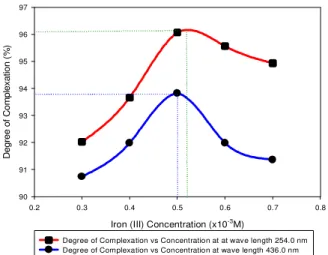
The results of this experiment are presented in (Fig. 4-A) and (Fig. 4-B) respectively. From the Figure 4-A), it can be said that at 254.0 nm wave length, complexation of humic acid with iron is maximum (96.18%) for 0.518x10⁻³M of Fe (III). This means that the colorless constituents of humic acid form maximum complex in this concentration of iron. Similarly, at 436.0 nm, complexation is maximum (93.81%) for 0.502 x10⁻³M of Fe (III). Here, the colored moiety of humic acid form maximum complex with concentration 0.502 x10⁻³M of Fe (III).
From the Figure 4-B, it can be said that at
ëmax = 254.0 nm, complexation of humic acid was
almost constant with the amount of cadmium. However, at ëmax 436.0 nm, the complexation was
Iron (III) Concentration (x10-3M)
0.2 0.3 0.4 0.5 0.6 0.7 0.8
D e g re e o f C o m p le x a tio n ( % ) 90 91 92 93 94 95 96 97
Degree of Complexation vs Concentration at at wave length 254.0 nm Degree of Complexation vs Concentration at wave length 436.0 nm
Figure 4(A). Degree of Complexation in percentage with variation of concentration of Iron (III) Chloride.
Cadmium(II) Concentration (x10-3
M)
0.2 0.3 0.4 0.5 0.6 0.7 0.8
D e g re e o f C o m p le x a ti o n ( % ) 90 92 94 96 98 100 102
Degree of Complexation vs Concentration at at wave length 254.0 nm Degree of Complexation vs Concentration at wave length 436.0 nm
Figure 4(B). Degree of Complexation in percentage with variation of concentration of Cadmium (II) Sulfate.
Jar test
Coagulation behavior of humic acid and iron (III) chloride and cadmium (II) sulfate was observed with Jar test [1]. The results of the Jar test are presented in the (Fig. 5-A) and (Fig. 5-B) respectively. From the (Fig. 5-A), it was found that the pH gradually decreased with iron addition from the initial suspension pH to a value close to 6.75, and it then drops to about pH 6.5 as ferric chloride hydrolysis exceeds the buffer capacity of the solution [1]. Conductivity measurements reveal three domains: at low coagulant concentration, the
conductivity increases; just before OCC (optimum coagulant concentration) a stronger increase in conductivity is observed. From OCC, the conductivity re-increases but with a lesser slope (almost parallel to x axis), and it exhibits another sharp increase around the restabilization concentration (0.60 x 10⁻³M). The point where the extrapolated steep portion of the pH curve intersects the x axis is chosen as optimum coagulant concentration (OCC). The value of OCC in this investigation is 0.51. Restabilization occurs from the point which value is 0.60.
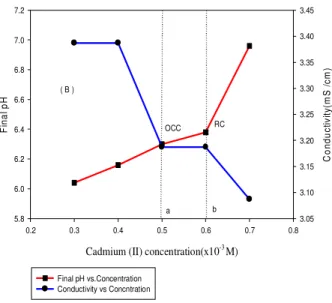
From the Figure 5(B), it is investigated that the final pH gradually increases with the addition of cadmium. The value of OCC in this investigation is 0.49. Restabilization occurs from the point which value is 0.60. Conductivity measurements reveal three domains: at low coagulant concentration, the conductivity decreases, just before OCC, a stronger decrease in conductivity is observed. From OCC, the conductivity almost constant with a lesser slope (almost parallel to x axis), and it exhibits another sharp decrease around the RC (restabilization concentration) (0.60 x10⁻³M). In fine it can be said that coagulation behavior is maximum in the 0.5 x 10⁻³M to 0.6 x 10⁻³M of cadmium (II) sulfate and humic acid (25mg/L) at pH 6.0.
Iron (III) concentration(x10-3M)
0.2 0.3 0.4 0.5 0.6 0.7 0.8
F in a l p H 6.45 6.50 6.55 6.60 6.65 6.70 6.75 6.80 C o n d u c ti v it y (m S / cm ) 2.55 2.60 2.65 2.70 2.75 2.80 2.85 2.90
Final pH vs.Concentration Conductivity vs Concntration
a b
OCC RC ( A )
Cadmium (II) concentration(x10-3M)
0.2 0.3 0.4 0.5 0.6 0.7 0.8
F
in
a
l
p
H
5.8 6.0 6.2 6.4 6.6 6.8 7.0 7.2
C
o
n
d
u
c
ti
v
it
y
(m
S
/
c
m
)
3.05 3.10 3.15 3.20 3.25 3.30 3.35 3.40 3.45
Final pH vs.Concentration Conductivity vs Concntration
a b
OCC RC
( B )
Figure 5(B). Jar -tests result at pH 6 for the 200/50 agitation sequence. Final pH (red line) and conductivity (blue line) versus Cadmium (II) Concentration; (OCC) and (RC) indicate the optimal coagulant concentration (OCC) and restabilization concentration (RC) respectively.
Characterization of extracted humic acid and metal complexes
The EDX spectrum of extracted humic acid is presented in the Fig. 6-A. From this Figure, it is observed that extracted humic acid contain carbon, nitrogen, oxygen, sulfur and chloride respectively. However, there is no peak of metal was observed in this spectrum. Fig 6-B represent the spectrum of humic acid and iron complex. In this Figure, the spectrum of carbon, nitrogen, oxygen, sulfur and iron were observed. Since this spectrum contains iron with other constituents, this proves the formation of iron: humic acid complex. (Fig. 6-C) represents the spectrum of humic acid: cadmium complex. In this Figure, the spectrum of carbon, nitrogen, sulfur, chloride and cadmium was observed. This cadmium containing spectrum also proved that cadmium could form complex with extracted humic acid of the Buriganga River.
Figure 6(A). EDX Spectrum of Extracted humic acid (Buriganga River) Full Scale Count: 321 and Live Time: 373.5 sec.
In
te
n
s
it
Figure 6(B). EDX Spectrum of humic acid and Iron (III) Complex Full Scale Count: 1113 and Live Time: 387.3 sec.
Figure 6(C). EDX Spectrum of humic acid and cadmium (II) Complex. Full Scale Count: 72 and Live Time: 370.5sec.
In
te
n
s
it
y
In
te
n
s
it
Complexation mechanism
It is assumed that humic acid can be existed in a low-density network of hydrophobic and hydrophilic moieties. Such nanocolloids change conformation according to their ionization state, can be built either from amphiphilic polymers or assemblies of small molecules, and accordance with previous models of the secondary structure of humic substances [15, 16, 17]. The formation of humic acid aggregates is then controlled by the number of coagulant species and two dynamic aspects: (i) the reconfirmation of humic network, and (ii) the collision rate of destabilized particles. An overall shrinkage of anionic humic network is indeed expected upon binding cationic coagulant species, which promotes the formation of intra- and inter-particle hydrophobic moieties particle hydrophobic domains according to the extent of neutralization. This suggests that, in addition to coagulant species, hydrophobic moieties participate in the flock build up. The classical aggregation mechanisms proposed in the literature to explain the coagulation of humic acid include charge neutralization/precipitation at acidic pH, and adsorption and /or sweep-flocculation in a hydroxide precipitate at alkaline pH. From our work, it can assumed that a similar charge neutralization/complexation with hydrolyzed iron and cadmium species occurs at the acidic pH, thus increasing the number of carboxylic groups available for complexation. It should be noted that hydrolyzed iron and cadmium species are known to interact strongly with NOM carboxylic groups, and that the humic network remain unaffected even in the over dosages range at acid pH with highly charged. As most of features of Buriganga River humic acid are similar to freshwater humic acid. The complexation/aggregation model described above should be general.
Conclusion
The characterization study of extracted humic acid revealed that humic acid of the Buriganga River contain aromatic hydrocarbons, enolic aldehyde/ ketone, carboxylate anions, carboxylic acids, intermolecular hydrogen bond (polymeric form) and aryl carboxylic acids etc. Moreover, the complexation reaction is mainly
responsible for charge neutralization of humic acid entities thus reducing humic acid colloid stability [18]. Since iron and cadmium can make a complex with humic acid of the Buriganga River, this complexation or coagulation process can be used to remove the high concentration of iron and cadmium from the surface water of this river. Further complexation study is essential with other metals.
Acknowledgment
The authors acknowledge the International Foundation for Science (IFS) for their financial support to carry out this research work.
References
1. E. Tripping, Cation Binding by humic substances: Cabridge University Press: Cambridge, UK, (2002).
2. J. M. Siéliéchi, B. S. Lartiges, G. J. Kyem, S. Hupont, C. Frochot, J. Theime, J. Ghanbaja, J. B. d’Espinose de la Caillerie, O. Barres, R. Kamga, P. Levitz and L. J. Michot, Water Res., 42 (2008) 2111.
3. G. Davies and E. A Ghabbor, Humic Substances: Structures, Properties and uses, Royel Society of Chemistry, Cambridge, (1998) 835.
4. J. Zumstein, J. Buffle, Water Res., 23 (1989) 229.
5. N. Narkis and M. Rebhun, J. Awwa (1977) 325.
6. C. F. Lin, T. Y. Lin and O. J. Hao, Water Res., 34 (2000)1097.
7. P. Bose and D. A. Reckhow, J. Environ. Eng. ASCE, 124 (1999) 803.
8. J. Dries, L. Bastiaens, D. Springael, S. Kuypers, S. N. Agathos and L. Diels, Water Res., 39 (2005) 3531.
9. S. Suteerapataranon, M. Bouby and H. Geckeis, Water Res., 40 (2006) 2044.
10. R. S. Swift, Organic matter characterization. In D. L. Sparks (ed.), Methods of soil analysis, Part 3: Chemical methods. SSSA Book, Series No. 5. SSSA and ASA, Madison, (1996) 1011.
12. J. Dries, L. Bastiaens, D. Springael, S. Kuypers, S. N. Agathos and L. Diels, Water Res., 39 (2005) 3531.
13. M. A. Rahman S. Kaneco, T. Suzuki, H. Katsumata, K. Ohta and A. M. Shafiqul Alam, Pak. J. Anal. Environ. Chem., 8 (2007) 26.
14. Y. R. Sharma, Elementary Organic Spectroscopy, 3/e (1999) 65.
15. K. Ghosh and M. Schnitzer, Soil Sci., 129 (1980) 266.
16. A. Piccolo, Soil Sci., 166 (2001) 810.
17. J. F. L. Duval, K. J. Wilkinson, H. P. Van Leeuwen and J. Buffle, Environ. Sci. Technol., 39 (2005) 6435.
18. A. –V. Jung, V. Chanudet, J. Ghanbajo, B. S. Lartiges and J. –L. bersillon, Water Res., 39 (2005) 3849.
19. Y. Cao, M. Conklin and E. Betterton, Environ Health Perspect., 103 (Suppl 1) (1995) 29.